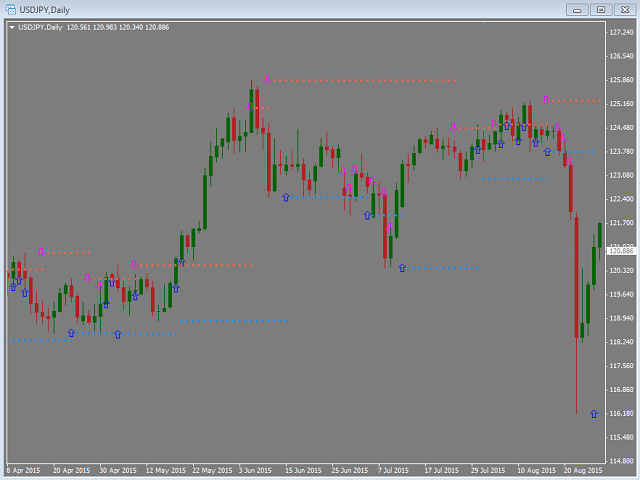
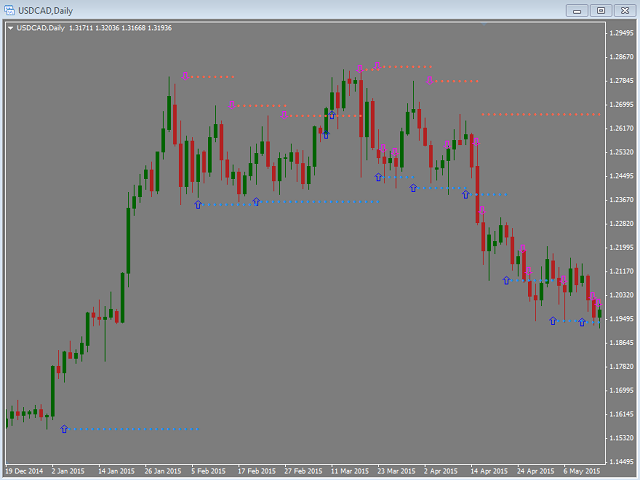
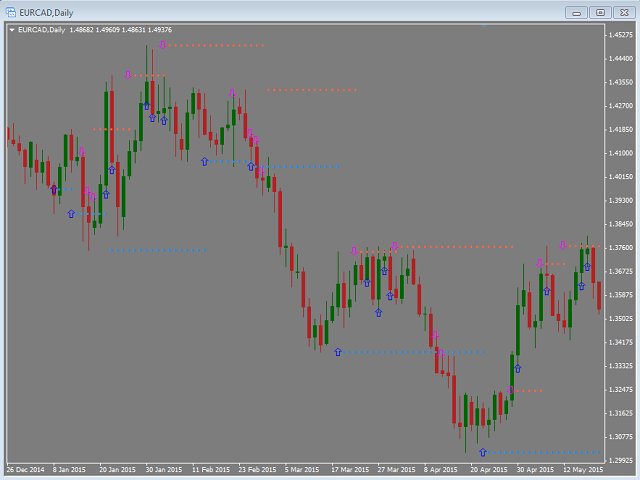
Suport Resistance

The indicator compares Fractal and Zigzag indicators to define hard Support and Resistance.

The arrow signal appears when a new support or resistance emerges or when the price breaks through Support and Resistance zone.

This indicator is efficient in conjunction with a rebound and breakout strategy.

It works well on H4 and D1 for all pairs.


Settings

  • BarCounts = 200;
  • FastPeriod = 7 - fast period
  • SlowPeriod = 14 - slow period
  • Show_SR = true - show support/resistance
  • Show_Arrows = true - show up/down arrows
  • Alert_Settings = "+++++++++++++++++++++++";
  • SendMailMode = false - send a signal email
  • SendNotificationMode = false - send a push notification to your phone
  • AlertMode = false - sound alert
추천 제품
Doji Engulfing Paths
Boubacar Tidiane Traore
Presentation Doji Engulfing Paths enables to get signals and data about the doji and the engulfing patterns on charts. It makes it possible to get opportunities from trends, and to follow the directional moves to get some profits on the forex and stocks markets. It is a good advantage to take all the appearing opportunities with reversal signals and direct signals in order to obtain some profits on the forex market. System features With fast execution, it allows to register directly the informa
KT 4 Timeframe Trend MT4
KEENBASE SOFTWARE SOLUTIONS
The KT 4 Time Frame Trend is an invaluable forex indicator for traders seeking to identify the trend direction across 4-time frames accurately. This innovative indicator allows users to simultaneously observe and analyze price trends across four different timeframes. Whether you're a beginner or an experienced trader, this tool offers an enhanced understanding of trend dynamics, leading to improved trading strategies on your trading platform. The capability to concurrently monitor multiple timef
VR Cub
Vladimir Pastushak
VR Cub 은 고품질 진입점을 얻는 지표입니다. 이 지표는 수학적 계산을 용이하게 하고 포지션 진입점 검색을 단순화하기 위해 개발되었습니다. 지표가 작성된 거래 전략은 수년 동안 그 효율성을 입증해 왔습니다. 거래 전략의 단순성은 초보 거래자라도 성공적으로 거래할 수 있다는 큰 장점입니다. VR Cub은 포지션 개시 지점과 이익 실현 및 손절매 목표 수준을 계산하여 효율성과 사용 편의성을 크게 높입니다. 간단한 거래 규칙을 이해하려면 아래 전략을 사용한 거래 스크린샷을 살펴보세요. 설정, 세트 파일, 데모 버전, 지침, 문제 해결 등은 다음에서 얻을 수 있습니다. [블로그] 다음에서 리뷰를 읽거나 작성할 수 있습니다. [링크] 버전 [MetaTrader 5] 진입점 계산 규칙 포지션 개설 진입점을 계산하려면 VR Cub 도구를 마지막 최고점에서 마지막 최저점까지 늘려야 합니다. 첫 번째 지점이 두 번째 지점보다 빠른 경우, 거래자는 막대가 중간선 위에서 마감될 때까지 기다립니다
The Best Choice compra y venta
Sandro Israel Hernandez Zamora
¿Has escuchado decir que la tendencia es tu amiga? pues nada es mas cierto en el mundo del trading. Este indicador analiza las tendencias y su fuerza para que puedas aprovecharlas y utilizamos un conjunto de indicadores como RSI, %W, MACD y EMAS para analizar el mercado y sus movimientos, por lo que podrás mantener tu gráfico limpio sabiendo que todos estos indicadores los tienes en uno solo. Este, como cualquier indicador, no representa una certeza de compra o venta definitiva, por lo siempre r
KT Horizontal Lines MT4
KEENBASE SOFTWARE SOLUTIONS
MetaTrader에서 여러 개의   수평선을   그린 후 각 수평선의 가격을 추적하는 것은 번거로운 작업이 될 수 있습니다. 이 인디케이터는 가격 알림 설정, 지지/저항선 표시 및 기타 수동 목적을 위해 동일한 간격으로 여러 수평선을 자동으로 그려줍니다. 이 인디케이터는 빠른 매수 및 매도를 통해 수익을 얻고자 하는 초보 외환 트레이더에게 적합합니다. 수평선은 시장이 추세를 따르거나 횡보 중일 때 거래 진입 가능성이 있는 구간을 찾는 데 유용합니다. 기능 입력 설정에 따라 여러 수평선을 즉시 자동으로 표시합니다. 여러 수평선을 쉽게 구분할 수 있도록 생동감 있는 색상 테마 제공. 여러 거래 세션의 가격 범위를 추적하는 데 유용한 필수 도구입니다. 가격이 수평선에 도달하면 알림을 전송합니다. 지나친 반복 알림을 방지하기 위해 알림 간격 설정 가능. 완전한 사용자 맞춤 설정 지원. 설명 이 인디케이터는 입력 설정에서 지정된 값과 지시에 따라 수평선을 표시합니다. 가격이 수평선에서
ACB Breakout Arrows
KEENBASE SOFTWARE SOLUTIONS
4.12 (33)
ACB Breakout Arrows 지표는 특별한 돌파 패턴을 감지하여 시장에서 매우 중요한 진입 신호를 제공합니다. 이 지표는 차트를 지속적으로 스캔하며 한 방향으로 안정적인 모멘텀이 형성되는지를 확인하고, 주요 움직임 직전에 정확한 진입 신호를 제공합니다.  다중 심볼 및 다중 타임프레임 스캐너 받기 – ACB Breakout Arrows MT4용 스캐너 주요 기능 지표가 자동으로 손절(Stop Loss) 및 이익실현(Take Profit) 레벨을 제공합니다. 모든 시간대의 돌파 신호를 추적하는 MTF 스캐너 대시보드가 포함되어 있습니다. 단타 트레이더, 스윙 트레이더, 스캘퍼에게 적합합니다. 정확도를 높이기 위한 최적화된 알고리즘 사용. 손익분기(Breakeven) 또는 단기 목표를 위한 특수 라인(퀵 프로핏 라인) 제공. 승률, 성공률, 평균 수익 등과 같은 성과 분석 지표 제공. 리페인트 없음 – 한번 생성된 신호는 사라지지 않습니다. 거래 확인 -  신뢰도 낮은 신호를
인기 있는   Bollinger Band 돌파 전략을   향상시키기 위해 고안된 강력한 기술 지표인   Bollinger Band Volume Breakout Detector를   소개합니다. 이 지표는 볼륨 데이터를 통합하여 잘못된 신호를 효과적으로 최소화함으로써 다음 단계로 추세 추종을 수행합니다. "볼륨 확인 가격" 원칙을 준수함으로써 이 도구를 통해 거래자는 거래량의 상당한 증가와 함께 가격 돌파를 식별하여 보다 정확한 거래 결정을 내릴 수 있습니다. 지표의 사용자 정의 가능성은 트레이더가 볼륨 데이터를 활용하여 자신의 전략을 미세 조정할 수 있도록 합니다. 이 지표의 주요 기능 중 하나는 완전히 사용자 정의할 수 있는 Bollinger Band로, 개인의 선호도에 맞출 수 있습니다. 또한 볼륨 데이터의 통합은 이동 평균(MA)에 대한 색상 코드 전투를 통해 시각적으로 표시되어 22일 평균과 관련하여 볼륨 돌파를 쉽게 식별할 수 있습니다. 트레이더는 모바일 알림, 팝업 메시지
HC ARROW
Cuong Pham
The indicator shows you buy/sell signals and does not repaint. It works well with almost all pairs, while the best ones are GBPUSD, XAUUSD and EURUSD. The product works better on H1 and H4. You can change the parameters in the inputs tab to get the best signals and the best trade results on each pair. You can enable/disable alerts when signal appears. The indicator is easy to use. Parameters barstrip & Sensitive: amount of bars to process the highest and lowest prices (relates to the internal l
"다이나믹 스캘핑 오실레이터"는 MT4를 위한 고급 맞춤형 암호화폐/외환 지표이자 효율적인 트레이딩 도구입니다! - 차세대 오실레이터 - 사용 방법은 그림을 참조하세요. - 다이나믹 스캘핑 오실레이터는 적응형 과매도/과매수 영역을 제공합니다. - 오실레이터는 동적인 과매도/과매수 영역에서 정확한 진입 시점을 찾는 보조 도구입니다. - 과매도 값: 녹색선 아래, 과매수 값: 주황색선 위. - 이 지표는 가격 변동 패턴과도 결합하기 좋습니다. - 일반 오실레이터보다 훨씬 정확합니다. 적합한 시간대: M30, H1, H4, D1, W1. - PC 및 모바일 알림 기능 제공. .......................................................................... 여기를 클릭하여 고품질 트레이딩 로봇과 지표를 확인하세요! MQL5 웹사이트에서만 제공되는 오리지널 제품입니다.
KT Renko Patterns MT4
KEENBASE SOFTWARE SOLUTIONS
2.33 (3)
KT Renko Patterns는 렌코 차트를 벽돌 하나하나 분석하여, 전 세계 다양한 금융 시장에서 트레이더들이 자주 사용하는 유명한 차트 패턴들을 찾아냅니다. 시간 기반 차트와 비교하면, 렌코 차트는 시각적으로 단순하고 깔끔하여 패턴 중심의 트레이딩이 훨씬 쉽게 가능합니다. KT Renko Patterns에는 다양한 렌코 패턴이 포함되어 있으며, 이 중 상당수는 Prashant Shah의 저서 『Profitable Trading with Renko Charts』에서 자세히 설명되어 있습니다. KT Renko Patterns 인디케이터를 기반으로 한 100% 자동화된 EA는 여기에서 이용할 수 있습니다 - KT Renko Patterns EA . 기능 소개 최대 8개의 명확한 렌코 패턴을 거래할 수 있어, 혼동 없이 신뢰도 높은 트레이딩이 가능합니다. 객관성을 제공하기 위해 각 패턴에는 손절선과 피보나치 목표가 함께 제공됩니다. KT Renko Patterns는 각 패턴의 정
Gold Titan King Scalper
Dodong Christian Arnon
Indicator Description GOLD TITAN KING SIGNAL INDICATOR High-Precision Gold Scalping Buy/Sell Signals – Manual Trading Assistant Overview The Gold Titan King Signal Indicator is a manual trading assistant tool designed for high-frequency scalping on Gold (XAUUSD) and other major pairs. It generates clear BUY/SELL signals with precise entry levels, along with adjustable Stop Loss and Take Profit levels displayed directly on the chart. ️ This tool is NOT an EA. It does not execute trades
Auto Fibo Pro m
DMITRII GRIDASOV
"Auto FIBO Pro" Crypto_Forex 지표 - 거래에 유용한 보조 도구입니다! - 지표는 자동으로 Fibo 수준과 로컬 추세선(빨간색)을 계산하여 차트에 배치합니다. - Fibonacci 수준은 가격이 반전될 수 있는 주요 영역을 나타냅니다. - 가장 중요한 수준은 23.6%, 38.2%, 50%, 61.8%입니다. - 역전 스캘핑이나 존 그리드 거래에 사용할 수 있습니다. - Auto FIBO Pro 지표를 사용하여 현재 시스템을 개선할 수 있는 기회도 많습니다. - Info Spread Swap Display가 있습니다. 현재 Spread와 Swap이 부착된 외환 쌍을 표시합니다. - 디스플레이에는 계정 잔액, 자본 및 마진도 표시됩니다. - 차트의 어느 모서리에서나 Info Spread Swap Display를 찾을 수 있습니다. 0 - 왼쪽 상단 모서리, 1 - 오른쪽 상단, 2 - 왼쪽 하단, 3 - 오른쪽 하단. 여기를 클릭하여 고품질 트레이딩 로봇과
Stochastic BR
Antony Augustine
Stochastic BR allows you to recognize reversals professionally. The "Stochastic BR" is designed to recognize profitable counter trend patterns from your chart. Stochastic Indicator: This technical indicator was developed by George Lane more than 50 years ago. The reason why this indicator survived for so many years is because it continues to show consistent signals even in these current times. The Stochastic indicator is a momentum indicator that shows you how strong or weak the current trend i
SMC Venom Model BPR 지표는 Smart Money(SMC) 개념 내에서 일하는 트레이더를 위한 전문 도구입니다. 가격 차트에서 두 가지 주요 패턴을 자동으로 식별합니다. FVG (공정 가치 갭)는 3개의 캔들의 조합으로, 첫 번째와 세 번째 캔들 사이에 갭이 있습니다. 이는 볼륨 지원이 없는 레벨 사이에 구역을 형성하여 종종 가격 수정으로 이어집니다. BPR (균형 가격 범위)은 두 개의 FVG 패턴의 조합으로, "브리지"를 형성합니다. 이는 가격이 낮은 볼륨 활동으로 움직일 때 브레이크아웃과 레벨로의 복귀 구역으로, 캔들 사이에 갭을 생성합니다. 이러한 패턴은 거래자가 차트에서 거래량과 가격 역학을 분석하여 주요 지지/저항 수준, 돌파 구역 및 진입 지점을 식별하는 데 도움이 되며, 여기서 대형 시장 참여자와 일반 참여자 간의 상호 작용이 발생합니다. 이 지표는 사각형과 화살표 형태로 패턴을 시각화하며 유연한 경고 설정도 지원합니다. 주요 특징: 패턴 표시 모드:
The new update makes this indicator a complete tool for studying, analyzing and operating probabilistic patterns. It includes: On-chart Multi-asset percentage monitor. Configurable martingales. Twenty-one pre-configured patterns , including Mhi patterns and C3. An advanced pattern editor to store up to 5 custom patterns. Backtest mode to test results with loss reports. Trend filter. Hit operational filter. Martingale Cycles option. Various types of strategies and alerts. Confluence between patte
Please follow the "How To Trade" instructions exactly for best results Wycoff theory is vastly used by institutional traders but when it comes to retail traders the concept isn't well understood by most. It is even more difficult to implement in intraday & swing trading. This No REPAINT indicator helps you in analyzing the market cycles and plots buy/sell signals at the start of trending phase. It studies the market strength of bulls and bears and does a effort Vs reward matrix calculation befor
KT Pin Bar
KEENBASE SOFTWARE SOLUTIONS
KT Pin Bar identifies the pin bar formation which is a type of price action pattern which depicts a sign of reversal or rejection of the trend. When combined with support and resistance, BRN and other significant levels, Pin Bar pattern proved to be a very strong sign of reversal. Basically, a pin bar is characterized by a small body relative to the bar length which is closed either in upper or lower 50% part of its length. They have very large wicks and small candle body. A pin bar candlestic
PZ Trend Trading
PZ TRADING SLU
4.8 (5)
Capture every opportunity: your go-to indicator for profitable trend trading Trend Trading is an indicator designed to profit as much as possible from trends taking place in the market, by timing pullbacks and breakouts. It finds trading opportunities by analyzing what the price is doing during established trends. [ Installation Guide | Update Guide | Troubleshooting | FAQ | All Products ] Trade financial markets with confidence and efficiency Profit from established trends without getting whip
Indicator. "Indicator wave or Indicator Ma". Using 23 standard indicators and the author's algorithm, the levels of purchases (from 0 to +100) and sales (from 0 to -100) are calculated. Then, using the calculated levels, the "Wave Indicator" draws a wave with 21 moving averages. The wave number is equal to the averaging period of the calculated levels. Waves # 1 - 7 Fast Moving Averages Waves from No. 8 -14 moving averages Waves from No. 15-21 slow moving averages Looking at the figures drawn
Crypto_Forex 지표 "Morning Star pattern" for MT4. - 지표 "Morning Star pattern"은 가격 액션 거래에 매우 강력한 지표입니다. 다시 칠할 필요 없고 지연도 없습니다. - 지표는 차트에서 강세 Morning Star 패턴을 감지합니다. 차트에 파란색 화살표 신호가 있습니다(그림 참조). - PC, 모바일 및 이메일 알림이 있습니다. - 또한 형제인 약세 "Evening Star pattern" 지표도 사용할 수 있습니다(아래 링크를 따라가세요). - 지표 "Morning Star pattern"은 지지/저항 수준과 결합하기에 매우 좋습니다. 여기를 클릭하여 고품질 트레이딩 로봇과 지표를 확인하세요! 이것은 이 MQL5 웹사이트에서만 제공되는 오리지널 제품입니다.
Trend Ray
Andriy Sydoruk
The indicator shows the potential trend direction by cyclical-wave dependence. Thus, all the rays of the intersection will be optimal rays, in the direction of which the price is expected to move, taking into account the indicator period. Rays can be used as a direction for potential market movement. But we must not forget that the approach must be comprehensive, the indicator signals require additional information to enter the market.
MACD Divergence
Sergey Deev
2.5 (2)
The indicator detects divergence signals - the divergences between the price peaks and the MACD oscillator values. The signals are displayed as arrows in the additional window and are maintained by the messages in a pop-up window, e-mails and push-notifications. The conditions which formed the signal are displayed by lines on the chart and in the indicator window. Indicator Parameters MacdFast - fast MACD line period MacdSlow - slow MACD line period MacdSignal - MACD signal line period MacdPric
Rainbow Price Visualizer
Vincent Jose Proenca
Rainbow Price Visualizer v1.21 See where the market really breathes. Turns your MT4 chart into an ultra-precise heatmap that highlights price zones favored by big players. Why it matters 300 price levels at 0.2‑pip resolution — microscopic detail. 8 visual themes (Rainbow, Fire, Ocean…) for instant readibility. Smart opacity: low noise fades, real zones pop. Lightweight rendering with automatic cleanup. Fully customizable: saturation, opacity, resolution, history depth. Bands project into the f
If you are good at trading at levels This indicator is all you need levels to manage your trades Market is usually follow current trend when break out some levels or reverse Trade at the Institutional traders level with the best supply and demand zone indicator available in MT4 and MT5 The Secret Profit Levels Signals indicator for MT4 is a complete trading system that provides traders with the entry price and 2 take profit levels. Technical analysts use support and resistance levels to identi
Super Reversal Pattern
Parfait Mujinga Ndalika
Super Reversal Pattern Indicator Unlock the power of advanced pattern recognition with our Super Reversal Pattern Indicator. Designed for traders seeking precision and reliability, this indicator identifies one of the most effective reversal patterns in technical analysis, offering a significant edge in your trading strategy. Key Features: Non-Repainting Accuracy: Enjoy the confidence of non-repainting technology. Once a Super Reversal Pattern is detected, it remains static, providing consiste
JapaneseBreakout
Ahmet Metin Yilmaz
Instructions Attach the indicator to any chart (advised H4) Use input tabs (defaults are 5 and false ) Press ok and continue trading. Description The indicator uses a kind of pattern breakout strategy to help your trading strategy. I am using this strategy on H4 charts for many of pairs with a trailing stop and default indicator settings. Better results are shown on USDJPY, EURJPY, CADJPY, EURGBP, EURUSD, USDCAD, USDCHF, NZDUSD and GBPUSD. Trailing stops should be different for each pair. The b
Market Structure Zig Zag
Lesedi Oliver Seilane
4.66 (29)
Free Market structure zig zag to assist in price action trading the screenshots describe how to use and how to spot patterns new version comes with alerts, email alert and  push notification alert can be used on all pairs  can be used on all timeframes  you can add additional confirmation indicators the indicator shows you your higher high and low highs as well as your lower lows and lower highs  the indication makes price action analysis easier to spot.
FREE
Wolfe Wave Scanner
Jalitha K Johny
4.5 (2)
Wolfe Waves scanner - It scans all the Symbols and identify the movement of price and it gives confidence in trade. It automatically plots  fifth wave breaks out of the channel. According to the theory behind the pattern, a line drawn from the point at the beginning of the first wave and passing through the beginning of the fourth wave predicts a target price for the end of the fifth wave. If a trader properly identifies a Wolfe Wave as it forms, the beginning of the fifth wave represents an op
FreqoMeterForecast
Stanislav Korotky
The main idea of this indicator is rates analysis and prediction by Fourier transform. Indicator decomposes exchange rates into main harmonics and calculates their product in future. You may use the indicator as a standalone product, but for better prediction accuracy there is another related indicator - FreqoMaster - which uses FreqoMeterForecast as a backend engine and combines several instances of FreqoMeterForecast for different frequency bands. Parameters: iPeriod - number of bars in the ma
Alpha Trend sign has been a very popular trading tool in our company for a long time. It can verify our trading system and clearly indicate trading signals, and the signals will not drift. Main functions: Based on the market display of active areas, indicators can be used to intuitively determine whether the current market trend belongs to a trend market or a volatile market. And enter the market according to the indicator arrows, with green arrows indicating buy and red arrows indicating se
이 제품의 구매자들이 또한 구매함
Miraculous Indicator – Gann Square of Nine 기반 100% 비리페인트 Forex 및 바이너리 도구 이 영상은 Miraculous Indicator 를 소개합니다. 이 지표는 Forex 및 바이너리 옵션 트레이더를 위해 특별히 개발된 매우 정확하고 강력한 트레이딩 도구입니다. 이 지표가 독특한 이유는 전설적인 **Gann Square of Nine(Gann 9의 사각형)**과 **Gann's Law of Vibration(Gann 진동의 법칙)**에 기반을 두고 있기 때문입니다. 이는 현대 트레이딩에서 가장 정밀한 예측 도구 중 하나로 손꼽힙니다. Miraculous Indicator는 완전히 비리페인트(non-repaint) 됩니다. 즉, 캔들이 마감된 후에도 신호가 변경되거나 사라지지 않습니다. 보이는 것이 곧 결과입니다. 이는 트레이더가 자신감을 가지고 거래에 진입하고 청산할 수 있는 신뢰할 수 있고 일관된 기반을 제공합니다. 주요 특징: Gann
Precautions for subscribing to indicator This indicator only supports the computer version of MT4 Does not support MT5, mobile phones, tablets The indicator only shows the day's entry arrow The previous history arrow will not be displayed (Live broadcast is for demonstration) The indicator is a trading aid Is not a EA automatic trading No copy trading function The indicator only indicates the entry position No exit (target profit)  The entry stop loss point is set at 30-50 PIPS Or the front hi
Gann Made Easy
Oleg Rodin
4.83 (155)
Gann Made Easy 는 mr.의 이론을 사용하여 최고의 거래 원칙을 기반으로 하는 전문적이고 사용하기 쉬운 Forex 거래 시스템입니다. W.D. 간. 이 표시기는 Stop Loss 및 Take Profit Levels를 포함하여 정확한 BUY 및 SELL 신호를 제공합니다. PUSH 알림을 사용하여 이동 중에도 거래할 수 있습니다. 거래 팁, 보너스, GANN MADE EA를 무료로 받으시려면 구매 후 저에게 연락주세요! 아마도 Gann 거래 방법에 대해 이미 여러 번 들었을 것입니다. 일반적으로 Gann의 이론은 초보자 거래자뿐만 아니라 이미 거래 경험이 있는 사람들에게도 매우 복잡한 것입니다. Gann의 거래 방식은 이론적으로 적용하기 쉽지 않기 때문입니다. 나는 그 지식을 연마하고 Forex 지표에 최고의 원칙을 적용하기 위해 몇 년을 보냈습니다. 표시기는 적용하기가 매우 쉽습니다. 차트에 첨부하고 간단한 거래 권장 사항을 따르기만 하면 됩니다. 지표는 지속적으로 시장
M1 Sniper
Oleg Rodin
5 (18)
M1 SNIPER 는 사용하기 쉬운 거래 지표 시스템입니다. M1 시간대에 맞춰 설계된 화살표 지표입니다. 이 지표는 M1 시간대 스캘핑을 위한 단독 시스템으로 사용할 수 있으며, 기존 거래 시스템의 일부로도 사용할 수 있습니다. 이 거래 시스템은 M1 시간대 거래용으로 특별히 설계되었지만, 다른 시간대에도 사용할 수 있습니다. 원래는 XAUUSD와 BTCUSD 거래를 위해 이 방법을 설계했지만, 다른 시장 거래에도 유용하다는 것을 알게 되었습니다. 이 지표의 신호는 추세 방향과 반대로 거래될 수 있습니다. 저는 지표의 신호를 활용하여 양방향으로 거래할 수 있도록 돕는 특별한 거래 기법을 알려드립니다. 이 방법은 특별한 동적 지지선과 저항선 가격 영역을 활용하는 것을 기반으로 합니다. 구매하시면 M1 SNIPER 화살표 지표를 바로 다운로드하실 수 있습니다. 또한, 아래 스크린샷에 표시된 Apollo Dynamic SR 지표는 M1 SNIPER 도구를 사용하는 모든 사용자에게 무료로
Meravith
Ivan Stefanov
5 (2)
마켓 메이커를 위한 도구. Meravith는 다음과 같은 기능을 제공합니다: 모든 타임프레임을 분석하고 현재 유효한 추세를 표시합니다. 강세와 약세 거래량이 동일한 유동성 구간(거래량 균형 구간)을 강조 표시합니다. 서로 다른 타임프레임의 모든 유동성 레벨을 차트에 직접 표시합니다. 텍스트 기반 시장 분석을 생성하여 참고용으로 제공합니다. 현재 추세를 기반으로 목표가, 지지선 및 손절가를 계산합니다. 거래의 위험 대비 보상 비율(Risk/Reward)을 계산합니다. 계좌 잔고에 따라 포지션 크기를 산출하고 잠재 수익을 추정합니다. 시장에 중대한 변화가 발생할 경우 경고도 제공합니다. 지표의 주요 라인: 강세/약세 거래량 소진 라인 — 목표가로 사용됩니다. 시장 추세를 나타내는 라인. 시장이 강세인지 약세인지에 따라 색상이 변경되며 추세 지지선 역할을 합니다. 색상은 주로 시장 심리를 보여줍니다. 거래량 균형선(Eq). Eq(Volume Equilibrium) 라인은 시스템의 핵심입니
RFI levels PRO
Roman Podpora
5 (1)
사전 지표       시장 반전 수준과 영역을 파악하여   가격이 해당 수준으로 되돌아올 때까지 기다렸다가 새로운 추세의 시작점에서 진입할 수 있도록 해줍니다. 즉, 추세의 끝에서 진입하는 것이 아닙니다. 그는 보여준다       반전 수준       시장이 방향 전환을 확인하고 추가적인 움직임을 형성하는 지점입니다. 이 지표는 차트를 다시 그릴 필요 없이 작동하며, 모든 금융 상품에 최적화되어 있고, 특정 금융 상품과 함께 사용할 때 최대의 잠재력을 발휘합니다.       트렌드 라인즈 프로       지시자. 모든 계측기에 적용 가능한 가역 구조 스캐너 모든 거래 상품을 자동으로 추적하고 모든 R-반전 패턴을 즉시 식별하여 LOGIC AI 신호가 이미 존재하는 위치와 기타 유용한 정보를 표시합니다. 로직 AI – 진입점을 표시해주는 도우미 시장 진입에 가장 적합한 시점을 판단하는 지능형 신호입니다. TPSproSYSTEM 알고리즘을 사용하여 가격 변동, 추세 및 주요 시장 참
Game Changer Indicator
Vasiliy Strukov
4.37 (19)
Game Changer는 모든 금융 상품에 적용 가능한 혁신적인 추세 지표로, MetaTrader를 강력한 추세 분석 도구로 탈바꿈시켜 줍니다. 모든 시간대에서 작동하며 추세 식별, 잠재적 반전 신호 제공, 트레일링 스톱 기능, 그리고 신속한 시장 대응을 위한 실시간 알림 기능을 제공합니다. 숙련된 전문가든 이제 막 시작하는 초보자든, Game Changer는 추세의 역학을 명확하게 이해하고 자신감 있고 규율 있는 거래를 할 수 있도록 도와줍니다. 이 지표는 차트 재구성 기능을 지원합니다. 구매 후 즉시 연락 주시면 특별 보너스를 드립니다. Strong Support 및 Trend Scanner 지표를 무료로 제공해 드립니다. [email protected]으로 메시지를 보내주세요. 참고로, 저는 텔레그램에서 EA나 특별 세트를 판매하지 않습니다. 모든 EA는 MQL5에서만 사용 가능하며, 세트 파일은 제 블로그(여기)에서만 다운로드하실 수 있습니다. 사기꾼을 조심하시고 다른 사
MetaForecast M4
Vahidreza Heidar Gholami
5 (2)
MetaForecast는 가격 데이터의 조화를 기반으로 모든 시장의 미래를 예측하고 시각화합니다. 시장이 항상 예측 가능한 것은 아니지만 가격에 패턴이 있다면 MetaForecast는 가능한 정확하게 미래를 예측할 수 있습니다. 다른 유사한 제품과 비교했을 때, MetaForecast는 시장 동향을 분석하여 더 정확한 결과를 생성할 수 있습니다. 입력 매개변수 Past size (과거 크기) MetaForecast가 미래 예측을 생성하기 위한 모델을 만드는 데 사용하는 막대의 수를 지정합니다. 모델은 선택한 막대 위에 그려진 노란색 선으로 표시됩니다. Future size (미래 크기) 예측해야 할 미래 막대의 수를 지정합니다. 예측된 미래는 핑크색 선으로 표시되며 그 위에 파란색 회귀선이 그려집니다. Degree (차수) 이 입력은 MetaForecast가 시장에서 수행할 분석 수준을 결정합니다. Degree 설명  0 차수 0의 경우, "Past size" 입력에 모든 봉우리와
PRO Renko System
Oleg Rodin
5 (30)
PRO Renko System 은 RENKO 차트 거래를 위해 특별히 고안된 매우 정확한 거래 시스템입니다. 이것은 다양한 거래 상품에 적용될 수있는 보편적 인 시스템입니다. 체계는 효과적으로 당신에게 정확한 반전 신호에 접근을 주는 소위 시장 소음을 중화합니다. 이 표시기는 사용하기가 매우 쉽고 신호 생성을 담당하는 매개 변수가 하나만 있습니다. 당신은 쉽게 당신의 선택의 어떤 무역 계기에 공구를 적응시킬 수 있고 renko 막대기의 크기. 나는 항상 당신이 내 소프트웨어로 수익성있게 거래 할 수 있도록 추가 지원을 제공 할 준비가되어 있습니다! 나는 당신에게 행복하고 수익성있는 거래를 기원합니다! 구매 후 저에게 연락하십시오! 내 렌코 차트 생성기를 보내드립니다. 또한 내 개인 권장 사항 및 시스템의 다른 모듈을 무료로 공유 할 것입니다!
GoldRush Trend Arrow Signal
Kirk Lee Holloway
5 (2)
GoldRush 트렌드 화살표 신호 GoldRush 트렌드 화살표 신호 지표는 XAU/USD 시장에서 고속 단기 스캘핑 트레이더를 위해 설계된 정밀한 실시간 트렌드 분석을 제공합니다. 1분 시간대에 특화되어 설계된 이 도구는 명확한 진입점을 표시하는 방향성 화살표를 제공하여 스캘퍼들이 변동성이 높은 시장 환경에서도 자신 있게 거래할 수 있도록 합니다. 이 지표는 PRIMARY 및 SECONDARY 경고 화살표로 구성됩니다. PRIMARY 신호는 추세 방향의 변화를 나타내는 흰색과 검은색 방향성 화살표이며, SECONDARY 신호는 PRIMARY 화살표가 지시하는 방향을 확인하고 잠재적인 거래 진입점을 표시하는 파란색과 빨간색 화살표입니다. 참고: 추세 방향이 변경된 후 PRIMARY 경고 화살표가 단 하나만 표시될 경우, 다수의 SECONDARY 파란색/빨간색 화살표가 표시될 수 있음을 유의해야 합니다. SECONDARY 신호는 신호 기준을 충족하는 어떤 캔들 이후에도 표시
Gold Signal Pro
Mohamed Hassan
First 25 copies at $80, after that price becomes $149 (3 copies left) Gold Signal Pro is a powerful MT4 indicator designed to help traders spot strong price reactions in the market. It focuses on clear wick rejections , showing when price strongly rejects a level and often continues in the same direction. Gold Signal Pro is mainly built for scalping gold (XAUUSD) and works best on lower timeframes like M5 and M15 , where timing matters most. That said, it can also be used on any forex pair, a
TPSpro RFI Levels
Roman Podpora
4.86 (28)
러시아어 설명서  /  영어   설명서  /  MT5 버전 주요 기능: 판매자와 구매자의 활동 영역을 표시합니다! 이 지표는 매수 및 매도에 대한 모든 올바른 첫 번째 임펄스 레벨/존을 표시합니다. 진입점 검색이 시작되는 이러한 레벨/존이 활성화되면 레벨의 색상이 바뀌고 특정 색상으로 채워집니다. 상황을 더욱 직관적으로 파악할 수 있도록 화살표도 표시됩니다. LOGIC AI - 템플릿 활성화 시 진입점 검색을 위한 영역(원) 표시 시각적 명확성을 개선하기 위해 인공지능을 사용하여 진입점을 검색한 영역을 표시하는 기능이 추가되었습니다. 더 높은 시간대의 레벨/존 표시(MTF 모드) 더 높은 시간 간격을 사용하여 레벨/존을 표시하는 기능이 추가되었습니다. 또한, 이 지표는 자동 추세 감지 기능(   TPSproTREND PRO   )을 구현했습니다. 거래를 위한 별도의 전문적인 단계별 알고리즘 이 알고리즘은 추세 방향과 반대 방향으로의 당일 거래 모두에 적합하도록 설계되었습니다. 각
Trend indicator AI
Ramil Minniakhmetov
4.7 (79)
트렌드 인공 지능 지표는 실행 가능한 진입 점 및 반전 경고와 추세 식별을 결합하여 상인의 시장 분석을 향상시킬 훌륭한 도구입니다. 이 표시기는 사용자가 자신감과 정밀도로 외환 시장의 복잡성을 탐색 할 수 있도록 지원합니다 기본 신호 외에도 트렌드 인공 지능 지표는 풀백 또는 되돌림 중에 발생하는 2 차 진입 점을 식별하여 거래자가 기존 트렌드 내에서 가격 수정을 활용할 수 있도록합니다. 중요한 장점: ·작동 4 및 5 *명확한 구매 또는 판매 신호 *다시 칠하지 않습니다 *모든 자산에서 작동 나는 전보 사기에 개 또는 세트를 판매하지 않도록주의. 모든 설정은 블로그에 여기에 무료.  중요! 지침 및 보너스를 얻기 위해 구입 후 즉시 저에게 연락! 진짜 가동 감시는 뿐 아니라 나의 다른 제품 여기에서 찾아낼 수 있습니다: https://www.mql5.com/en/users/mechanic/seller&nbsp ; 설정 및 입력: 모든 자산에 대해 기본 설정을 권
Trend Lines PRO
Roman Podpora
5 (1)
트렌드 라인즈 프로       이 지표는 시장이 실제로 어떤 방향으로 전환되는지 파악하는 데 도움이 됩니다. 실제 추세 반전 지점과 주요 시장 참여자들이 다시 진입하는 지점을 보여줍니다. 보시다시피       BOS 라인       복잡한 설정이나 불필요한 노이즈 없이 더 높은 시간대의 추세 변화와 주요 레벨을 확인할 수 있습니다. 신호는 차트에 다시 그려지지 않고 캔들이 마감된 후에도 계속 표시됩니다. VERSION MT 5   -   RFI LEVELS PRO   표시기   와 결합할 때 최대 잠재력을 발휘합니다. 지표가 보여주는 내용: 실제 변화       추세(BOS 라인) 한 번 신호가 나타나면 그 신호는 계속 유효합니다! 이는 신호를 발생시킨 후 변경될 수 있는 리페인팅 방식의 지표와 중요한 차이점입니다. 리페인팅 방식의 지표는 잠재적으로 자금 손실로 이어질 수 있습니다. 이제 더욱 높은 확률과 정확도로 시장에 진입할 수 있습니다. 또한 화살표가 나타난 후 목표가(익절)
Currency Strength Wizard
Oleg Rodin
4.84 (55)
통화 강도 마법사는 성공적인 거래를 위한 올인원 솔루션을 제공하는 매우 강력한 지표입니다. 표시기는 여러 시간 프레임의 모든 통화 데이터를 사용하여 이 또는 해당 외환 쌍의 힘을 계산합니다. 이 데이터는 특정 통화의 힘을 확인하는 데 사용할 수 있는 사용하기 쉬운 통화 지수 및 통화 전력선의 형태로 표시됩니다. 필요한 것은 거래하려는 차트에 표시기를 부착하는 것뿐입니다. 표시기는 거래하는 통화의 실제 강세를 보여줍니다. 지표는 또한 추세와 거래할 때 유리하게 사용할 수 있는 구매 및 판매 거래량 압력의 극한값을 보여줍니다. 지표는 또한 피보나치에 기반한 가능한 대상을 보여줍니다. 표시기는 PUSH 알림을 포함한 모든 유형의 알림을 제공합니다. 구매 후 연락주세요. 나는 당신과 거래 팁을 공유하고 당신에게 무료로 훌륭한 보너스 지표를 줄 것입니다! 나는 당신에게 행복하고 유익한 거래를 기원합니다!
IQ Gold Gann Levels
INTRAQUOTES
5 (4)
Presenting one-of-a-kind Gann Indicator for XAUUSD IQ Gold Gann Levels is a non-repainting, precision tool designed exclusively for XAUUSD/Gold intraday trading. It uses W.D. Gann’s square root method to plot real-time support and resistance levels, helping traders spot high-probability entries with confidence and clarity. William Delbert Gann (W.D. Gann) was an exceptional market analyst whose trading technique was based on a complex blend of mathematics, geometry, astrology, and ancient calcul
Gold Scalper Super
Aleksandr Makarov
5 (2)
Gold Scalper Super is an easy-to-use trading system. The indicator can be used as a standalone scalping system on the M1 time frame, as well as part of your existing trading system. Bonus: when purchasing an indicator, Trend Arrow Super is provided free of charge, write to us after purchase. The indicator 100% does not repaint!!! If a signal appears, it does not disappear! Unlike indicators with redrawing, which lead to the loss of a deposit, because they can show a signal and then remove it.
Advanced Currency Strength28 Indicator
Bernhard Schweigert
4.91 (657)
현재 40% 할인 초보자 또는 전문가 트레이더를 위한 최고의 솔루션! 이 지표는 우리가 독점 기능과 새로운 공식을 통합했기 때문에 독특하고 고품질이며 저렴한 거래 도구입니다. 단 하나의 차트로 28 Forex 쌍의 통화 강도를 읽을 수 있습니다! 새로운 추세 또는 스캘핑 기회의 정확한 트리거 포인트를 정확히 찾아낼 수 있기 때문에 거래가 어떻게 개선될지 상상해 보십시오. 사용 설명서: 여기를 클릭  https://www.mql5.com/en/blogs/post/697384 그것이 첫 번째, 원본입니다! 쓸모없는 지망생 클론을 사지 마십시오. 더 스페셜  강력한 통화 모멘텀을 보여주는 하위 창의 화살표 GAP가 거래를 안내합니다! 기본 또는 호가 통화가 과매도/과매도 영역(외부 시장 피보나치 수준)에 있을 때 개별 차트의 기본 창에 경고 표시가 나타납니다. 통화 강도가 외부 범위에서 떨어질 때 풀백/반전 경고. 교차 패턴의 특별 경고 추세를 빠르게 볼 수 있는 다중 시간
Smc Blast Signal
Mohit Dhariwal
5 (3)
Full Fledged EA and Alert plus for alerts will also be provided in this offer along with the purchase of Indicator. Limited copies only at this price and Ea too. Grab your copy soon Alert plus for indicator with set file is kept in comment section with the image  SMC Blast Signal with FVG, BOS and trend Breakout The SMC Blast Signal is a Precise trading system for Meta Trader 4 that uses Smart Money Concepts (SMC), including Fair Value Gaps (FVG) and Break of Structure (BOS), to identify high-pr
Pulse Scalping Line - an indicator for identifying potential pivot points. Based on this indicator, you can build an effective Martingale system. According to our statistics, the indicator gives a maximum of 4 erroneous pivot points in a series. On average, these are 2 pivot points. That is, the indicator shows a reversal, it is erroneous. This means that the second signal of the indicator will be highly accurate. Based on this information, you can build a trading system based on the Martingale
Pip Storm Signal
Camila Bernardez Camero
PIP STORM 신호 PIP STORM 은 변동성이 큰 시장 상황에서 초고빈도 실행을 위해 설계된 화살표 기반의 고급 시스템입니다. 이 시스템의 핵심 목표는 지연되거나 과도하게 사용된 인디케이터에 의존하지 않고, 실행 가능한 스캘핑 신호를 지속적으로 제공하는 것입니다. 예측하지 않고, 가격 전환 구간에 정밀하게 반응하며, 최소한의 실시간 확인 로직을 통해 마이크로 브레이크아웃과 유동성 불균형을 포착합니다. 업데이트 받기 향후 릴리스 및 공지사항을 확인하려면 공식 채널에 가입하세요: https://www.mql5.com/en/channels/signalsandindicators 스캘핑 빈도 이 도구는 조용히 사용하기 위한 것이 아닙니다. PIP STORM 은 활성 시장에서 거의 모든 캔들에 대해 공격적이고 지속적으로 신호를 생성하며, 현재의 방향을 확인하거나 중요한 되돌림을 정밀하게 감지합니다. 신호 해석 시각적으로는 단순하지만, 작동 면에서는 매우 강력합니다: 빨
Volatility Trend System - a trading system that gives signals for entries. The volatility system gives linear and point signals in the direction of the trend, as well as signals to exit it, without redrawing and delays. The trend indicator monitors the direction of the medium-term trend, shows the direction and its change. The signal indicator is based on changes in volatility and shows market entries. The indicator is equipped with several types of alerts. Can be applied to various trading ins
Basic Harmonic Patterns Dashboard
Mehran Sepah Mansoor
5 (3)
이 대시보드는 선택한 심볼에 대해 사용 가능한 최신 고조파 패턴을 표시하므로 시간을 절약하고 더 효율적으로 사용할 수 있습니다 / MT5 버전 . 무료 인디케이터: Basic Harmonic Pattern 인디케이터 열 Symbol : 선택한 심볼이 나타납니다 Trend : 강세 또는 약세 Pattern : 패턴 유형(가틀리, 나비, 박쥐, 게, 상어, 사이퍼 또는 ABCD) Entry : 진입 가격 SL: 스톱로스 가격 TP1: 1차 테이크프로핏 가격 TP2: 2차 테이크프로핏 가격 TP3: 3차 테이크프로핏 가격 Current price: 현재 가격 Age (in bars): 마지막으로 그려진 패턴의 나이 주요 입력 Symbols : "28개 주요 통화쌍" 또는 "선택한 심볼" 중에서 선택합니다. Selected Symbols : 쉼표로 구분하여 모니터링하려는 원하는 심볼("EURUSD,GBPUSD,XAUUSD")을 선택합니다. 브로커에 쌍에 접미사 또는 접두사가 있는
- Real price is 200$ - 50% Discount (It is 99$ now) -   It is enabled for 3 purchases. Contact me for extra bonus (Gann Trend   indicator), instruction or any questions! - Non-repaint, No lag - I just sell my products in Elif Kaya Profile, any other websites are stolen old versions, So no any new updates or support. - Lifetime update free Gann Gold EA MT5 Introduction W.D. Gann’s theories in technical analysis have fascinated traders for decades. It offers a unique approach beyond traditional c
FX Power MT4 NG
Daniel Stein
4.95 (21)
FX Power: 통화 강세 분석으로 더 스마트한 거래 결정을 개요 FX Power 는 어떤 시장 상황에서도 주요 통화와 금의 실제 강세를 이해하기 위한 필수 도구입니다. 강한 통화를 매수하고 약한 통화를 매도함으로써 FX Power 는 거래 결정을 단순화하고 높은 확률의 기회를 발견합니다. 트렌드를 따르거나 극단적인 델타 값을 사용해 반전을 예측하고자 한다면, 이 도구는 귀하의 거래 스타일에 완벽히 적응합니다. 단순히 거래하지 말고, FX Power 로 더 스마트하게 거래하세요. 1. FX Power가 거래자에게 매우 유용한 이유 통화와 금의 실시간 강세 분석 • FX Power 는 주요 통화와 금의 상대적 강세를 계산하고 표시하여 시장 역학에 대한 명확한 통찰력을 제공합니다. • 어떤 자산이 앞서고 있고 어떤 자산이 뒤처지는지 모니터링하여 보다 현명한 거래 결정을 내릴 수 있습니다. 포괄적인 멀티 타임프레임 뷰 • 단기, 중기 및 장기 타임프레임에서 통화와 금의 강세를
Atomic Analyst
Issam Kassas
5 (3)
우선적으로 언급할 점은이 거래 지표가 다시 그리지 않고 지연되지 않으며 이를 통해 수동 및 로봇 거래 모두에 이상적이라는 점입니다. 사용자 매뉴얼: 설정, 입력 및 전략. Atomic Analyst는 가격의 강도와 모멘텀을 활용하여 시장에서 더 나은 이점을 찾는 PA Price Action Indicator입니다. 고급 필터를 장착하여 잡음과 거짓 신호를 제거하고 거래 잠재력을 높이는 데 도움이 됩니다. 복잡한 지표의 다중 레이어를 사용하여 Atomic Analyst는 차트를 스캔하고 복잡한 수학적 계산을 간단한 신호와 색상으로 변환하여 초보 트레이더가 이해하고 일관된 거래 결정을 내릴 수 있도록합니다. "Atomic Analyst"는 새로운 및 경험이 풍부한 트레이더를위한 종합적인 거래 솔루션입니다. 프리미엄 지표와 최고 수준의 기능을 하나의 거래 전략에 결합하여 모든 종류의 트레이더에 대한 다재다능한 선택지가되었습니다. 인트라데이 거래 및 스캘핑 전략 : 빠르고 정확한 일일
Apollo SR Master
Oleg Rodin
5 (1)
Apollo SR Master는 지지/저항 구간에서의 거래를 더욱 쉽고 안정적으로 만들어 주는 특수 기능을 갖춘 지지/저항 지표입니다. 이 지표는 지역 가격의 고점과 저점을 감지하여 시간 지연 없이 실시간으로 지지/저항 구간을 계산합니다. 새롭게 형성된 저항 구간을 확인하기 위해 지표는 해당 저항 구간을 실제 매도 또는 매수 신호로 활용할 수 있음을 나타내는 특수 신호를 표시합니다. 이 경우, 저항 구간의 강도가 높아지고, 따라서 저항 구간에서의 성공적인 거래 가능성도 높아집니다. 이것이 바로 이 지표의 핵심 아이디어입니다. SR 존은 손절매와 이익실현을 더욱 쉽게 할 수 있도록 해줍니다. 신호 방향에 따라 SR 존 위 또는 아래 공간을 손절매로 활용할 수 있습니다. 또한, 반대쪽 SR 존은 잠재적 이익실현 영역으로 활용할 수 있습니다. 또한 Apollo SR Master 지표를 사용하는 모든 사용자에게 "Apollo Price Action System" 지표를 무료로 제공합니다.
현재 40% 할인 ! 초보자 또는 전문가 트레이더를 위한 최고의 솔루션! 이 대시보드 소프트웨어는 28개의 통화 쌍에서 작동합니다. 2가지 주요 지표(Advanced Currency Strength 28 및 Advanced Currency Impulse)를 기반으로 합니다. 전체 Forex 시장에 대한 훌륭한 개요를 제공합니다. 고급 통화 강도 값, 통화 이동 속도 및 모든(9) 시간대의 28 Forex 쌍에 대한 신호를 보여줍니다. 추세 및/또는 스캘핑 기회를 정확히 파악하기 위해 차트의 단일 지표를 사용하여 전체 시장을 볼 수 있을 때 거래가 어떻게 개선될지 상상해 보십시오! 잠재적인 거래를 식별하고 확인하면서 강력한 통화와 약한 통화를 더욱 쉽게 식별할 수 있도록 이 지표에 기능을 내장했습니다. 이 표시기는 통화의 강세 또는 약세가 증가 또는 감소하는지 여부와 모든 시간대에서 수행되는 방식을 그래픽으로 보여줍니다. 추가된 새로운 기능은 현재 시장 조건 변화에 적응하는
Scalper Inside PRO
Alexey Minkov
4.74 (69)
* VALENTINE’S DAY 20% SALE * LIMITED TIME OFFER * An exclusive indicator that utilizes an innovative algorithm to swiftly and accurately determine the market trend. The indicator automatically calculates opening, closing, and profit levels, providing detailed trading statistics. With these features, you can choose the most appropriate trading instrument for the current market conditions. Additionally, you can easily integrate your own arrow indicators into Scalper Inside Pro to quickly evaluate
Advanced Arrow
Alfred Kamal
3.9 (39)
This indicator depends on some secrets equations to draw Signals with Stop loss and maximum 4 Take profits. There is a free EA depends on this indicator as a gift when you purchase/rent it. Features Simply it gives you entry point as Ready sign (Buy / Sell) and arrow (Buy / Sell) after candle closed, also SL line and 4 TP lines or less. Once SL-TP lines are shown with the arrow, they remains as they are until signal change. It is historical indicator. No Repaint. user manual for V5 please click
제작자의 제품 더 보기
Ichimoku Advanced Pro MTF
Hoang Ngoc Thach
4.67 (3)
Ichimoku Kinko Hyo is a purpose-built trend trading charting system that has been successfully used in nearly every tradable market. It is unique in many ways, but its primary strength is its use of multiple data points to give the trader a deeper, more comprehensive view into price action. This deeper view, and the fact that Ichimoku is a very visual system, enables the trader to quickly discern and filter "at a glance" the low-probability trading setups from those of higher probability. This i
FREE
Gann Fan Zigzag
Hoang Ngoc Thach
A form of technical analysis based on the ideas that the market is geometric and cyclical in nature. A Gann Fan consists of a series of diagonal lines called Gann angles, of which there are nine. These angles are superimposed over a price chart to show a security's support and resistance levels. The resulting image is supposed to help technical analysts predict price changes. Although once drawn by hand, today Gann Fans can be drawn with software programs. This indicator draws Gann Fan based on
Advanced MA Signal
Hoang Ngoc Thach
This indicator was built based on Moving Average, but it always reset counter at the first bar of day/week/month. Simple arrow signal to show buy/sell signal. 3 lines of moving average can be used as price channel, this is market trend also. time_zone option allows choosing time for trading and session movement analysis.
Manual Panel
Hoang Ngoc Thach
5 (2)
I like trading manually, so I created this tool to make my trade more easier and faster. Features Money management. Click for place order ( Buy/Sell/BuyStop/BuyLimit/SellStop/SellLimit). Many buttons for control your account (Close All, Remove Pendings, Breakeven, Hedging). Auto hide if not use for 2 minutes. See profit on current symbol. Free to move panel to where you want. Save your settings for using on next time. Special: It's work on backtest mode! You can use this for training yourself.
Extrem Fast Channel
Hoang Ngoc Thach
This indicator helps to find high/low points. This is not perfect trend indicator, because sometime it shows anti-market trend. But it never misses highest and lowest price in history. So that, the rules for entry are: Sell with downtrend (red line), Buy with uptrend (blue line). Yellow arrows for Sell, but it should be confirmed by downtrend. Aqua arrows for Buy, but it should be confirmed by uptrend.
NoFear
Hoang Ngoc Thach
NoFear indicator is based on Advanced Moving Average. It is used in technical chart analysis providing signals whenever a rate change appears that exceeds the upper or lower border. The indicator works very well on trend market. It is easy to find good entry points by blue/violet arrows. The upper and lower bands should be used like support/resistance levels and stop/exit points. All signals do not repaint, and can be used immediately when they are coming. This means we do not need to wait for a
SuperTrend 2015
Hoang Ngoc Thach
The idea for indicator is using multi-SuperTrend line to define market trend and Multi Moving Average line to find good entry point. The signal doesn't repaint, wait until the bar closed to make sure the signal is confirmed. Lowest RoyalBlue line is used for Buy stoploss. Highest Magenta line is used for Sell stoploss. Indicator supports alert when signal is coming (sends email, push notifications, sound alert). High Timeframe is better for using. Indicator parameters: CountBars = 500 — How man
CCI Exit
Hoang Ngoc Thach
5 (1)
This is a great indicator to find an exit point. We never know when the market is going to change its trend. Many indicators give you a good entry point, but not good to use opposite signal as an exit point, because the signal always comes too late. This indicator will protect your profit as soon as possible when a signal to exit is found! Don't use this signal to enter, it may not be good for making an entry. The signal doesn't repaint, wait until a bar closes to make sure it is confirmed. Indi
Trend Trade 2015
Hoang Ngoc Thach
Trend Trade indicator is based on ADX indicator to define long/medium/short trend and good entry signals. The product supports virtual trade on chart to show where/when should we make an entry/exit. It works very well on D1 or above. The indicator is efficient on GOLD and CFDs. Alert_Settings = "+++++++++++++++++++++++" SendMailMode = true - Send email SendNotificationMode = true - Send notification to your phone AlertMode = true - Sound alert Show_Virtual_Trades = true - Show virtual trades Sin
Trend Prediction
Hoang Ngoc Thach
5 (3)
i-Regression Channel generates regression channel: Linear regression channel consists of two parallel lines located at the equal distance from the linear regression trend line. The distance between the channel borders and the regression line is equal to the value of the highest close price deviation from the regression line. degree - degree of regression, changes from 1 to 61; kstd - regression channel width; bars - the number of bars for the channel calculation; shift - the channel horizontal s
YourBigPlan
Hoang Ngoc Thach
The indicator is based on Moving Average to define the trend, then it finds a good entry point and follows the trend. We will keep open on a new signal until the trend is changed, and all trades exit on an opposite signal. The exit point is a bit late relative to the highest profitable point (at top/bottom), but it is the best point to exit your trades. Keep the trades, which are moving the right direction to get a high profit, and stop wrong trades as soon as possible when the trend is changed
Using high-volatility channel breakout-style trading systems has historically worked well across major currency pairs, show promise in determining the opportune time to trade the channel breakout trading strategy. This Breakout Strategy may look simple, but it is good follow trade trader strategy. Setting: Channel Periods: default 20 BarsCount: bars count in history Alert_Settings = "+++++++++++++++++++++++" SendMailMode = true - Send email SendNotificationMode = true - Send notification to you
Reversal Breakout
Hoang Ngoc Thach
Reversal Breakout is a real breakout strategy. It is based on Moving Average indicator to define market trend and breakout points. Try to entry when price reverse is not good, because there are many false reversal signal, so that it is better to trade breakout at reverse point. This EA will work for all Timeframe, but I prefer to use it on H1 or above. Should use it on major pairs which are lowest Spread, and lowest Slippage: EURUSD,GBPUSD,USDJPY,GOLD,... No martingale No Grid Always use Stoplos
The indicator uses 2 Moving Average: 1 fast EMA and 1 slow EMA to define trend, reversal signal and breakout point. Reversal Signal comes on open time, it can be used as scalping signal for short time, but be careful with this signal because it may be an anti-trend signal, the indicator tries to catch reverse point. Breakout signal is where support or resistance was broken out, the reversal signal has failed. Breakout signal is stronger than the Reversal Signal. We can use support/resistance lev
ATeam Sonic Hope
Hoang Ngoc Thach
ATeam Sonic Hope ATeam Sonic Hope is a fully automated Expert Advisor with no use of martingale, sometime EA open more trade with new signal and exit all trade with overall profit. Some ocillators indicator were used to generate signal and use Higher Timeframe as maintrend to entry. Real operation monitoring as well as my other products can be found here: https://www.mql5.com/en/users/rockyhoangdn/seller General Recommendations The minimum deposit is 100 USD,  Recomend low spread pair like : EU
ATeam Divergence
Hoang Ngoc Thach
The CCI Divergence is a reasonably useful indicator in itself, but it is even more effective when used with divergence pattern trading. The CCI Divergence indicator signal is one of the most potent signals among the indicators that exist in the market. Here is new version for Divergence Indicator using CCI method, with more improvements. Divergences indicate a potential investment point because the directional moment does not confirm the price. A bullish divergence occurs when the underlying va
ATeam Impulse
Hoang Ngoc Thach
The Elder Impulse System was designed by Alexander Elder and featured in his book. According to Elder, “the system identifies inflection points where a trend speeds up or slows down”. The Impulse System is based on two indicators, a  exponential moving average and the MACD-Histogram. The moving average identifies the trend, while the MACD-Histogram measures momentum. As a result, the Impulse System combines trend following and momentum to identify tradable impulses. This unique indicator combina
ATeam Panel
Hoang Ngoc Thach
This is best control panel for trader who trade with Supply and Demand Zone. Easy to calculate entry lotsize by %risk/money risk/money target/fixed lot And support Half-Kelly feature: calculate the best Risk percentage for each trade follow Kelly criterion . Auto Change chart feature Exposure and Position manager Currencies Strength Meter And more features waiting you
New Volume Profile
Hoang Ngoc Thach
4 (1)
Volume Profile is an advanced charting study that displays trading activity over a specified time period at specified price levels. The study (accounting for user defined parameters such as number of rows and time period) plots a histogram on the chart meant to reveal dominant and/or significant price levels based on volume. Essentially, Volume Profile takes the total volume traded at a specific price level during the specified time period and divides the total volume into either buy volume or s
If you have been anywhere near Forex forums or social media lately, you have no doubt been hearing people talk about   Smart Money Concepts (SMC)   trading. You may be wondering what SMC is, and whether it deserves all the hype. In this post, we will introduce Smart Money Concepts trading to you so you can make an informed decision about whether or not to give this strategy a try in your own trading. What is SMC Forex trading? Smart Money Concepts (SMC) is one of many forex trading methods. SMC
Ichimoku Kinko Hyo is a purpose-built trend trading charting system that has been successfully used in nearly every tradable market. It is unique in many ways, but its primary strength is its use of multiple data points to give the trader a deeper, more comprehensive view into price action. This deeper view, and the fact that Ichimoku is a very visual system, enables the trader to quickly discern and filter "at a glance" the low-probability trading setups from those of higher probability. This i
We try to detect long/medium/short-term trends and combine all of them with some price action patterns to find a good entry point. The Indicator benefits are: Can detect long/medium/short-term trends. Can detect resistances/supports level (like pivot levels). Shows entry point/time using colored arrows Multitimeframe mode is available.
This indicator is the same as the popular Heiken Ashi Smoothed. The Heikin Ashi indicator for MetaTrader 5 already exists, but it has two disadvantages: It paints the candles not accurate. It's not possible to change the candle width. See also Heikin Ashi in MQL5 Code Base . In this version there are no such disadvantages.
Any financial instrument that is traded on the market is a position of some active towards some currency. Forex differs from other markets only in the fact, that another currency is used as an active. As a result in the Forex market we always deal with the correlation of two currencies, called currency pairs. The project that started more than a year ago, helped to develop a group of indicators under a joint name cluster indicators. Their task was to divide currency pairs into separate currencie
This indicator is a copy of the Gann Hi-Lo Activator SSL indicator which was rewritten in MQL5. The original indicator was one-colored, that is why for more visual definition of the trend direction it was necessary to make it colored. This version is Mutitimefame, now you can see multi-trends in a separate window and signals in the main chart. Alert mode and sending of emails has been also added.
Ichimoku MTF
Hoang Ngoc Thach
MTF Ichimoku is a MetaTrader 5 indicator based on well known Ichimoku. In MetaTrader 5 we have Ichimoku already included as a standard technical indicator. However it can be used only for the current timeframe. When we are looking for a trend, it is very desirable to have Ichimokuis showing higher timeframes. MTF Ichimoku presented here has additional parameter - TimeFrame. You can use it to set up higher timeframe from which Ichimokuis will calculate its values. Other basic parameters are not c
Ichimoku Kinko Hyo is a purpose-built trend trading charting system that has been successfully used in nearly every tradable market. It is unique in many ways, but its primary strength is its use of multiple data points to give the trader a deeper, more comprehensive view into price action. This deeper view, and the fact that Ichimoku is a very visual system, enables the trader to quickly discern and filter "at a glance" the low-probability trading setups from those of higher probability. This i
The Forex trading market operates 24 hours a day but the best trading times are when the major trading sessions are in play. The Sessions Moving Average indicator helps identify Tokyo, London and New York, so you know when one session starts, ends or even overlaps. This indicator also shows how session affects the price movement. Now, you can see the market trend by comparing the price with 3 Average lines or comparing 3 Average lines together.
CCI Trend
Hoang Ngoc Thach
The commodity channel index (CCI) is an oscillator originally introduced by Donald Lambert in an article published in the October 1980 issue of Commodities magazine (now known as Futures magazine). Since its introduction, the indicator has grown in popularity and is now a very common tool for traders in identifying cyclical trends not only in commodities, but also equities and currencies. The CCI can be adjusted to the timeframe of the market traded on by changing the averaging period. This indi
This is HTF (or MTF) of original Kolier SuperTrend indicator. On this version, you can use 4 Lines of supertrend to define the trend, it will be more powerful. Remade signals on smalls timeframes, the indicator will not repaint if used on small timeframes.
필터:
리뷰 없음
리뷰 답변