SuperTrend 2015

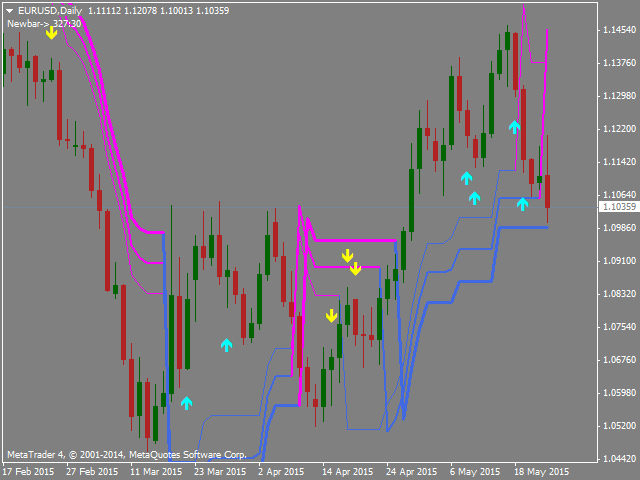
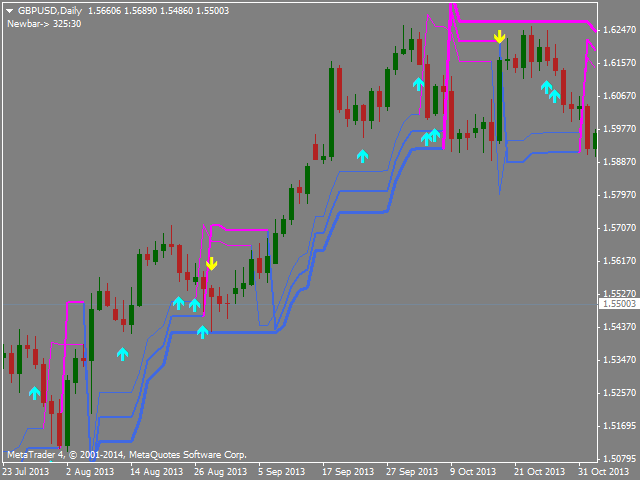
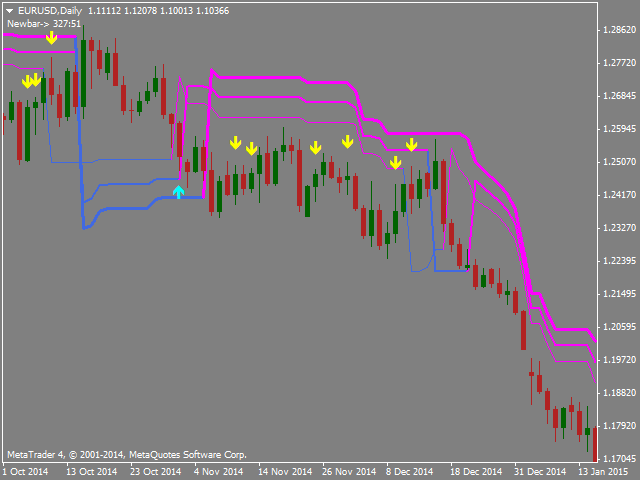
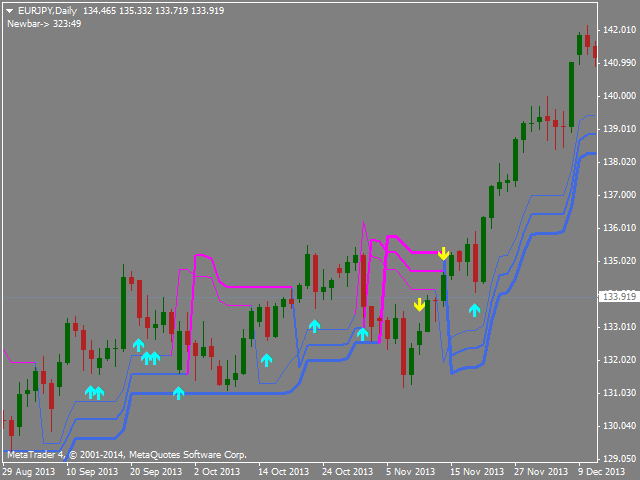
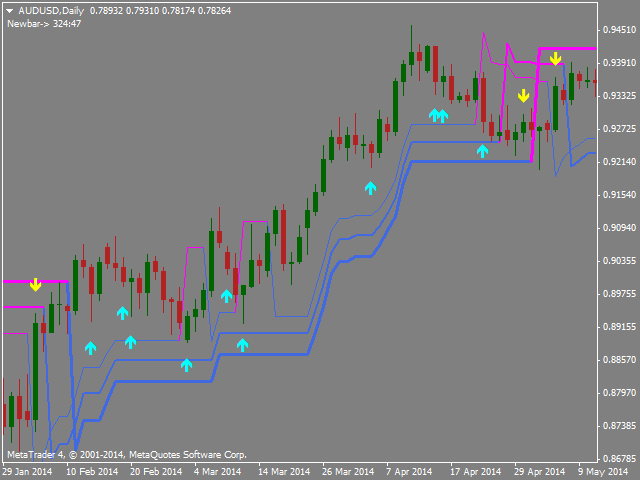
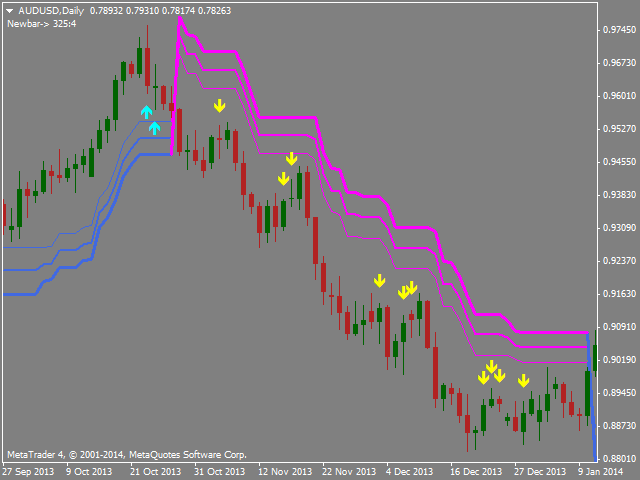
The idea for indicator is using multi-SuperTrend line to define market trend and Multi Moving Average line to find good entry point.

The signal doesn't repaint, wait until the bar closed to make sure the signal is confirmed.

Lowest RoyalBlue line is used for Buy stoploss.

Highest Magenta line is used for Sell stoploss.

Indicator supports alert when signal is coming (sends email, push notifications, sound alert).

High Timeframe is better for using.


Indicator parameters:

  • CountBars = 500 — How many bars will be shown on the chart
  • Trend_Setting = "+++++++++++++++++++++++++++++";
    • Show_Trend = true — Show Supertrend Trend Line
    • Trend_Periods = 10 — Select Period for the trend
    • Trend_Multiplier = 2.0 — Trend_Multiplier to define when the trend will change direction
    • Line_Numbers = 3 — Select how many lines
    • Multiplier_Add = 0.5 — The distance between lines
  • Signal_Setting = "+++++++++++++++++++++++++++++";
    • Signal Periods = 3 — Signal Periods
    • Arrow_width = 1 — Signal Arrow width
    • Arrow_color_Up = clrAqua — color of Up Arrows
    • Arrow_color_Dn = clrYellow — color of Down Arrows
  • Alert_Settings = "+++++++++++++++++++++++";
    • BarClosed_Alert = false:
      • Set true: send alert on Close;
      • If false: use Alert_Minute_Before_Close to define when  an alert will be sent
    • Alert_Minute_Before_Close = 5 — Alert_Minute_Before_Close = 5; Send alert 5 minutes before the bar closing.
    • SendMailMode = true — Send to email
    • SendNotificationMode = true — Push notification to your phone
    • AlertMode = true — Open Alert pop up
추천 제품
Super Reversal Pattern
Parfait Mujinga Ndalika
Super Reversal Pattern Indicator Unlock the power of advanced pattern recognition with our Super Reversal Pattern Indicator. Designed for traders seeking precision and reliability, this indicator identifies one of the most effective reversal patterns in technical analysis, offering a significant edge in your trading strategy. Key Features: Non-Repainting Accuracy: Enjoy the confidence of non-repainting technology. Once a Super Reversal Pattern is detected, it remains static, providing consiste
Quantum Heiken Ashi PRO MT4
Bogdan Ion Puscasu
4.33 (6)
소개       Quantum Heiken Ashi PRO   차트 시장 동향에 대한 명확한 통찰력을 제공하도록 설계된 Heiken Ashi 양초는 노이즈를 필터링하고 잘못된 신호를 제거하는 기능으로 유명합니다. 혼란스러운 가격 변동에 작별을 고하고 더 매끄럽고 신뢰할 수 있는 차트 표현을 만나보세요. Quantum Heiken Ashi PRO를 정말 독특하게 만드는 것은 전통적인 촛대 데이터를 읽기 쉬운 색상 막대로 변환하는 혁신적인 공식입니다. 빨간색과 녹색 막대는 각각 약세와 강세 추세를 우아하게 강조하여 잠재적 진입점과 퇴장점을 매우 정확하게 파악할 수 있습니다. Quantum EA 채널:       여기를 클릭하세요 MT5 버전:       여기를 클릭하세요 이 놀라운 지표는 다음과 같은 몇 가지 주요 이점을 제공합니다. 선명도 향상: Heiken Ashi 바는 가격 변동을 완화하여 시장 추세를 보다 명확하게 나타내므로 유리한 거래 기회를 쉽게 식별할 수 있습니다.
Stepping Trend
Mpendulo Chiliza
The Stepping Trend Indicator     The Steppi ng Trend indicator uses the  average true range  (ATR indicator) in its calculation. This gives you control to set your own average true range period, I set the Default as 10.   Indicator Details. Green Arrow Up: This means you are at the starting point of a new bullish trend, it’s time to buy.   Red  Arrow  Down : This means you are at the starting point of a new  bearish  trend, it’ s time to sell .   What if you miss the Arrow Signal?   No prob
Noize Absorption Index MT4
Ekaterina Saltykova
5 (1)
Noize Absorption Index - is the manual trading system that measures the difference of pressure between bears forces and bulls forces. Green line - is a noize free index that showing curent situation. Zero value of index shows totally choppy/flat market.Values above zero level shows how powerfull bullish wave is and values below zero measures bearish forces.Up arrow appears on bearish market when it's ready to reverse, dn arrow appears on weak bullish market, as a result of reverse expectation. S
Forex Gump
Andrey Kozak
2.4 (5)
Forex Gump is a fully finished semi-automatic trading system. In the form of arrows, signals are displayed on the screen for opening and closing deals. All you need is to follow the instructions of the indicator. When the indicator shows a blue arrow, you need to open a buy order. When the indicator shows a red arrow, you need to open a sell order. Close orders when the indicator draws a yellow cross. In order to get the most effective result, we recommend using the timeframes H1, H4, D1. There
Owl smart levels
Sergey Ermolov
4.24 (37)
MT5 버전  |   FAQ Owl Smart Levels Indicator 는   Bill Williams 의 고급 프랙탈, 시장의 올바른 파동 구조를 구축하는 Valable ZigZag, 정확한 진입 수준을 표시하는 피보나치 수준과 같은 인기 있는 시장 분석 도구를 포함하는 하나의 지표 내에서 완전한 거래 시스템입니다. 시장과 이익을 취하는 장소로. 전략에 대한 자세한 설명 표시기 작업에 대한 지침 고문-거래 올빼미 도우미의 조수 개인 사용자 채팅 ->구입 후 나에게 쓰기,나는 개인 채팅에 당신을 추가하고 거기에 모든 보너스를 다운로드 할 수 있습니다 힘은 단순함에 있습니다! Owl Smart Levels   거래 시스템은 사용하기 매우 쉽기 때문에 전문가와 이제 막 시장을 연구하고 스스로 거래 전략을 선택하기 시작한 사람들 모두에게 적합합니다. 전략 및 지표에는 눈에 보이지 않는 비밀 공식 및 계산 방법이 없으며 모든 전략 지표는 공개되어 있습니다. Owl Smart Leve
The indicator displays the data of the Stochastic oscillator from a higher timeframe on the chart. The main and signal lines are displayed in a separate window. The stepped response is not smoothed. The indicator is useful for practicing "manual" forex trading strategies, which use the data from several screens with different timeframes of a single symbol. The indicator uses the settings that are identical to the standard ones, and a drop-down list for selecting the timeframe. Indicator Paramet
Power Renko MT4
Pierce Vallieres
Power Renko is an indicator which plots Renko bricks underneath the chart using a histogram. You can select the brick size and the timeframe of the Renko bricks as well as whether or not to use the close price or the high/low price of the candles. Renko bricks are based on price alone, not time, therefor the Renko bricks will not be aligned with the chart's time. They are extremely useful for trend trading and many different strategies can be formed from them. Buffers are provided allowing you t
ZhiBiCCI MT4
Qiuyang Zheng
[ZhiBiCCI] indicators are suitable for all cycle use, and are also suitable for all market varieties. [ZhiBiCCI] Green solid line is a reversal of bullish divergence. The green dotted line is a classic bullish divergence. [ZhiBiCCI] The solid line to the red is a reverse bearish divergence. The red dotted line is a classical bearish divergence. [ZhiBiCCI] can be set in the parameters (Alert, Send mail, Send notification), set to (true) to send instant signals to the alarm window, email, insta
Auto Fibo Pro m
DMITRII GRIDASOV
"Auto FIBO Pro" Crypto_Forex 지표 - 거래에 유용한 보조 도구입니다! - 지표는 자동으로 Fibo 수준과 로컬 추세선(빨간색)을 계산하여 차트에 배치합니다. - Fibonacci 수준은 가격이 반전될 수 있는 주요 영역을 나타냅니다. - 가장 중요한 수준은 23.6%, 38.2%, 50%, 61.8%입니다. - 역전 스캘핑이나 존 그리드 거래에 사용할 수 있습니다. - Auto FIBO Pro 지표를 사용하여 현재 시스템을 개선할 수 있는 기회도 많습니다. - Info Spread Swap Display가 있습니다. 현재 Spread와 Swap이 부착된 외환 쌍을 표시합니다. - 디스플레이에는 계정 잔액, 자본 및 마진도 표시됩니다. - 차트의 어느 모서리에서나 Info Spread Swap Display를 찾을 수 있습니다. 0 - 왼쪽 상단 모서리, 1 - 오른쪽 상단, 2 - 왼쪽 하단, 3 - 오른쪽 하단. 여기를 클릭하여 고품질 트레이딩 로봇과
Smart Price Action Concepts
Issam Kassas
4.75 (12)
우선적으로, 이 거래 도구는 전문적인 거래에 이상적인 비-다시 그리기 및 지연되지 않는 지표입니다.  온라인 강좌, 사용자 매뉴얼 및 데모. 스마트 가격 액션 컨셉트 인디케이터는 신규 및 경험 많은 트레이더 모두에게 매우 강력한 도구입니다. Inner Circle Trader Analysis 및 Smart Money Concepts Trading Strategies와 같은 고급 거래 아이디어를 결합하여 20가지 이상의 유용한 지표를 하나로 결합합니다. 이 인디케이터는 스마트 머니 컨셉트에 중점을 두어 대형 기관의 거래 방식을 제공하고 이동을 예측하는 데 도움을 줍니다.  특히 유동성 분석에 뛰어나 기관이 어떻게 거래하는지 이해하는 데 도움을 줍니다. 시장 트렌드를 예측하고 가격 변동을 신중하게 분석하는 데 탁월합니다. 귀하의 거래를 기관 전략에 맞추어 시장의 동향에 대해 더 정확한 예측을 할 수 있습니다. 이 인디케이터는 시장 구조를 분석하고 중요한 주문 블록을 식별하고 다양한
Infinity Trend Pro
Yaroslav Varankin
1 (1)
This is a trend indicator without redrawing Developed instead of the binary options strategy (by the color of the Martingale candlestick) Also works well in forex trading When to open trades (binary options) A signal will appear in the place with a candle signaling the current candle It is recommended to open a deal for one candle of the current timeframe M1 and M5 When a blue dot appears, open a deal up When a red dot appears, open a trade down. How to open trades on Forex. When a signal is rec
RSI Speed mp
DMITRII GRIDASOV
MT4용 Crypto_Forex 지표 "RSI SPEED" - 훌륭한 예측 도구, 재도색 불필요 - 이 지표는 물리학 방정식을 기반으로 계산됩니다. RSI SPEED는 RSI 자체의 1차 미분값입니다. - RSI SPEED는 주요 추세 방향으로 스캘핑 진입에 유용합니다. - HTF MA(그림 참조)와 같은 적절한 추세 지표와 함께 사용하세요. - RSI SPEED 지표는 RSI 자체의 방향이 얼마나 빨리 변하는지를 보여주며, 매우 민감합니다. - 모멘텀 거래 전략에는 RSI SPEED 지표 사용을 권장합니다. RSI SPEED 지표 값이 0보다 작으면 가격 모멘텀이 하락하고, 0보다 크면 가격 모멘텀이 상승합니다. - 모바일 및 PC 알림 기능이 내장되어 있습니다. 여기를 클릭하여 고품질 트레이딩 로봇과 지표를 확인하세요! 본 제품은 MQL5 웹사이트에서만 제공되는 정품입니다.
Trendiness Index
Libertas LLC
5 (3)
"The trend is your friend" is one of the best known sayings in investing, because capturing large trendy price movements can be extremely profitable. However, trading with the trend is often easier said than done, because many indicators are based on price reversals not trends. These aren't very effective at identifying trendy periods, or predicting whether trends will continue. We developed the Trendiness Index to help address this problem by indicating the strength and direction of price trend
SMC Venom Model BPR 지표는 Smart Money(SMC) 개념 내에서 일하는 트레이더를 위한 전문 도구입니다. 가격 차트에서 두 가지 주요 패턴을 자동으로 식별합니다. FVG (공정 가치 갭)는 3개의 캔들의 조합으로, 첫 번째와 세 번째 캔들 사이에 갭이 있습니다. 이는 볼륨 지원이 없는 레벨 사이에 구역을 형성하여 종종 가격 수정으로 이어집니다. BPR (균형 가격 범위)은 두 개의 FVG 패턴의 조합으로, "브리지"를 형성합니다. 이는 가격이 낮은 볼륨 활동으로 움직일 때 브레이크아웃과 레벨로의 복귀 구역으로, 캔들 사이에 갭을 생성합니다. 이러한 패턴은 거래자가 차트에서 거래량과 가격 역학을 분석하여 주요 지지/저항 수준, 돌파 구역 및 진입 지점을 식별하는 데 도움이 되며, 여기서 대형 시장 참여자와 일반 참여자 간의 상호 작용이 발생합니다. 이 지표는 사각형과 화살표 형태로 패턴을 시각화하며 유연한 경고 설정도 지원합니다. 주요 특징: 패턴 표시 모드:
This is an arrow indicator without a future function,developed based on the most advanced profit trading algorithms.It has the most innovative and advanced dual trend analysis module, as well as the latest and highly effective market trend prediction algorithm.Trends are your friends, and following larger trends can earn the maximum profit in foreign exchange. This indicator helps traders identify current trends and track them. Someone once made a profit of 10 times in a week by relying on it.No
Trade with Gann on your side!! MASTER CIRCLE 360 CIRCLE CHART, originally created by Gann admitted that this is “The Mother of all charts”. It is one of the last studies that this great trader left for us. The numeric tab le is apparently quite simple like all the tables and is based on square numbers, the SQUARE OF 12 and is by evolution, one of the most important square numbers. Here we can find CYCLE, PRICE AND TIME thanks to angles and grades, to show past and future support and resistance.
"Impulses and Corrections 4" is created to help traders navigate the market situation. The indicator shows multi-time frame upward and downward "Impulses" of price movements. These impulses are the basis for determining the "Base" , which is composed of zones of "Corrections" of price movements, as well as "Potential" zones for possible scenarios of price movement. Up and down impulses are determined based on a modified formula of Bill Williams' "Fractals" indicator. The last impulse is always
Magical Arrow
Ranguni Abdulsamir Abdulmajid
Magical Arrow Indicator – Clear & Reliable Signals The Magical Arrow Indicator is a non-repainting, trend-following tool that gives you crystal-clear Buy and Sell signals . It  high-probability reversals and entries . No more guesswork – just follow the arrows on your chart! The Magical Arrow Indicator is a powerful, easy-to-use trading tool that helps you catch the most profitable Buy and Sell opportunities in the Forex market. It is designed for beginners and professional traders , giving y
Lyne
Maksim Kalachev
About the Lyne indicator Lyne is a Metatrader 4 (MT4) indicator, the essence of which is to transform the accumulated historical data. The Lyne indicator makes it possible to detect various features and patterns in price dynamics that are invisible to the naked eye. Based on this information, traders can anticipate further price movement and adjust their strategy accordingly. This indicator has proven itself in the scalping strategy. The indicator works without repainting.
Advanced Trend Regime
Shellard Securities (Pty) Ltd
The indicator has been designed to function on any time-frame and any pair.   This regime filter will help the trader better evaluate whether the current market is trending, and in which direction. It quickly reacts to changes in market dynamics using a series of advanced calculations. The user is able to select whether the calculation remains standard, or if a further filter constraint is added to the calculation.   A Yellow moving average of the signal has been included for the trader to smoot
The   Trendlines Oscillator   helps traders identify trends and momentum based on the normalized distances between the current price and the most recently detected bullish and bearish trend lines. The indicator features bullish and bearish momentum, a signal line with crossings, and multiple smoothing options. USAGE The   Trendlines Oscillator   works by systematically: Identifying pivot highs and lows. Connecting pivots to form bullish (support) and bearish (resistance) trendlines. Measuring
Gold Titan King Scalper
Dodong Christian Arnon
Indicator Description GOLD TITAN KING SIGNAL INDICATOR High-Precision Gold Scalping Buy/Sell Signals – Manual Trading Assistant Overview The Gold Titan King Signal Indicator is a manual trading assistant tool designed for high-frequency scalping on Gold (XAUUSD) and other major pairs. It generates clear BUY/SELL signals with precise entry levels, along with adjustable Stop Loss and Take Profit levels displayed directly on the chart. ️ This tool is NOT an EA. It does not execute trades
"다이나믹 스캘핑 오실레이터"는 MT4를 위한 고급 맞춤형 암호화폐/외환 지표이자 효율적인 트레이딩 도구입니다! - 차세대 오실레이터 - 사용 방법은 그림을 참조하세요. - 다이나믹 스캘핑 오실레이터는 적응형 과매도/과매수 영역을 제공합니다. - 오실레이터는 동적인 과매도/과매수 영역에서 정확한 진입 시점을 찾는 보조 도구입니다. - 과매도 값: 녹색선 아래, 과매수 값: 주황색선 위. - 이 지표는 가격 변동 패턴과도 결합하기 좋습니다. - 일반 오실레이터보다 훨씬 정확합니다. 적합한 시간대: M30, H1, H4, D1, W1. - PC 및 모바일 알림 기능 제공. .......................................................................... 여기를 클릭하여 고품질 트레이딩 로봇과 지표를 확인하세요! MQL5 웹사이트에서만 제공되는 오리지널 제품입니다.
캔들의 종가를 예측하는 지표입니다. 지표는 주로 D1 차트에서 사용하기 위한 것이. 이 지표는 전통적인 외환 거래와 바이너리 옵션 거래 모두에 적합합니다. 지표는 독립형 거래 시스템으로 사용하거나 기존 거래 시스템에 추가로 사용할 수 있습니다. 이 표시기는 현재 양초를 분석하여 양초 본체 내부의 특정 강도 요인과 이전 양초의 매개변수를 계산합니다. 따라서 지표는 시장 움직임의 추가 방향과 현재 양초의 종가를 예측합니다. 이 방법 덕분에 지표는 단기 및 중장기 거래 모두에 적합합니다. 지표를 사용하면 시장 상황을 분석하는 동안 지표가 생성할 잠재적 신호의 수를 설정할 수 있습니다. 표시기 설정에는 이를 위한 특별한 매개변수가 있습니다. 또한 인디케이터는 새로운 신호에 대해 차트의 메시지 형태, 이메일 및 PUSH 알림 형태로 알릴 수 있습니다. 구매 후 저에게 꼭 써주세요! 나는 당신에게 지표와 거래에 대한 나의 추천을 줄 것입니다! 또한 보너스를 받으세요!
Trend Oscillator mw
DMITRII GRIDASOV
Trend Oscillator - 고급 맞춤형 Crypto_Forex 지표, 효율적인 거래 도구입니다! - 고급 새로운 계산 방법 사용 - 매개변수 "계산 가격"에 대한 20가지 옵션. - 지금까지 개발된 가장 매끄러운 오실레이터. - 상승 추세는 녹색, 하락 추세는 빨간색. - 과매도 값: 5 미만, 과매도 값: 95 이상. - 이 지표로 표준 전략도 업그레이드할 수 있는 기회가 많습니다. - PC 및 모바일 알림. ................................................................................................................................................ 여기를 클릭하여 고품질 트레이딩 로봇과 지표를 확인하세요! 이 MQL5 웹사이트에서만 제공되는 오리지널 제품입니다.
PipFinite Trend PRO
Karlo Wilson Vendiola
4.88 (2247)
Breakthrough Solution For Trend Trading And Filtering With All Important Features Built Inside One Tool! Trend PRO's smart algorithm detects the trend, filters out market noise and gives entry signals with exit levels. The new features with enhanced rules for statistical calculation improved the overall performance of this indicator. Important Information Revealed Maximize the potential of Trend Pro, please visit www.mql5.com/en/blogs/post/713938 The Powerful Expert Advisor Version Automatin
Intraday Levels shows intraday levels grid for intraday trading Shows a grid for the day levels, gives you a guide to know the trend and to measure intraday trades (stop-loss and take-profit). Parameters are: Levels Mode: Basic mode: Shows highest, lowest and middle levels. Advanced mode: Shows highest, lowest, middle and intermediate levels. Fibonacci mode: Shows session Fibonacci retracements levels. Momentum mode: Shows delayed Advanced levels to identify momentum. Smooth Period (Momentum m
The Th3Eng PipFinite indicator is based on a very excellent analysis of the right trend direction with perfect custom algorithms. It show the true direction and the best point to start trading. With StopLoss point and Three Take Profit points. Also it show the right pivot of the price and small points to order to replace the dynamic support and resistance channel, Which surrounds the price. And Finally it draws a very helpful Box on the left side on the chart includes (take profits and Stop loss
DYJ Alligator SignalSource   is based on Alligator   indicator. It can be used for any currency pair and timeframe. The blue line (Alligator's Jaw) is the Balance Line for the timeframe that was used to build the chart (13-period Smoothed Moving Average, moved into the future by 8 bars); Red Line (Alligator's Teeth) is the Balance Line for the value timeframe of one level lower (8-period Smoothed Moving Average, moved by 5 bars into the future); Green Line (Alligator's Lips) is the Balance Line
이 제품의 구매자들이 또한 구매함
Gann Made Easy
Oleg Rodin
4.83 (152)
Gann Made Easy 는 mr.의 이론을 사용하여 최고의 거래 원칙을 기반으로 하는 전문적이고 사용하기 쉬운 Forex 거래 시스템입니다. W.D. 간. 이 표시기는 Stop Loss 및 Take Profit Levels를 포함하여 정확한 BUY 및 SELL 신호를 제공합니다. PUSH 알림을 사용하여 이동 중에도 거래할 수 있습니다. 거래 팁, 보너스, GANN MADE EA를 무료로 받으시려면 구매 후 저에게 연락주세요! 아마도 Gann 거래 방법에 대해 이미 여러 번 들었을 것입니다. 일반적으로 Gann의 이론은 초보자 거래자뿐만 아니라 이미 거래 경험이 있는 사람들에게도 매우 복잡한 것입니다. Gann의 거래 방식은 이론적으로 적용하기 쉽지 않기 때문입니다. 나는 그 지식을 연마하고 Forex 지표에 최고의 원칙을 적용하기 위해 몇 년을 보냈습니다. 표시기는 적용하기가 매우 쉽습니다. 차트에 첨부하고 간단한 거래 권장 사항을 따르기만 하면 됩니다. 지표는 지속적으로 시장
Smc Blast Signal
Mohit Dhariwal
5 (4)
NEW YEAR 2026 SALE OFFER PRICE AT JUST 99 DOLLARS FEW COPIES ONLY AT This price From 10th Jan -20th Jan MIDNIGHT Final offer GRAB YOUR COPY ON THIS New Year EVE Prices will be increased to 150 after the offer period ends Full Fledged EA and Alert plus for alerts will also be provided in this offer along with the purchase of Indicator. Limited copies only at this price and Ea too. Grab your copy soon Alert plus for indicator with set file is kept in comment section with the image  SMC Blast Signa
현재 20% 할인 ! 초보자 또는 전문가 트레이더를 위한 최고의 솔루션! 이 대시보드 소프트웨어는 28개의 통화 쌍에서 작동합니다. 2가지 주요 지표(Advanced Currency Strength 28 및 Advanced Currency Impulse)를 기반으로 합니다. 전체 Forex 시장에 대한 훌륭한 개요를 제공합니다. 고급 통화 강도 값, 통화 이동 속도 및 모든(9) 시간대의 28 Forex 쌍에 대한 신호를 보여줍니다. 추세 및/또는 스캘핑 기회를 정확히 파악하기 위해 차트의 단일 지표를 사용하여 전체 시장을 볼 수 있을 때 거래가 어떻게 개선될지 상상해 보십시오! 잠재적인 거래를 식별하고 확인하면서 강력한 통화와 약한 통화를 더욱 쉽게 식별할 수 있도록 이 지표에 기능을 내장했습니다. 이 표시기는 통화의 강세 또는 약세가 증가 또는 감소하는지 여부와 모든 시간대에서 수행되는 방식을 그래픽으로 보여줍니다. 추가된 새로운 기능은 현재 시장 조건 변화에 적응하는
Game Changer Indicator
Vasiliy Strukov
4.67 (12)
Game Changer는 모든 금융 상품에 사용하도록 설계된 혁신적인 추세 지표로, 메타트레이더를 강력한 추세 분석기로 탈바꿈시켜 줍니다. 이 지표는 재작성이나 지연 현상이 발생하지 않습니다. 모든 시간대에서 작동하며 추세 파악을 지원하고, 잠재적 반전 신호를 제공하며, 트레일링 스톱 메커니즘으로 활용되고, 신속한 시장 반응을 위한 실시간 알림을 제공합니다. 숙련된 투자자, 전문가, 또는 우위를 점하려는 초보자 등 누구나 이 도구를 통해 자신감과 원칙을 바탕으로, 그리고 근본적인 추세 역학에 대한 명확한 이해를 바탕으로 거래할 수 있습니다. 구매 후 바로 연락 주시면 개인 보너스를 드립니다! 강력한 지지선과 추세 스캐너 지표를 무료로 받으실 수 있습니다. 개인 메시지로 알려주세요 저는 텔레그램에서 EA나 특별 세트를 판매하지 않습니다. Mql5에서만 사용 가능하며, 세트 파일은 제 블로그에서만 볼 수 있습니다 . 사기꾼을 조심하시고 다른 사람에게서 세트를 구매하지 마세요 설정 추세
Scalper Inside PRO
Alexey Minkov
4.74 (69)
An exclusive indicator that utilizes an innovative algorithm to swiftly and accurately determine the market trend. The indicator automatically calculates opening, closing, and profit levels, providing detailed trading statistics. With these features, you can choose the most appropriate trading instrument for the current market conditions. Additionally, you can easily integrate your own arrow indicators into Scalper Inside Pro to quickly evaluate their statistics and profitability. Scalper Inside
M1 Sniper
Oleg Rodin
4.89 (18)
M1 SNIPER 는 사용하기 쉬운 거래 지표 시스템입니다. M1 시간대에 맞춰 설계된 화살표 지표입니다. 이 지표는 M1 시간대 스캘핑을 위한 단독 시스템으로 사용할 수 있으며, 기존 거래 시스템의 일부로도 사용할 수 있습니다. 이 거래 시스템은 M1 시간대 거래용으로 특별히 설계되었지만, 다른 시간대에도 사용할 수 있습니다. 원래는 XAUUSD와 BTCUSD 거래를 위해 이 방법을 설계했지만, 다른 시장 거래에도 유용하다는 것을 알게 되었습니다. 이 지표의 신호는 추세 방향과 반대로 거래될 수 있습니다. 저는 지표의 신호를 활용하여 양방향으로 거래할 수 있도록 돕는 특별한 거래 기법을 알려드립니다. 이 방법은 특별한 동적 지지선과 저항선 가격 영역을 활용하는 것을 기반으로 합니다. 구매하시면 M1 SNIPER 화살표 지표를 바로 다운로드하실 수 있습니다. 또한, 아래 스크린샷에 표시된 Apollo Dynamic SR 지표는 M1 SNIPER 도구를 사용하는 모든 사용자에게 무료로
GOLD Impulse with Alert
Bernhard Schweigert
4.64 (11)
이 지표는 Advanced Currency IMPULSE with ALERT  +   Currency Strength Exotics  의 2가지 제품의 슈퍼 조합입니다. 그것은 모든 시간 프레임에 대해 작동하며 8개의 주요 통화와 하나의 기호에 대한 강약의 충동을 그래픽으로 보여줍니다! 이 표시기는 금, 이국적인 쌍, 상품, 지수 또는 선물과 같은 기호에 대한 통화 강도 가속을 표시하는 데 특화되어 있습니다. 금, 은, 오일, DAX, US30, MXN, TRY, CNH 등의 진정한 통화 강도 가속(충동 또는 속도)을 표시하기 위해 9번째 줄에 모든 기호를 추가할 수 있습니다. 새로운 기본 알고리즘을 기반으로 구축되어 잠재적인 거래를 훨씬 더 쉽게 식별하고 확인할 수 있습니다. 이는 통화의 강세 또는 약세가 가속되는지 여부를 그래픽으로 표시하고 가속 속도를 측정하기 때문입니다. 자동차의 속도계처럼 생각하면 됩니다. 가속화할 때 Forex 시장에서 동일한 일이 분명히 더 빠르
FX Volume
Daniel Stein
4.63 (38)
FX Volume: 브로커 시각에서 바라보는 진짜 시장 심리 간단 요약 트레이딩 접근 방식을 한층 더 향상시키고 싶으신가요? FX Volume 는 소매 트레이더와 브로커의 포지션을 실시간으로 파악할 수 있게 해 줍니다. 이는 COT 같은 지연된 보고서보다 훨씬 빠릅니다. 꾸준한 수익을 추구하는 분이든, 시장에서 더 깊은 우위를 원하시는 분이든, FX Volume 을 통해 대규모 불균형을 찾아내고, 돌파 여부를 확인하며 리스크 관리를 정교화할 수 있습니다. 지금 시작해 보세요! 실제 거래량 데이터가 의사결정을 어떻게 혁신할 수 있는지 직접 경험해 보시기 바랍니다. 1. 트레이더에게 FX Volume이 매우 유익한 이유 탁월한 정확도를 지닌 조기 경보 신호 • 다른 사람들보다 훨씬 앞서, 각 통화쌍을 매수·매도하는 트레이더 수를 거의 실시간으로 파악할 수 있습니다. • FX Volume 은 여러 리테일 브로커에서 추출한 실제 거래량 데이터를 종합해 명확하고 편리한 형태로 제공하는
Volatility Trend System - a trading system that gives signals for entries. The volatility system gives linear and point signals in the direction of the trend, as well as signals to exit it, without redrawing and delays. The trend indicator monitors the direction of the medium-term trend, shows the direction and its change. The signal indicator is based on changes in volatility and shows market entries. The indicator is equipped with several types of alerts. Can be applied to various trading ins
Currency Strength Wizard
Oleg Rodin
4.84 (55)
통화 강도 마법사는 성공적인 거래를 위한 올인원 솔루션을 제공하는 매우 강력한 지표입니다. 표시기는 여러 시간 프레임의 모든 통화 데이터를 사용하여 이 또는 해당 외환 쌍의 힘을 계산합니다. 이 데이터는 특정 통화의 힘을 확인하는 데 사용할 수 있는 사용하기 쉬운 통화 지수 및 통화 전력선의 형태로 표시됩니다. 필요한 것은 거래하려는 차트에 표시기를 부착하는 것뿐입니다. 표시기는 거래하는 통화의 실제 강세를 보여줍니다. 지표는 또한 추세와 거래할 때 유리하게 사용할 수 있는 구매 및 판매 거래량 압력의 극한값을 보여줍니다. 지표는 또한 피보나치에 기반한 가능한 대상을 보여줍니다. 표시기는 PUSH 알림을 포함한 모든 유형의 알림을 제공합니다. 구매 후 연락주세요. 나는 당신과 거래 팁을 공유하고 당신에게 무료로 훌륭한 보너스 지표를 줄 것입니다! 나는 당신에게 행복하고 유익한 거래를 기원합니다!
Currency Strength Exotics
Bernhard Schweigert
4.88 (33)
현재 20% 할인! 초보자 또는 전문가 트레이더를 위한 최고의 솔루션! 이 표시기는 Exotic Pairs Commodities, Indexes 또는 Futures와 같은 기호에 대한 통화 강도를 표시하는 데 특화되어 있습니다. 금, 은, 석유, DAX, US30, MXN, TRY, CNH 등의 진정한 통화 강도를 보여주기 위해 9번째 줄에 모든 기호를 추가할 수 있습니다. 이것은 독특하고 고품질이며 저렴한 거래 도구입니다. 우리는 많은 독점 기능과 새로운 공식을 통합했습니다. 새로운 추세 또는 스캘핑 기회의 정확한 트리거 포인트를 정확히 찾아낼 수 있기 때문에 거래가 어떻게 개선될지 상상해 보십시오. 사용 설명서: 여기를 클릭 https://www.mql5.com/en/blogs/post/708876 모든 시간대에 작동합니다. TREND를 빠르게 확인할 수 있습니다! 새로운 기본 알고리즘을 기반으로 설계되어 잠재적인 거래를 더욱 쉽게 식별하고 확인할 수 있습니다. 8개의
Miraculous Indicator – Gann Square of Nine 기반 100% 비리페인트 Forex 및 바이너리 도구 이 영상은 Miraculous Indicator 를 소개합니다. 이 지표는 Forex 및 바이너리 옵션 트레이더를 위해 특별히 개발된 매우 정확하고 강력한 트레이딩 도구입니다. 이 지표가 독특한 이유는 전설적인 **Gann Square of Nine(Gann 9의 사각형)**과 **Gann's Law of Vibration(Gann 진동의 법칙)**에 기반을 두고 있기 때문입니다. 이는 현대 트레이딩에서 가장 정밀한 예측 도구 중 하나로 손꼽힙니다. Miraculous Indicator는 완전히 비리페인트(non-repaint) 됩니다. 즉, 캔들이 마감된 후에도 신호가 변경되거나 사라지지 않습니다. 보이는 것이 곧 결과입니다. 이는 트레이더가 자신감을 가지고 거래에 진입하고 청산할 수 있는 신뢰할 수 있고 일관된 기반을 제공합니다. 주요 특징: Gann
Trend indicator AI
Ramil Minniakhmetov
5 (75)
트렌드 인공 지능 지표는 실행 가능한 진입 점 및 반전 경고와 추세 식별을 결합하여 상인의 시장 분석을 향상시킬 훌륭한 도구입니다. 이 표시기는 사용자가 자신감과 정밀도로 외환 시장의 복잡성을 탐색 할 수 있도록 지원합니다 기본 신호 외에도 트렌드 인공 지능 지표는 풀백 또는 되돌림 중에 발생하는 2 차 진입 점을 식별하여 거래자가 기존 트렌드 내에서 가격 수정을 활용할 수 있도록합니다. 중요한 장점: ·작동 4 및 5 *명확한 구매 또는 판매 신호 *다시 칠하지 않습니다 *모든 자산에서 작동 나는 전보 사기에 개 또는 세트를 판매하지 않도록주의. 모든 설정은 블로그에 여기에 무료.  중요! 지침 및 보너스를 얻기 위해 구입 후 즉시 저에게 연락! 진짜 가동 감시는 뿐 아니라 나의 다른 제품 여기에서 찾아낼 수 있습니다: https://www.mql5.com/en/users/mechanic/seller&nbsp ; 설정 및 입력: 모든 자산에 대해 기본 설정을 권
Trend Lines PRO
Roman Podpora
5 (1)
트렌드 라인즈 프로       이 지표는 시장이 실제로 어떤 방향으로 전환되는지 파악하는 데 도움이 됩니다. 실제 추세 반전 지점과 주요 시장 참여자들이 다시 진입하는 지점을 보여줍니다. 보시다시피       BOS 라인       복잡한 설정이나 불필요한 노이즈 없이 더 높은 시간대의 추세 변화와 주요 레벨을 확인할 수 있습니다. 신호는 차트에 다시 그려지지 않고 캔들이 마감된 후에도 계속 표시됩니다. 지표가 보여주는 내용: 실제 변화       추세(BOS 라인) 한 번 신호가 나타나면 그 신호는 계속 유효합니다! 이는 신호를 발생시킨 후 변경될 수 있는 리페인팅 방식의 지표와 중요한 차이점입니다. 리페인팅 방식의 지표는 잠재적으로 자금 손실로 이어질 수 있습니다. 이제 더욱 높은 확률과 정확도로 시장에 진입할 수 있습니다. 또한 화살표가 나타난 후 목표가(익절)에 도달하거나 반전 신호가 나타날 때까지 캔들스틱 색상이 계속 바뀌는 기능도 있습니다. 반복 항목          
Dynamic Forex28 Navigator
Bernhard Schweigert
4.43 (7)
Dynamic Forex28 Navigator - 차세대 외환 거래 도구. 현재 49% 할인. Dynamic Forex28 Navigator는 오랫동안 인기 있는 지표의 진화형으로, 세 가지의 힘을 하나로 결합했습니다. 고급 통화 Strength28 지표(695개 리뷰) + 고급 통화 IMPULSE with ALERT(520개 리뷰) + CS28 콤보 신호(보너스). 지표에 대한 자세한 정보 https://www.mql5.com/en/blogs/post/758844 차세대 Strength 지표는 무엇을 제공합니까?  원래 지표에서 좋아했던 모든 것이 새로운 기능과 더 높은 정확도로 강화되었습니다. 주요 기능: 독점적인 통화 Strength 공식.  모든 시간대에 걸쳐 부드럽고 정확한 강도선. 추세와 정확한 진입을 식별하는 데 이상적입니다. 역동적인 시장 피보나치 수준(시장 피보나치).  이 지표에만 있는 고유한 기능. 가격 차트가 아닌 통화 강도에 피보나치가 적용됩니다.
Supply and Demand Dashboard PRO
Bernhard Schweigert
4.8 (20)
현재 20% 할인! 이 대시보드는 여러 기호와 최대 9개의 타임프레임에서 작동하는 매우 강력한 소프트웨어입니다. 주요 지표(최상의 리뷰: 고급 공급 수요)를 기반으로 합니다.   Advanced Supply Demand 대시보드는 훌륭한 개요를 제공합니다. 다음과 같이 표시됩니다.  영역 강도 등급을 포함하여 필터링된 공급 및 수요 값, 영역에 대한/및 영역 내 Pips 거리, 중첩된 영역을 강조 표시하고 모든 (9) 시간 프레임에서 선택한 기호에 대해 4가지 종류의 경고를 제공합니다. 그것은 당신의 개인적인 필요에 맞게 고도로 구성 가능합니다! 당신의 혜택! 모든 트레이더에게 가장 중요한 질문: 시장에 진입하기에 가장 좋은 수준은 무엇입니까? 최고의 성공 기회와 위험/보상을 얻으려면 강력한 공급/수요 영역 내 또는 그 근처에서 거래를 시작하십시오. 손절매를 위한 최적의 장소는 어디입니까? 가장 안전하려면 강력한 수요/공급 구역 아래/위에 정류장을 두십시오.
Apollo SR Master
Oleg Rodin
5 (1)
Apollo SR Master는 지지/저항 구간에서의 거래를 더욱 쉽고 안정적으로 만들어 주는 특수 기능을 갖춘 지지/저항 지표입니다. 이 지표는 지역 가격의 고점과 저점을 감지하여 시간 지연 없이 실시간으로 지지/저항 구간을 계산합니다. 새롭게 형성된 저항 구간을 확인하기 위해 지표는 해당 저항 구간을 실제 매도 또는 매수 신호로 활용할 수 있음을 나타내는 특수 신호를 표시합니다. 이 경우, 저항 구간의 강도가 높아지고, 따라서 저항 구간에서의 성공적인 거래 가능성도 높아집니다. 이것이 바로 이 지표의 핵심 아이디어입니다. SR 존은 손절매와 이익실현을 더욱 쉽게 할 수 있도록 해줍니다. 신호 방향에 따라 SR 존 위 또는 아래 공간을 손절매로 활용할 수 있습니다. 또한, 반대쪽 SR 존은 잠재적 이익실현 영역으로 활용할 수 있습니다. 또한 Apollo SR Master 지표를 사용하는 모든 사용자에게 "Apollo Price Action System" 지표를 무료로 제공합니다.
FX Power MT4 NG
Daniel Stein
4.95 (20)
FX Power: 통화 강세 분석으로 더 스마트한 거래 결정을 개요 FX Power 는 어떤 시장 상황에서도 주요 통화와 금의 실제 강세를 이해하기 위한 필수 도구입니다. 강한 통화를 매수하고 약한 통화를 매도함으로써 FX Power 는 거래 결정을 단순화하고 높은 확률의 기회를 발견합니다. 트렌드를 따르거나 극단적인 델타 값을 사용해 반전을 예측하고자 한다면, 이 도구는 귀하의 거래 스타일에 완벽히 적응합니다. 단순히 거래하지 말고, FX Power 로 더 스마트하게 거래하세요. 1. FX Power가 거래자에게 매우 유용한 이유 통화와 금의 실시간 강세 분석 • FX Power 는 주요 통화와 금의 상대적 강세를 계산하고 표시하여 시장 역학에 대한 명확한 통찰력을 제공합니다. • 어떤 자산이 앞서고 있고 어떤 자산이 뒤처지는지 모니터링하여 보다 현명한 거래 결정을 내릴 수 있습니다. 포괄적인 멀티 타임프레임 뷰 • 단기, 중기 및 장기 타임프레임에서 통화와 금의 강세를
Katana Scalper Pro
Yuki Miyake
4 (4)
MQL5マーケットの厳格な「第四条」ガイドラインに完全準拠した英語版の全文です。 MQL5では英語が主言語となるため、このテキストを説明文の冒頭(日本語より上)に配置することを強くお勧めします。専門的かつ冷静なトーンで作成しており、世界中のプロトレーダーに「技術的根拠のあるツール」として認識される構成になっています。 KATANA Scalper for MT4  Product Overview KATANA Scalper for MT4 is a high-performance technical analysis indicator optimized for the MetaTrader 4 platform. It is specifically engineered to address the two most significant challenges in short-term trading (scalping and day trading): Price Noise and Signal Lag . Utilizing a proprietary s
이 지표를 구매하면 제 프로페셔널 트레이드 매니저를 무료로 드립니다. 우선 이 거래 시스템이 리페인팅, 리드로잉 및 레이그 인디케이터가 아니라는 점을 강조하는 것이 중요합니다. 이는 수동 및 로봇 거래 모두에 이상적인 것으로 만듭니다. 온라인 강좌, 설명서 및 프리셋 다운로드. "스마트 트렌드 트레이딩 시스템 MT5"은 새로운 및 경험이 풍부한 트레이더를 위해 맞춤형으로 제작된 종합적인 거래 솔루션입니다. 10개 이상의 프리미엄 인디케이터를 결합하고 7개 이상의 견고한 거래 전략을 특징으로 하여 다양한 시장 조건에 대한 다목적 선택이 가능합니다. 트렌드 추종 전략: 효과적인 트렌드 추이를 타기 위한 정확한 진입 및 손절 관리를 제공합니다. 반전 전략: 잠재적인 트렌드 반전을 식별하여 트레이더가 범위 시장을 활용할 수 있게 합니다. 스캘핑 전략: 빠르고 정확한 데이 트레이딩 및 단기 거래를 위해 설계되었습니다. 안정성: 모든 인디케이터가 리페인팅, 리드로잉 및 레이그가 아니므로 신뢰
FX Levels MT4
Daniel Stein
5 (2)
FX Levels: 모든 시장을 위한 뛰어난 정확도의 지지와 저항 간단 요약 통화쌍, 지수, 주식, 원자재 등 어떤 시장이든 믿을 만한 지지·저항 레벨을 찾고 싶나요? FX Levels 는 전통적인 “Lighthouse” 기법과 첨단 동적 접근을 결합해, 거의 보편적인 정확성을 제공합니다. 실제 브로커 경험을 반영하고, 자동화된 일별 업데이트와 실시간 업데이트를 결합함으로써 FX Levels 는 가격 반전 포인트를 파악하고, 수익 목표를 설정하며, 자신 있게 트레이드를 관리할 수 있게 돕습니다. 지금 바로 시도해 보세요—정교한 지지/저항 분석이 어떻게 여러분의 트레이딩을 한 단계 끌어올릴 수 있는지 직접 확인하세요! 1. FX Levels가 트레이더에게 매우 유용한 이유 뛰어난 정확도의 지지·저항 존 • FX Levels 는 다양한 브로커 환경에서도 거의 동일한 존을 생성하도록 설계되어, 데이터 피드나 시간 설정 차이로 인한 불일치를 해소합니다. • 즉, 어떤 브로커를 사용하
The Super Arrow Indicator provides non-repainting buy and sell signals with exceptional accuracy. Key Features No repainting – confirmed signals remain fixed Clear visual arrows: green for buy, red for sell Real-time alerts via pop-up, sound, and optional email Clean chart view with no unnecessary clutter Works on all markets: Forex, gold, oil, indices, crypto Adjustable Parameters TimeFrame Default: "current time frame" Function: Sets the time frame for indicator calculation Options: Can be set
Adaptive Volatility Range
Stanislav Konin
5 (3)
Adaptive Volatility Range [AVR] is a powerful tool for identifying key trend reversal points. AVR accurately reflects the Average True Range (ATR) of volatility, taking into account the Volume-Weighted Average Price (VWAP). The indicator adapts to any market volatility by calculating the average volatility over a specific period, ensuring a stable rate of profitable trades. You receive not just an indicator but a professional automated trading system , AVR-EA . Advantages: Automated Trading Sys
Trend Screener
STE S.S.COMPANY
4.79 (95)
트렌드 표시기, 트렌드 트레이딩 및 필터링을 위한 획기적인 고유 솔루션, 하나의 도구 안에 내장된 모든 중요한 트렌드 기능! Forex, 상품, 암호 화폐, 지수 및 주식과 같은 모든 기호/도구에 사용할 수 있는 100% 다시 칠하지 않는 다중 시간 프레임 및 다중 통화 표시기입니다. 기간 한정 특가: 지원 및 저항 스크리너 지표는 단 100달러에 평생 제공됩니다. (원래 가격 50 달러) (제안 연장) Trend Screener는 차트에 점이 있는 화살표 추세 신호를 제공하는 효율적인 지표 추세 추종 지표입니다. 추세 분석기 표시기에서 사용할 수 있는 기능: 1. 트렌드 스캐너. 2. 최대 이익 분석이 있는 추세선. 3. 추세 통화 강도 측정기. 4. 경고가 있는 추세 반전 점. 5. 경고가 있는 강력한 추세 점. 6. 추세 화살표 Trend Screener Indicator가 있는 일일 분석 예, 일일 신호 성능...등은 여기에서 찾을 수 있습니다.   여기를 클릭하십시오. L
Shogun Trade
Yuki Miyake
5 (1)
SHOGUN Trade - Strategic Market Structure & Multi-Timeframe Dashboard Concept: The Commander’s Perspective In the battlefield of trading, getting lost in localized price fluctuations (noise) is the most significant risk to capital. SHOGUN Trade is engineered to elevate a trader's perspective from "reactive" to "strategic," providing a comprehensive overview of market structures across multiple time horizons. This system monitors seven timeframes (M1 to D1) simultaneously, quantifying market m
Basic Harmonic Patterns Dashboard
Mehran Sepah Mansoor
5 (3)
이 대시보드는 선택한 심볼에 대해 사용 가능한 최신 고조파 패턴을 표시하므로 시간을 절약하고 더 효율적으로 사용할 수 있습니다 / MT5 버전 . 무료 인디케이터: Basic Harmonic Pattern 인디케이터 열 Symbol : 선택한 심볼이 나타납니다 Trend : 강세 또는 약세 Pattern : 패턴 유형(가틀리, 나비, 박쥐, 게, 상어, 사이퍼 또는 ABCD) Entry : 진입 가격 SL: 스톱로스 가격 TP1: 1차 테이크프로핏 가격 TP2: 2차 테이크프로핏 가격 TP3: 3차 테이크프로핏 가격 Current price: 현재 가격 Age (in bars): 마지막으로 그려진 패턴의 나이 주요 입력 Symbols : "28개 주요 통화쌍" 또는 "선택한 심볼" 중에서 선택합니다. Selected Symbols : 쉼표로 구분하여 모니터링하려는 원하는 심볼("EURUSD,GBPUSD,XAUUSD")을 선택합니다. 브로커에 쌍에 접미사 또는 접두사가 있는
Atomic Analyst
Issam Kassas
5 (3)
우선적으로 언급할 점은이 거래 지표가 다시 그리지 않고 지연되지 않으며 이를 통해 수동 및 로봇 거래 모두에 이상적이라는 점입니다. 사용자 매뉴얼: 설정, 입력 및 전략. Atomic Analyst는 가격의 강도와 모멘텀을 활용하여 시장에서 더 나은 이점을 찾는 PA Price Action Indicator입니다. 고급 필터를 장착하여 잡음과 거짓 신호를 제거하고 거래 잠재력을 높이는 데 도움이 됩니다. 복잡한 지표의 다중 레이어를 사용하여 Atomic Analyst는 차트를 스캔하고 복잡한 수학적 계산을 간단한 신호와 색상으로 변환하여 초보 트레이더가 이해하고 일관된 거래 결정을 내릴 수 있도록합니다. "Atomic Analyst"는 새로운 및 경험이 풍부한 트레이더를위한 종합적인 거래 솔루션입니다. 프리미엄 지표와 최고 수준의 기능을 하나의 거래 전략에 결합하여 모든 종류의 트레이더에 대한 다재다능한 선택지가되었습니다. 인트라데이 거래 및 스캘핑 전략 : 빠르고 정확한 일일
AW Breakout Catcher
AW Trading Software Limited
5 (14)
가격 수준 분석, 고급 통계, TakeProfit 계산 및 3가지 유형의 알림. 이익: 결과를 다시 그리지 마십시오 촛불이 닫힐 때 엄격하게 신호를 보냅니다. 거짓 고장 필터링 알고리즘 어떤 트렌드 전략과도 잘 어울립니다. 모든 도구 및 시계열에서 작동 매뉴얼 및 지침 ->   HERE   / 문제 해결 ->   HERE   / MT5 버전 ->   HERE 지표로 거래하는 방법 AW Breakout Catcher와 거래하는 간단한 3단계: 1단계 - 포지션 열기 70% 이상의 성공률로 매수 신호를 받았습니다. 2단계 - StopLoss 결정 반대 신호로 트렁크 선택 3단계 - 이익 실현 전략 정의 전략 1: TP1 도달 시 전체 포지션 청산 전략 2: TP1 도달 시 포지션의 50% 청산 및 TP2 도달 시 나머지 50% 청산 전략 3: 반대 신호에서 전체 포지션 청산 통계 모듈 더 나은 쌍 선택을 위해 내장된 통계 계산을 사용하십시오. 거래 계산 - 통계가 제공되는 총 신호 수
Prop Firm Gold Indicator
Mohit Dhariwal
5 (3)
This is a unique  Gold Indicator On channel trading pullbacks and gives accurate entries on gold and major Fx Pairs on M15tf. It has the ability to pass any prop firm Challenge and get accurate entries on gold and major fx pairs. EA FOR PROP FIRM AND CHANNEL INDICATOR IS FREE ALONG WITH THIS POWERFUL INDICATOR ALONG WITH THE BEST SET FILE FOR FIRST 25 USERS. Strategy tester report is in comment section. INDICATOR FEATURES: INDICATOR IS BEST ON M15 GIVES ACCURATE ENTRIES  EA AND CHANNEL INDICATO
Gold Signal Pro
Mohamed Hassan
First 25 copies at $80, after that price becomes $149 Gold Signal Pro is a powerful MT4 indicator designed to help traders spot strong price reactions in the market. It focuses on clear wick rejections , showing when price strongly rejects a level and often continues in the same direction. Gold Signal Pro is mainly built for scalping gold (XAUUSD) and works best on lower timeframes like M5 and M15 , where timing matters most. That said, it can also be used on any forex pair, any symbol, and a
제작자의 제품 더 보기
Ichimoku Advanced Pro MTF
Hoang Ngoc Thach
4.67 (3)
Ichimoku Kinko Hyo is a purpose-built trend trading charting system that has been successfully used in nearly every tradable market. It is unique in many ways, but its primary strength is its use of multiple data points to give the trader a deeper, more comprehensive view into price action. This deeper view, and the fact that Ichimoku is a very visual system, enables the trader to quickly discern and filter "at a glance" the low-probability trading setups from those of higher probability. This i
FREE
Suport Resistance
Hoang Ngoc Thach
The indicator compares Fractal and Zigzag indicators to define hard Support and Resistance. The arrow signal appears when a new support or resistance emerges or when the price breaks through Support and Resistance zone. This indicator is efficient in conjunction with a rebound and breakout strategy. It works well on H4 and D1 for all pairs. Settings BarCounts = 200; FastPeriod = 7 - fast period SlowPeriod = 14 - slow period Show_SR = true - show support/resistance Show_Arrows = true - show up/d
Gann Fan Zigzag
Hoang Ngoc Thach
A form of technical analysis based on the ideas that the market is geometric and cyclical in nature. A Gann Fan consists of a series of diagonal lines called Gann angles, of which there are nine. These angles are superimposed over a price chart to show a security's support and resistance levels. The resulting image is supposed to help technical analysts predict price changes. Although once drawn by hand, today Gann Fans can be drawn with software programs. This indicator draws Gann Fan based on
Advanced MA Signal
Hoang Ngoc Thach
This indicator was built based on Moving Average, but it always reset counter at the first bar of day/week/month. Simple arrow signal to show buy/sell signal. 3 lines of moving average can be used as price channel, this is market trend also. time_zone option allows choosing time for trading and session movement analysis.
Manual Panel
Hoang Ngoc Thach
5 (2)
I like trading manually, so I created this tool to make my trade more easier and faster. Features Money management. Click for place order ( Buy/Sell/BuyStop/BuyLimit/SellStop/SellLimit). Many buttons for control your account (Close All, Remove Pendings, Breakeven, Hedging). Auto hide if not use for 2 minutes. See profit on current symbol. Free to move panel to where you want. Save your settings for using on next time. Special: It's work on backtest mode! You can use this for training yourself.
Extrem Fast Channel
Hoang Ngoc Thach
This indicator helps to find high/low points. This is not perfect trend indicator, because sometime it shows anti-market trend. But it never misses highest and lowest price in history. So that, the rules for entry are: Sell with downtrend (red line), Buy with uptrend (blue line). Yellow arrows for Sell, but it should be confirmed by downtrend. Aqua arrows for Buy, but it should be confirmed by uptrend.
NoFear
Hoang Ngoc Thach
5 (1)
NoFear indicator is based on Advanced Moving Average. It is used in technical chart analysis providing signals whenever a rate change appears that exceeds the upper or lower border. The indicator works very well on trend market. It is easy to find good entry points by blue/violet arrows. The upper and lower bands should be used like support/resistance levels and stop/exit points. All signals do not repaint, and can be used immediately when they are coming. This means we do not need to wait for a
CCI Exit
Hoang Ngoc Thach
5 (1)
This is a great indicator to find an exit point. We never know when the market is going to change its trend. Many indicators give you a good entry point, but not good to use opposite signal as an exit point, because the signal always comes too late. This indicator will protect your profit as soon as possible when a signal to exit is found! Don't use this signal to enter, it may not be good for making an entry. The signal doesn't repaint, wait until a bar closes to make sure it is confirmed. Indi
Trend Trade 2015
Hoang Ngoc Thach
Trend Trade indicator is based on ADX indicator to define long/medium/short trend and good entry signals. The product supports virtual trade on chart to show where/when should we make an entry/exit. It works very well on D1 or above. The indicator is efficient on GOLD and CFDs. Alert_Settings = "+++++++++++++++++++++++" SendMailMode = true - Send email SendNotificationMode = true - Send notification to your phone AlertMode = true - Sound alert Show_Virtual_Trades = true - Show virtual trades Sin
Trend Prediction
Hoang Ngoc Thach
5 (3)
i-Regression Channel generates regression channel: Linear regression channel consists of two parallel lines located at the equal distance from the linear regression trend line. The distance between the channel borders and the regression line is equal to the value of the highest close price deviation from the regression line. degree - degree of regression, changes from 1 to 61; kstd - regression channel width; bars - the number of bars for the channel calculation; shift - the channel horizontal s
YourBigPlan
Hoang Ngoc Thach
The indicator is based on Moving Average to define the trend, then it finds a good entry point and follows the trend. We will keep open on a new signal until the trend is changed, and all trades exit on an opposite signal. The exit point is a bit late relative to the highest profitable point (at top/bottom), but it is the best point to exit your trades. Keep the trades, which are moving the right direction to get a high profit, and stop wrong trades as soon as possible when the trend is changed
Using high-volatility channel breakout-style trading systems has historically worked well across major currency pairs, show promise in determining the opportune time to trade the channel breakout trading strategy. This Breakout Strategy may look simple, but it is good follow trade trader strategy. Setting: Channel Periods: default 20 BarsCount: bars count in history Alert_Settings = "+++++++++++++++++++++++" SendMailMode = true - Send email SendNotificationMode = true - Send notification to you
Reversal Breakout
Hoang Ngoc Thach
Reversal Breakout is a real breakout strategy. It is based on Moving Average indicator to define market trend and breakout points. Try to entry when price reverse is not good, because there are many false reversal signal, so that it is better to trade breakout at reverse point. This EA will work for all Timeframe, but I prefer to use it on H1 or above. Should use it on major pairs which are lowest Spread, and lowest Slippage: EURUSD,GBPUSD,USDJPY,GOLD,... No martingale No Grid Always use Stoplos
The indicator uses 2 Moving Average: 1 fast EMA and 1 slow EMA to define trend, reversal signal and breakout point. Reversal Signal comes on open time, it can be used as scalping signal for short time, but be careful with this signal because it may be an anti-trend signal, the indicator tries to catch reverse point. Breakout signal is where support or resistance was broken out, the reversal signal has failed. Breakout signal is stronger than the Reversal Signal. We can use support/resistance lev
ATeam Sonic Hope
Hoang Ngoc Thach
ATeam Sonic Hope ATeam Sonic Hope is a fully automated Expert Advisor with no use of martingale, sometime EA open more trade with new signal and exit all trade with overall profit. Some ocillators indicator were used to generate signal and use Higher Timeframe as maintrend to entry. Real operation monitoring as well as my other products can be found here: https://www.mql5.com/en/users/rockyhoangdn/seller General Recommendations The minimum deposit is 100 USD,  Recomend low spread pair like : EU
ATeam Divergence
Hoang Ngoc Thach
The CCI Divergence is a reasonably useful indicator in itself, but it is even more effective when used with divergence pattern trading. The CCI Divergence indicator signal is one of the most potent signals among the indicators that exist in the market. Here is new version for Divergence Indicator using CCI method, with more improvements. Divergences indicate a potential investment point because the directional moment does not confirm the price. A bullish divergence occurs when the underlying va
ATeam Impulse
Hoang Ngoc Thach
The Elder Impulse System was designed by Alexander Elder and featured in his book. According to Elder, “the system identifies inflection points where a trend speeds up or slows down”. The Impulse System is based on two indicators, a  exponential moving average and the MACD-Histogram. The moving average identifies the trend, while the MACD-Histogram measures momentum. As a result, the Impulse System combines trend following and momentum to identify tradable impulses. This unique indicator combina
ATeam Panel
Hoang Ngoc Thach
This is best control panel for trader who trade with Supply and Demand Zone. Easy to calculate entry lotsize by %risk/money risk/money target/fixed lot And support Half-Kelly feature: calculate the best Risk percentage for each trade follow Kelly criterion . Auto Change chart feature Exposure and Position manager Currencies Strength Meter And more features waiting you
New Volume Profile
Hoang Ngoc Thach
4 (1)
Volume Profile is an advanced charting study that displays trading activity over a specified time period at specified price levels. The study (accounting for user defined parameters such as number of rows and time period) plots a histogram on the chart meant to reveal dominant and/or significant price levels based on volume. Essentially, Volume Profile takes the total volume traded at a specific price level during the specified time period and divides the total volume into either buy volume or s
If you have been anywhere near Forex forums or social media lately, you have no doubt been hearing people talk about   Smart Money Concepts (SMC)   trading. You may be wondering what SMC is, and whether it deserves all the hype. In this post, we will introduce Smart Money Concepts trading to you so you can make an informed decision about whether or not to give this strategy a try in your own trading. What is SMC Forex trading? Smart Money Concepts (SMC) is one of many forex trading methods. SMC
Ichimoku Kinko Hyo is a purpose-built trend trading charting system that has been successfully used in nearly every tradable market. It is unique in many ways, but its primary strength is its use of multiple data points to give the trader a deeper, more comprehensive view into price action. This deeper view, and the fact that Ichimoku is a very visual system, enables the trader to quickly discern and filter "at a glance" the low-probability trading setups from those of higher probability. This i
We try to detect long/medium/short-term trends and combine all of them with some price action patterns to find a good entry point. The Indicator benefits are: Can detect long/medium/short-term trends. Can detect resistances/supports level (like pivot levels). Shows entry point/time using colored arrows Multitimeframe mode is available.
This indicator is the same as the popular Heiken Ashi Smoothed. The Heikin Ashi indicator for MetaTrader 5 already exists, but it has two disadvantages: It paints the candles not accurate. It's not possible to change the candle width. See also Heikin Ashi in MQL5 Code Base . In this version there are no such disadvantages.
Any financial instrument that is traded on the market is a position of some active towards some currency. Forex differs from other markets only in the fact, that another currency is used as an active. As a result in the Forex market we always deal with the correlation of two currencies, called currency pairs. The project that started more than a year ago, helped to develop a group of indicators under a joint name cluster indicators. Their task was to divide currency pairs into separate currencie
This indicator is a copy of the Gann Hi-Lo Activator SSL indicator which was rewritten in MQL5. The original indicator was one-colored, that is why for more visual definition of the trend direction it was necessary to make it colored. This version is Mutitimefame, now you can see multi-trends in a separate window and signals in the main chart. Alert mode and sending of emails has been also added.
Ichimoku MTF
Hoang Ngoc Thach
MTF Ichimoku is a MetaTrader 5 indicator based on well known Ichimoku. In MetaTrader 5 we have Ichimoku already included as a standard technical indicator. However it can be used only for the current timeframe. When we are looking for a trend, it is very desirable to have Ichimokuis showing higher timeframes. MTF Ichimoku presented here has additional parameter - TimeFrame. You can use it to set up higher timeframe from which Ichimokuis will calculate its values. Other basic parameters are not c
Ichimoku Kinko Hyo is a purpose-built trend trading charting system that has been successfully used in nearly every tradable market. It is unique in many ways, but its primary strength is its use of multiple data points to give the trader a deeper, more comprehensive view into price action. This deeper view, and the fact that Ichimoku is a very visual system, enables the trader to quickly discern and filter "at a glance" the low-probability trading setups from those of higher probability. This i
The Forex trading market operates 24 hours a day but the best trading times are when the major trading sessions are in play. The Sessions Moving Average indicator helps identify Tokyo, London and New York, so you know when one session starts, ends or even overlaps. This indicator also shows how session affects the price movement. Now, you can see the market trend by comparing the price with 3 Average lines or comparing 3 Average lines together.
CCI Trend
Hoang Ngoc Thach
The commodity channel index (CCI) is an oscillator originally introduced by Donald Lambert in an article published in the October 1980 issue of Commodities magazine (now known as Futures magazine). Since its introduction, the indicator has grown in popularity and is now a very common tool for traders in identifying cyclical trends not only in commodities, but also equities and currencies. The CCI can be adjusted to the timeframe of the market traded on by changing the averaging period. This indi
This is HTF (or MTF) of original Kolier SuperTrend indicator. On this version, you can use 4 Lines of supertrend to define the trend, it will be more powerful. Remade signals on smalls timeframes, the indicator will not repaint if used on small timeframes.
필터:
리뷰 없음
리뷰 답변