Volatility Adaptive MA
- 지표
- 버전: 1.0
- 활성화: 5

# Volatility Adaptive MA - Variable speed moving average
*Category: Trend | Difficulty: intermediate | Window: chart window (overlaid on price) | Markets: Universal (Forex, indices, commodities, crypto, stocks) | Suggested timeframes: M5, M15, M30, H1, H4*
## Short description
> A moving average whose smoothing factor is driven by the ratio between short and long term volatility: it accelerates during breakouts and slows down in compressed phases, cutting false crossovers.
### Overview
Every moving average imposes a fixed trade-off between responsiveness and stability: a short period chases noise, a long period arrives late. Volatility Adaptive MA dissolves the trade-off by letting the market choose. The indicator compares short term ATR with long term ATR: when the ratio rises above one the market is moving more than usual, typically a breakout, and the average shifts towards the fast behaviour set in InpFastPeriod. When the ratio falls below one the market is compressing, almost always a range, and the average drifts towards the slow behaviour of InpSlowPeriod. There is no abrupt switching: the coefficient is interpolated continuously, so the line stays smooth.
### How the calculation works
1. The True Range is computed once per bar and reused by both volatility averages, avoiding duplicated work.
2. From it two simple moving average ATRs are derived, one over InpAtrFast bars and one over InpAtrSlow bars.
3. The ratio between the two is mapped onto a zero to one range, saturated between half and twice the normal volatility.
4. That value interpolates the exponential coefficient between the one equivalent to InpSlowPeriod and the one equivalent to InpFastPeriod.
5. The average is updated recursively from the previous bar value, which is already final, so recalculation never alters history.
6. The line colour follows its slope, with a flatness threshold expressed in ATR so that insignificant wobbles are not coloured.
### How to use it
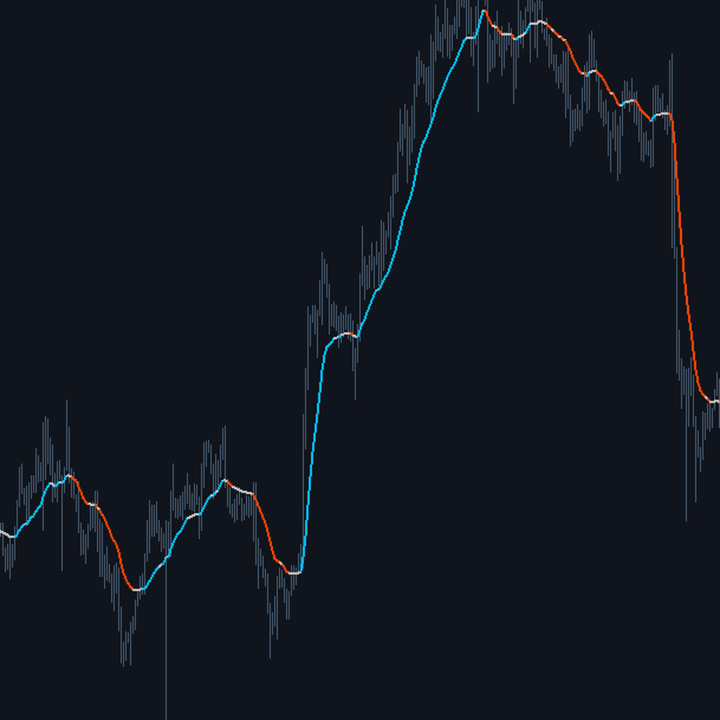
- Use it as a baseline: price above the line with a blue line for a long context, price below with an orange line for a short context.
- The grey stretch signals slope below threshold: in that phase price to average crossovers carry no statistical value.
- It can replace a slow average as a dynamic trailing stop, exploiting the fact that it moves closer to price exactly when the move accelerates.
- Running two of them with different InpFastPeriod values produces a two speed system whose crossover is far rarer and more reliable than the classic one.
- Do not use it alone on markets with chronically low volatility: the average would sit in slow mode nearly all the time.
### Who it is for and on which timeframes
It suits the intraday and swing trader who already works with moving averages and knows their limits in transition phases. It performs best on timeframes between M15 and H4, where volatility compression and expansion cycles are clearly visible. On D1 and weekly it still works but the edge over a classic EMA narrows, because compression phases last too long. It is recommended to traders building their own systems and looking for a solid baseline to use as a filter inside more complex logic.
### Practical example of reading a signal
On US500 M15 the market spends the morning in a tight range: short ATR stays below long ATR, the average behaves like a 60 period EMA and remains practically flat and grey, ignoring dozens of micro crossovers. At the US open volatility doubles within three bars: the ratio rises above two, the average effectively switches to 8 period behaviour, turns up and goes blue as price breaks away. A trader waiting for the colour avoided a whole morning of false signals and received the long context exactly when the move became real.
## Input parameters
| Parameter | Default | Description |
|---|---|---|
| `InpFastPeriod` | 8 | Equivalent period when volatility is in full expansion. Values below 5 make the average very nervous during breakouts. |
| `InpSlowPeriod` | 60 | Equivalent period in compressed phase. It must stay clearly above InpFastPeriod for the adaptation to have a visible effect. |
| `InpAtrFast` | 10 | Short term volatility window. It corresponds to how quickly the indicator notices a breakout. |
| `InpAtrSlow` | 60 | Reference volatility window, that is what we consider normal for this instrument. Keeping it wide makes the ratio more stable. |
| `InpFlatFilter` | 0.05 | Minimum slope, expressed as a fraction of ATR per bar, below which the line is drawn grey. Set 0 to always colour it. |
| `InpAppliedPrice` | PRICE_CLOSE | Price the average is computed on. |
## Advantages / strengths
- Removes the fixed lag versus noise trade-off inherent in every constant period average.
- The adaptation is continuous rather than stepwise, so the line shows no artificial discontinuities.
- The flatness filter explicitly flags when the average has no usable direction, information a plain EMA never provides.
- No repaint and a light recursive computation: suitable even for charts with very long histories.
## Limitations and warnings
- An isolated volatility spike, for example a macro news release, can accelerate the average right before an immediate retracement: the adaptation does not tell a breakout from a false one.
- The recursive value depends on the whole loaded history: two charts with very different bar counts show slightly different values across the first few hundred bars.
- On instruments with constant volatility the adaptation becomes irrelevant and the average behaves like any other EMA.
- Like any baseline it follows price, it does not anticipate it: it must not be used as a reversal signal.
**No repaint:** values printed on a closed bar are never modified afterwards.
**Disclaimer.** This product is a technical analysis tool, not an automated trading system, and it offers no profit guarantee whatsoever. Financial markets carry the risk of total loss of the invested capital. Past performance is not indicative of future results. Every signal must be confirmed with your own analysis, a money management plan and prior testing on a demo account. The author is not responsible for trading decisions taken on the basis of this indicator.
## Suggested tags / keywords for MQL5
`moving average`, `adaptive`, `volatility`, `atr`, `baseline`, `trend filter`, `no repaint`, `breakout`