MACD Divergence Detector MT5
- 지표
- 버전: 1.0
- 활성화: 20

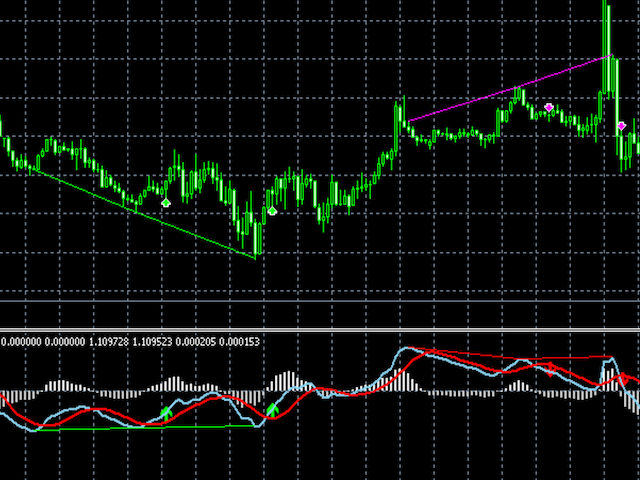
MACD Divergence Detector MT5
- Non-repainting
- Live divergence detection
- Accurate MACD indicator
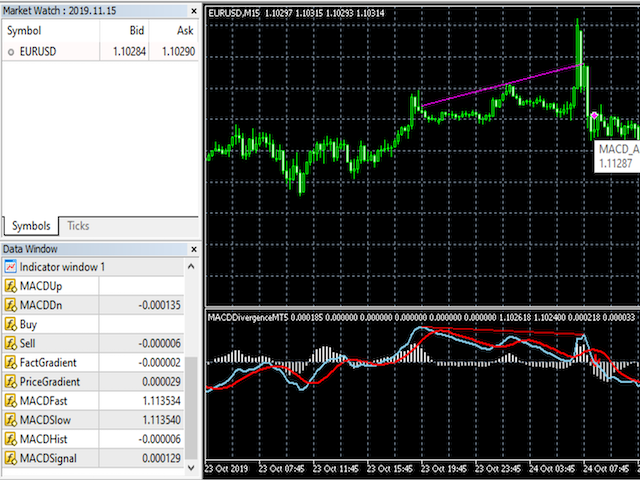
- Includes 10 indicator buffers
- EA friendly
- Includes useful customizable settings
- Decide which buffers to display on the chart and their colors
The MACD Divergence Detector for MT5 is an accurate and useful tool for detecting and displaying MACD divergences and good places to take long and short trades. It includes 10 buffers and customizable settings. This tool does not repaint and can be used in your own EA.