Market Brief Pro Dashboard

CapitalSol Market Brief Pro

CapitalSol Market Brief Pro는 MetaTrader 5 차트에서 직접 작동하는 시장 분석 인디케이터입니다. 추세, 모멘텀, 거래 세션, 가격 구역, 유동성, 일간 변동폭 및 스프레드 정보를 하나의 компакт한 대시보드에 통합합니다.

여러 개의 개별 인디케이터를 동시에 차트에 적용하지 않고도 현재 시장 환경을 구조적으로 파악하고자 하는 트레이더를 위해 설계되었습니다.

Market Brief Pro는 분석 전용 인디케이터입니다. 주문을 개시하거나 종료하지 않으며, 포지션을 관리하지 않습니다.

대시보드 주요 정보

대시보드는 다음 6개의 분석 영역을 표시합니다.

  • Market Bias
  • Trading Session
  • Premium / Discount Zone
  • Liquidity Location
  • Daily Range Status
  • Spread Status

또한 대시보드 하단에는 현재 심볼, 차트 타임프레임 및 MetaTrader 거래 서버 시간이 표시됩니다.

분석 값은 현재 차트 타임프레임에서 새로운 봉이 처리될 때 업데이트됩니다.

Market Bias

Market Bias는 두 개의 지수이동평균과 RSI 모멘텀을 결합합니다.

인디케이터는 다음을 분석합니다.

  • Fast EMA
  • Slow EMA
  • RSI

현재 분류 로직은 다음과 같습니다.

BULLISH

Fast EMA가 Slow EMA 위에 있고 RSI가 55보다 높을 경우.

BEARISH

Fast EMA가 Slow EMA 아래에 있고 RSI가 45보다 낮을 경우.

NEUTRAL

그 외의 모든 조건.

EMA와 RSI 기간은 인디케이터 입력값에서 조정할 수 있습니다.

Market Bias는 현재 추세와 모멘텀의 관계를 간결하게 보여주기 위한 지표이며, 독립적인 진입 신호가 아닙니다.

거래 세션

Session 영역은 설정된 런던 및 뉴욕 거래 세션이 현재 활성 상태인지 표시합니다.

가능한 상태:

  • LONDON
  • NEW YORK
  • LON + NY
  • CLOSED

모든 세션 계산은 MetaTrader 5 Trade Server Time을 사용합니다.

이는 중요합니다. 거래 서버 시간은 브로커마다 다를 수 있으며 UTC 또는 사용자의 로컬 컴퓨터 시간과 일치하지 않을 수 있습니다.

따라서 런던 및 뉴욕 세션의 시작과 종료 시간은 사용 중인 브로커의 서버 시간에 맞게 조정할 수 있습니다.

Premium / Discount 구역

Zone 영역은 현재 가격을 이전에 완료된 일봉의 중간값과 비교합니다.

중간값 계산:

Previous D1 High + Previous D1 Low를 2로 나눔.

그 후 대시보드는 다음 중 하나를 표시합니다.

PREMIUM

현재 종가가 이전 완료 일봉의 중간값보다 위에 있는 경우.

DISCOUNT

현재 종가가 중간값보다 아래에 있는 경우.

EQUILIB

현재 종가가 계산된 중간값과 정확히 일치하는 경우.

이를 통해 현재 가격이 일봉 기준에서 어느 위치에 있는지 간단하게 확인할 수 있습니다.

유동성 위치

Liquidity 영역은 현재 차트 타임프레임의 Swing High와 Swing Low를 분석합니다.

Swing High는 선택한 봉의 고가가 이전 2개 봉과 이후 2개 봉의 고가보다 높을 때 인식됩니다.

Swing Low는 선택한 봉의 저가가 이전 2개 봉과 이후 2개 봉의 저가보다 낮을 때 인식됩니다.

분석할 과거 봉의 수는 Swing Lookback 파라미터로 설정됩니다.

인디케이터는 다음을 찾습니다.

  • 현재 종가 위에 있는 가장 가까운 유효한 Swing High
  • 현재 종가 아래에 있는 가장 가까운 유효한 Swing Low

두 값이 모두 존재할 경우 현재 가격에 더 가까운 기준점이 사용됩니다.

가능한 상태:

ABOVE

가장 가까운 유효한 유동성 기준점이 현재 가격 위에 있는 경우.

BELOW

가장 가까운 유효한 유동성 기준점이 현재 가격 아래에 있는 경우.

NONE

설정된 Swing Lookback 범위 내에서 유효한 Swing 기준점을 찾지 못한 경우.

이 영역은 시장 구조에 대한 참고 정보를 제공합니다. 특정 유동성 레벨이 반드시 도달된다는 의미도 아니며, 가격이 특정 방향으로 움직인다는 의미도 아닙니다.

일간 변동폭

Range 영역은 현재 일간 변동폭을 Average Daily Range와 비교합니다.

ADR은 완료된 일봉 데이터와 설정된 ADR Period를 기준으로 계산됩니다.

기본값 14를 사용할 경우, 이전 14개의 완료된 D1 봉의 평균 High-to-Low 변동폭을 계산합니다.

이후 현재 거래일의 High-to-Low 변동폭이 ADR 대비 백분율로 표시됩니다.

대시보드는 다음 세 가지 분류를 사용합니다.

LOW

현재 일간 변동폭이 ADR의 50% 미만.

NORMAL

현재 일간 변동폭이 ADR의 50% 이상 100% 미만.

EXT

현재 일간 변동폭이 ADR의 100% 이상.

예:

LOW 38%

NORMAL 74%

EXT 125%

EXT 값은 반전이나 추세 지속을 예측하는 값이 아닙니다. 현재 일간 변동폭이 계산된 과거 ADR 기준에 도달했거나 초과했음을 나타낼 뿐입니다.

스프레드 상태

Spread 영역은 현재 Ask-Bid 스프레드를 설정된 Max Spread Pips 값과 비교합니다.

가능한 상태:

OK

계산된 스프레드가 설정값 이하인 경우.

HIGH

계산된 스프레드가 설정값을 초과한 경우.

예:

0.8p OK

2.1p HIGH

Max Spread Pips 파라미터는 스프레드의 시각적 분류에만 영향을 줍니다.

Market Brief Pro는 주문을 실행하지 않기 때문에 이 설정은 거래를 차단하거나 주문 실행에 영향을 주지 않습니다.

대시보드 위치

전체 대시보드는 드롭다운 메뉴를 통해 차트의 네 모서리 중 하나에 배치할 수 있습니다.

사용 가능한 옵션:

  • Top Left
  • Top Right
  • Bottom Left
  • Bottom Right

기본값:

Top Right

선택된 모서리는 대시보드의 기준점 역할을 합니다.

텍스트나 X/Y 좌표를 수동으로 입력할 필요가 없습니다.

Dashboard Scale

Dashboard Scale은 전체 대시보드 크기를 비례적으로 조정합니다.

다음 요소들이 함께 조정됩니다.

  • 전체 너비
  • 전체 높이
  • 글꼴 크기
  • 라벨
  • 값
  • 카드
  • 행과 열
  • 내부 간격
  • Padding
  • 아이콘
  • 테두리
  • 하단 정보 영역

기본값:

1.00

예:

0.70 = 기본 크기의 70%

0.75 = 75%

1.00 = 100%

1.25 = 125%

1.50 = 150%

인디케이터 내부에서 적용되는 유효 최소 스케일은 0.10 입니다.

0.10 보다 작은 값을 입력해도 실제 표시 스케일은 0.10 으로 적용됩니다.

고정된 최대값은 없습니다.

일반적인 차트 환경에서는 약 0.70 에서 1.50 사이가 실용적인 범위입니다. 적절한 값은 차트 크기, 화면 해상도 및 개인적인 레이아웃 선호도에 따라 달라집니다.

입력 파라미터

추세와 모멘텀

Fast EMA

기본값: 50

유형: Integer

Market Bias 계산에 사용되는 빠른 지수이동평균 기간을 정의합니다.

낮은 값은 최근 가격 변화에 더 빠르게 반응합니다.

높은 값은 더 느리고 부드러운 추세 기준을 제공합니다.

예:

20 – 더 민감함

50 – 기본값

100 – 더 느린 반응

인디케이터 자체에서 별도의 최소값이나 최대값을 설정하지 않습니다. 다만 입력값은 MetaTrader의 EMA 계산에서 유효한 값이어야 합니다.

Slow EMA

기본값: 200

유형: Integer

Market Bias의 장기 추세 기준으로 사용되는 느린 지수이동평균 기간을 정의합니다.

예:

100 – 더 빠른 장기 기준

200 – 기본값

300 – 더 느린 장기 기준

Fast EMA와 Slow EMA의 관계는 방향성 평가의 일부로 사용됩니다.

RSI Period

기본값: 14

유형: Integer

Market Bias에 사용되는 Relative Strength Index의 계산 기간을 정의합니다.

낮은 값은 단기 모멘텀 변화에 더 민감하게 반응합니다.

높은 값은 보다 부드러운 모멘텀 값을 제공합니다.

예:

7 – 더 민감함

14 – 기본값

21 – 더 부드러움

Market Bias 로직은 고정 RSI 기준값 55와 45를 사용합니다.

시장 구조 및 변동폭

Swing Lookback

기본값: 120

유형: Integer

유효한 Swing High와 Swing Low를 찾을 때 분석할 과거 봉의 수를 정의합니다.

이 값은 현재 차트 타임프레임의 봉 수를 의미합니다.

낮은 값은 보다 최근의 시장 구조에 집중합니다.

높은 값은 더 넓은 과거 구간을 분석합니다.

예:

50 – 짧은 구조 Lookback

120 – 기본값

200 – 더 넓은 구조 Lookback

ADR Period

기본값: 14

유형: Integer

Average Daily Range 계산에 사용할 이전 완료 일봉의 수를 정의합니다.

예:

5 – 단기 ADR 기준

14 – 기본값

20 – 더 넓은 ADR 평균

ADR은 인디케이터가 어떤 타임프레임에서 사용되더라도 항상 D1 데이터를 기준으로 계산됩니다.

스프레드

Max Spread Pips

기본값: 1.5

유형: Decimal

대시보드의 시각적 스프레드 분류에 사용할 최대 기준값을 정의합니다.

예:

0.8 – 더 엄격한 기준

1.5 – 기본값

2.0 – 더 여유로운 기준

스프레드가 설정값 이하일 경우 OK로 표시됩니다.

설정값을 초과하면 HIGH로 표시됩니다.

이 파라미터는 주문 실행에 영향을 주지 않습니다.

대시보드

Dashboard Position

기본값: Top Right

유형: Dropdown

사용 가능한 값:

  • Top Left
  • Top Right
  • Bottom Left
  • Bottom Right

대시보드를 차트의 어느 모서리에 고정할지 정의합니다.

Dashboard Scale

기본값: 1.00

유형: Decimal

전체 대시보드의 크기를 비례적으로 조정합니다.

일반적인 예:

0.70 – 70%

0.75 – 75%

1.00 – 기본 크기

1.25 – 125%

1.50 – 150%

유효 최소값:

0.10

고정된 최대값은 없습니다.

거래 세션

모든 세션 입력값은 MetaTrader Trade Server Time을 사용합니다.

London Start

기본값: 8

유형: Integer / 시간

설정된 런던 세션의 시작 시간을 정의합니다.

8 은 거래 서버 시간 기준 08:00을 의미합니다.

London End

기본값: 17

유형: Integer / 시간

설정된 런던 세션의 종료 시간을 정의합니다.

17 은 거래 서버 시간 기준 17:00을 의미합니다.

종료 시간 자체는 세션에 포함되지 않습니다.

기본 설정:

08:00 <= London Session < 17:00

NY Start

기본값: 13

유형: Integer / 시간

설정된 뉴욕 세션의 시작 시간을 정의합니다.

13 은 거래 서버 시간 기준 13:00을 의미합니다.

NY End

기본값: 22

유형: Integer / 시간

설정된 뉴욕 세션의 종료 시간을 정의합니다.

22 는 거래 서버 시간 기준 22:00을 의미합니다.

종료 시간 자체는 세션에 포함되지 않습니다.

기본 설정:

13:00 <= New York Session < 22:00

기본 파라미터 요약

Fast EMA: 50

Slow EMA: 200

RSI Period: 14

Swing Lookback: 120

ADR Period: 14

Max Spread Pips: 1.5

Dashboard Position: Top Right

Dashboard Scale: 1.00

London Start: 8

London End: 17

NY Start: 13

NY End: 22

차트 및 데이터 요구사항

Market Brief Pro는 MetaTrader 5의 메인 차트 창에서 작동합니다.

인디케이터는 다음 데이터를 사용합니다.

  • 현재 차트 심볼
  • 현재 차트 타임프레임
  • High, Low, Close 데이터
  • 과거 D1 데이터
  • 현재 Bid 및 Ask 가격
  • MetaTrader Trade Server Time
  • EMA 계산
  • RSI 계산

선택한 EMA, Swing Lookback, ADR 설정에 맞는 충분한 과거 데이터가 필요합니다.

예를 들어 Slow EMA나 Swing Lookback 값을 크게 늘릴 경우, 대시보드의 모든 계산이 정상적으로 표시되기 전에 추가 과거 데이터가 필요할 수 있습니다.

다양한 타임프레임에서의 사용

Market Brief Pro는 적용된 차트의 타임프레임을 자동으로 사용합니다.

추세, 모멘텀, 유동성 계산은 현재 차트 타임프레임을 사용합니다.

ADR과 Premium / Discount 계산에는 추가로 D1 데이터가 사용됩니다.

따라서 차트 타임프레임을 변경하면 타임프레임에 의존하는 분석 컨텍스트도 함께 변경됩니다.

대시보드 하단에는 현재 심볼, 타임프레임 및 거래 서버 시간이 표시됩니다.

일반적인 사용 방법

분석하려는 차트에 Market Brief Pro를 추가합니다.

원하는 Dashboard Position과 Dashboard Scale을 선택합니다.

설정된 런던 및 뉴욕 시간이 사용 중인 브로커의 Trade Server Time과 일치하는지 확인합니다.

필요한 경우 자신의 분석 방식에 맞게 파라미터를 조정합니다.

그 후 대시보드는 다음 정보를 간결하게 제공합니다.

  • 시장 방향성 Bias
  • 현재 활성 거래 세션
  • 일봉 기준 Premium / Discount 위치
  • Swing 유동성 구조 컨텍스트
  • ADR 대비 현재 일간 변동폭
  • 현재 스프레드 상태

각 항목은 시장 상황에 대한 참고 정보로 해석해야 하며, 독립적인 진입 또는 청산 신호로 사용해서는 안 됩니다.

중요 정보

CapitalSol Market Brief Pro는 시장 분석 및 의사결정 지원을 위한 인디케이터입니다.

다음 기능을 수행하지 않습니다.

  • 주문 개시
  • 주문 종료
  • 포지션 변경
  • Stop Loss 설정
  • Take Profit 설정
  • 포지션 크기 관리
  • 거래 신호 자동 실행
  • 시장 방향 보장
  • 거래 결과 보장

표시되는 값은 위에 설명된 계산 규칙에 따라 과거 및 현재 시장 데이터를 기반으로 생성됩니다.

시장 환경은 언제든지 변할 수 있습니다. 따라서 이 인디케이터는 독립적인 시장 분석 및 리스크 관리 프로세스의 일부로 사용해야 합니다.


추천 제품
New to Binary Options Trading? You are not able to win while trading binary options? Need help with your trading? You have come to the right place! This indicator provides Put (SELL) and Call (BUY) signals for binary options on the M1-M15 timeframes. Advantages Ability to easily recognize impulsive moves. Effective and flexible combination to different trading strategies. Advanced statistics calculation following the entry point. Signals strictly on the close of a bar. Works in all symbols and
The ultimate signal filter. Get clear, non-repainting arrows only when the trend on M1, M5, M15, and H1 timeframes are fully aligned, confirming strong momentum for scalping or short-term trades. Full Product Description Non-Repainting Arrows: Built using precise closing price data ( rates_total - 1 and iBarShift ), ensuring signals are final and never shift or disappear after the bar closes. What you see is what you get. High-Confidence Signals: Filters out noise by requiring agreement acros
TCT COMPLETE BUNDLE - All 7 Panels COMPLETE COMBO WITH ALL INDICATORS Get all 7 TCT panels at a special price and have every trend analysis tool right at your fingertips! PACKAGE INCLUDES TCT ADX PANEL (Direction & Strength) TCT RSI PANEL (Overbought/Oversold) TCT CCI PANEL (Channels & Breakouts) TCT MACD PANEL (Momentum) TCT MA PANEL (Moving Average) TCT SAR PANEL (Parabolic Stop) TC
JAJ Binary Pro
Jamaine C Walkin
JAJ Binary Pro is a precision-driven binary options strategy created by Jamaine Walkin , a full-time trader and investor. Designed for adaptability in Forex and OTC markets , it focuses on high-probability trade setups and disciplined risk management. Optimised for Pocket Option & MT5 , it reflects Jamaine’s structured approach to trading Options, ensuring consistency and confidence in execution. Always use Proper Risk Management when trading.
LKLK Smart Panel
Karel Salotti Bastos
LKLK Smart Panel — The Professional One-Click Trading Panel for Manual Scalpers Take full control of your discretionary trading with a fast, elegant, and fully customizable control panel built directly on your chart. LKLK Smart Panel was designed for traders who execute manually and need speed, clarity, and real-time performance feedback — without ever leaving the chart. WHY LKLK SMART PANEL? Manual scalping and discretionary trading demand split-second execution. Switching between menus, ty
FREE
ARCS Signal
Kriangkrai Pongtiwat
4 (1)
ARCS Signal v3.0: Adaptive Regime Confluence Signal ARCS Signal v3.0 is a professional-grade, non-repaint indicator for MetaTrader 5 that uses an Adaptive Regime Detection engine . By calculating the Hurst Exponent , the indicator identifies whether the market is currently Trending or Mean-Reverting , adjusting its entry logic automatically to match the environment Key Technical Features Multi-Layer Confluence: Signals are generated only when 4 core modules align: Hurst Regime, Fisher RSI, KAMA
FREE
Signals Supply and Demand Force
Claudio Angelo Chumpitaz Flores
Este Indicador esta basado en el rebote de un soporte o resistencia fuerte con un indicador que tiene interno de fuerza de movimiento. Tiene la opción de ver el soporte y resistencia actual y ver la fuerza que tiene dicho soporte o resistencia.(Activando el parámetro Ver_Sop_Res ) Parámetros: Sop o Res, Fuerza Mayor a...: Con este parámetro podrás ajustar la fuerza del soporte o resistencia, con la cual el indicador evaluara si es una señal bajista o alcista. Velas Historial: Con este parámetro
SlamBam Signal
Coenraad Hermanus Strachan
Title SlamBam Signal — Non-Repainting Trend & Market Regime Filter (MT5) Tagline Signals that tell you when to trade — and when not to. Short Description A professional, non-repainting trend and market regime filter for MetaTrader 5, designed to provide stable signals, clean alerts, and deterministic market context for manual traders and EAs. Full Description SlamBam Signal is a commercial-grade trend and market regime indicator for MetaTrader 5. It is designed to help traders and autom
Kihafy FVG pro
Mandimbisoa Rasoloarimanana
MQL5 PREMIUM INDICATOR KIHAFY FVG PRO v7.0 Smart Money Fair Value Gap Scanner — ICT Concepts FVG AUTO DETECT 100 MAX SCORE A–D GRADE SYSTEM 3× CONFLUENCES OVERVIEW Most traders miss Fair Value Gaps because they appear and disappear too fast. KIHAFY FVG PRO catches every single one — scores it, grades it A through D, tracks its mitigation in real time, and alerts you instantly when price enters the zone. This is the FVG scanner built the way ICT traders ac
FREE
FabFlowInPrice
Fabiano Luiz Roberto
Tape Reading, flow monitoring. FabFlowInPrice   is a powerful indicator for those who like Tape Reading (Times & Trades). It presents the volumes traded at each price level, considering the purchase, sale and direct aggressions for each level. Excellent tool for market flow analysis. Thought of flow so monitor who is attacking the most, buyers, sellers or direct exchanges, thought FabFlowInPrice. The indicator displays information in 4 distinct and fixed periods, on any timeframe: @Day - All t
Water Mark Pro MT5
Robby Suhendrawan
TradingView 스타일 차트 워터마크 (TradingView Style Chart Watermark) MetaTrader 5 차트를 TradingView처럼 우아하고 전문적인 모습으로 변환하세요. MetaTrader의 기본적이고 밋밋한 모습에 지치셨나요? WaterMark MT5는 세련되고 현대적인 워터마크를 거래 터미널에 직접 추가하여 차트 작성 경험을 향상시키도록 설계된 가볍고 완전히 사용자 지정 가능한 지표입니다. 이 지표는 표준 MetaTrader 차트와 프리미엄 웹 기반 차트 플랫폼 간의 시각적 격차를 해소합니다. 현재 거래 쌍과 시간대를 차트에 동적으로 표시할 수 있으며, 완전히 사용자 지정 가능한 두 개의 텍스트 라벨을 추가할 수 있습니다. 현대적인 차트 도구의 깔끔한 미학과 ICT 개념에서 영감을 받은 이 지표는 시각적으로 더욱 매력적인 작업 공간을 원하는 트레이더에게 완벽합니다. 기술 분석을 공유하는 트레이딩 멘토이든, 셋업을 일지화하는 프프 펌(prop fir
FREE
Advanced Trend Matrix TDI Suite
Itumeleng Mohlouwa Kgotso Tladi
Advanced Trend Matrix TDI Suite Advanced Trend Matrix TDI Suite is a professional dual-engine analytical indicator for MetaTrader 5 that unites top-down Multi-Timeframe (MTF) Trend & Strength Analysis on the main price chart with the classic Traders Dynamic Index (TDI) volatility and momentum engine in a dedicated subwindow. Instead of switching between five different chart timeframes to verify trend alignment, traders get an instant, real-time institutional read on market bias, momentum streng
Binary Options Assistant (BOA) BOIL Signals Indicator provides signals based on Ana Trader Binary Options Strategy. Indicators: Stochastic Stop missing trades, stop jumping from chart to chart looking for trade set-ups and get all the signals on 1 chart! U se any of the BOA Signals Indicator with the  Binary Options Assistant (BOA) Multi Currency Dashboard .  All BOA Signal Indicator settings are adjustable to give you more strategy combinations. The signals can be seen visually and heard audi
ForexM
Marius Civilis
ForexM 완전 자동 거래 EA ForexM EA는 전문적인 실시간 시장 분석에 따라 주식을 거래합니다. 주문한 모든 주문은 시장 실행 유형이며 시장 분석가의 실시간 작업으로 인해 가중치가 잘 적용됩니다. EA는 최고 등급의 초기 설정과 함께 제공되며 바로 사용할 수 있습니다. 특징: - 완전 자동화된 거래. - 위기 관리. - 여러 악기에서 동시에 작동합니다. - DLL 없음 - VPS(클라우드 기반 거래)가 완벽하게 지원됩니다. - 모든 브로커. - 보증금. - 24/5 거래. - 지원 및 사용 권장 사항. - 업데이트. 중요한: - 가격(428USD)은 1년 라이선스 기준입니다. 32USD/월 요금은 사용 첫 해 이후에 적용됩니다. - 요청 시 MT4 버전. - 선착순 10명의 구매자 가격 - 99EUR. 쿠폰 코드 사용 - FRXMF10 직접 결제 링크: https://buy.stripe.com/9AQ8Ab5WUdaIdeU144
Fractal Market Structure CHoCH BOS MT5 Fractal Market Structure CHoCH BOS MT5 is a price-action indicator designed to identify market structure through confirmed fractal formations. Instead of relying only on traditional swing-point calculations, the indicator analyzes structured candle patterns to locate important highs and lows, detect changes in directional behavior, and display relevant market structure events directly on the chart. The indicator can identify bullish and bearish Break of Str
Market Sessions Clock is a small panel that shows, at a glance, which markets are open right now and when the next one opens or closes. How it works - Four sessions: Sydney, Tokyo, London and New York. Each has its own on/off switch and hours. - Hours are entered in each market's local time (for example 08:00-17:00 London), and daylight saving is applied automatically for Sydney, London and New York. - For every session the panel shows Open or Closed, the time left until it closes or until it n
FREE
Like this indicator? Get the fully automated Expert Advisor version here:  HalfTrend AutoTrader Pro HalfTrend trendline with ATR pullback zones — built for trend traders. Spot the trend direction instantly, use ATR bands to judge “normal” pullbacks vs extended moves, and get alerts on trend flips and optional trendline touches .  HalfTrend ATR Bands & Alerts (MT5) is a trend-following indicator that plots a clean HalfTrend trendline together with ATR-based bands/zones . It provides trend chan
FREE
UTBot Alerts
Ulises Calderon Bautista
4.75 (4)
UT Bot Alerts — ATR 트레일링 스탑 시스템 TradingView의 전설적인 지표 「UT Bot Alerts」(QuantNomad 개발)를 MQL5 및 MQL4로 완벽 이식. 원래 개념은 HPotter, 초기 구현은 Yo_adriiiiaan, Pine Script v4 알림 버전은 QuantNomad(Vadim Cissa)가 개발했습니다. QuantNomad는 TradingView에서 10만 명 이상의 팔로워를 보유한 대표적인 퀀트 개발자입니다. 원본 스크립트는 TradingView에서 110만 회 이상 조회, 35,500회 이상 즐겨찾기 를 기록하여 역대 가장 인기 있는 오픈소스 트레이딩 지표 중 하나입니다. 이 이식 버전은 원본 알고리즘을 100% 논리적 충실도 로 재현합니다: 동일한 4분기 재귀적 트레일링 스탑 로직, 동일한 크로스오버 감지, 동일한 시그널 생성. 확정된 봉에서 리페인팅하지 않습니다. UT Bot Alerts란? UT Bot Alerts는 추세추종
FREE
STRUCTUREMAP NAVIGATOR MT5 Multi-Timeframe Market Structure Dashboard TAGLINE Read the market like a structure trader. PRODUCT OVERVIEW StructureMap Navigator MT5 is a multi-timeframe market-structure indicator for MetaTrader 5. It is designed to help traders understand how price is behaving through swing points and structure events rather than relying only on traditional buy/sell arrows. The indicator analyzes recent swing highs and swing lows, classifies them as HH, HL, LH, or LL, and th
FREE
Time Box Indicator MT5
Young Ho Seo
4.75 (4)
Introduction To Time Box Indicator Time Box Indicator is a must have indicator for any trader. It will display daily, weekly and Monthly box according to your preferences. Yet, you can extend any important price levels in your chart automatically. You can use them as the significant support and resistance levels. It is very simple but effective tool for your trading. Graphic Setting Use White Chart Line Style for Current Open price Daily Setting Update Timeframe for daily box Number of days to
FREE
Click2FiboDrawer – Instantly Draw Fibonacci Retracement Lines with 2 Clicks Click2FiboDrawer is a powerful manual drawing tool for discretionary traders who use Fibonacci retracements in their technical analysis. With just two mouse clicks, you can draw clean and precise Fibonacci levels directly on your chart — no clutter, no menus, no hassle. Even during fast-paced scalping sessions, this tool enables you to quickly add Fibonacci retracement levels and react to market moves in real-time. It’s
FREE
Weis Waves RSJ
JETINVEST
4.64 (11)
Weis Waves RSJ는 각 가격 파동의 거래량을 합산하여, 번갈아 나타나는 상승 및 하락 파동의 누적 거래량을 히스토그램으로 표시합니다. 이를 통해 각 파동의 노력(거래량)과 결과(가격 진행)를 비교하고, 움직임이 거래량의 뒷받침을 받는지 아니면 힘을 잃고 있는지 확인할 수 있습니다. 읽는 방법 히스토그램의 각 막대는 하나의 가격 파동 동안 거래된 총 거래량입니다. 추세가 건전할 때는 보통 추세 방향의 파동이 조정 파동보다 더 많은 거래량을 보입니다. 가격이 새로운 고점이나 저점을 만들었지만 파동의 거래량이 이전 파동보다 작다면, 노력이 같은 결과를 만들어 내지 못하고 있다는 뜻이며 움직임이 힘을 잃고 있다는 경고일 수 있습니다. 이 지표는 별도 창에 표시되며, 틱 거래량 또는 실거래량을 제공하는 모든 종목과 타임프레임에서 작동합니다. 문의 사항이 있으시면 다이렉트 메시지를 보내 주세요: https://www.mql5.com/en/users/robsjunqueira/
FREE
Master Weis
Leonel Alberto Jose Quintana
MetaTrader 5용 Master Waves 설명 Master Waves는 가격 움직임에 따라 거래량을 파동 형태로 구성하는 MetaTrader 5용 기술적 분석 지표입니다. 이 지표는 각 캔들의 방향을 분석하고 가격 움직임이 같은 방향으로 유지되는 동안 거래량을 누적합니다. 방향이 변경되면 새로운 파동이 시작됩니다. 파동은 별도의 지표 창에 히스토그램으로 표시됩니다. 상승 방향과 하락 방향의 파동은 서로 다른 색상으로 표시되어 시각적으로 쉽게 구분할 수 있습니다. 파동 분석 현재 파동의 거래량은 이전 파동의 평균 거래량과 비교됩니다. 이 비교를 통해 분석된 가격 기록에서 각 움직임의 상대적인 강도를 확인할 수 있습니다. 지표는 사용 가능한 Tick Volume을 사용합니다. 필요한 경우 상품에서 제공되는 Volume을 대신 사용합니다. Score 및 State Master Waves는 현재 파동 거래량과 이전 파동 평균값의 관계를 기준으로 마이너스 100에서 플러스 100 사이
FREE
PositionMap Pro — Account Overview Panel for MT5 A real-time panel that groups all open positions by symbol and shows Buy lots, Sell lots and net profit/loss directly on your chart — the whole account at a glance. Instead of counting lots symbol by symbol in the Terminal tab, PositionMap Pro groups everything automatically. You instantly see how much exposure you have on each symbol, split by direction. Panel example Symbol Buy Lot Sell Lot Net P/L EURUSD 0.50 — +12.30 XAUUSD — 1.00 −45.00 GBPUS
FREE
High Trend Lite MT5
Evgeniy Scherbina
5 (1)
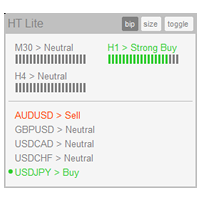
The indicator High Trend Lite monitors 5 symbols in up to 3 timeframes simultaneously and calculates the strength of their signals. The indicator notifies you when a signal is the same in different timeframes. The indicator can do this from just one chart. Therefore, High Trend Lite is a multicurrency and multitimeframe indicator. With the High Trend Pro , available at this link , you will have an unlimited number of symbols, 4 timeframes, a colourful chart of the primary MACD indicator, several
FREE
Fibo Autopilot
Florent Moreau
Fibo Autopilot — automatic Fibonacci retracement Fibo Autopilot detects swings on a timeframe you choose and draws the Fibonacci retracement for you - no manual anchoring, no re-dragging the tool every time price makes a new high or low. It follows the live extremum tick by tick and rebuilds itself once price retraces past the 61.8% level, so it stays in sync with the current move without you touching the chart. How it works The indicator scans 5-candle fractals on the timeframe you select to fi
FREE
Risk5Percent is a custom indicator for MetaTrader 5 designed to help you manage your risk exposure precisely. By entering the desired risk percentage and the number of lots used, it calculates and displays the corresponding price level on the chart that represents your maximum anticipated loss (e.g., 5%), automatically considering contract and tick size for the selected instrument. Key Features: Custom settings for trade direction (long/short), risk percentage, and lot size. Automatic adjus
FREE
EchoIndicatorMT5
Phongkrit Phattanawijak
ECHO INDICATOR V2.2 Update A top-quality indicator works with trend and pattern.  The tool is a good assistant for the traders use various levels in trading. When price approaches a level, the indicator produces a sound alert and (or) notifies in a pop-up message, or via push notifications. A great decision making tool for opening orders. Can be used any timeframe and can be customized Easy to trade It implements alerts of all kinds It implements a multi-timeframe   Trade with Trend  + signa
DeMarker Advanced Indicator for MetaTrader 5 The DeMarker (DeM) indicator, created by legendary trader Tom DeMark, is a powerful oscillator designed to measure the demand for an asset by comparing recent price highs and lows. It excels at identifying potential trend exhaustion and imminent market turning points. The DeMarker Advanced Indicator for MetaTrader 5 takes this classic tool and supercharges it. While the standard DeM indicator is often difficult to read due to erratic movements, thi
FREE
이 제품의 구매자들이 또한 구매함
Trend Sniper X
Sarvarbek Abduvoxobov
4.86 (44)
Trend Sniper X 는 트레이더가 추세 방향과 잠재적 반전 지점을 명확하고 정확하게 포착할 수 있도록 도와주는 MetaTrader 5용 멀티 타임프레임 추세 추종 지표입니다. MT4용: https://www.mql5.com/en/market/product/193245 가격 정보: 현재 가격은 프로모션 할인가이며, 향후 업데이트 및 새로운 기능이 출시됨에 따라 변동될 수 있습니다. 보너스 혜택: 본 지표 전용 무료 자동매매 Assistant EA를 받으시려면 구매 후 작성자에게 메시지를 보내주시기 바랍니다. Code2Profit 채널 멀티 타임프레임 분석으로 시장을 마스터하세요! Trend Sniper X로 승률을 극대화하는 방법: 핵심 규칙 및 세션 팁 기술 사양 플랫폼 MetaTrader 5 지표 유형 멀티 타임프레임 추세 지표 운용 타임프레임 모든 차트 타임프레임 지원, 독립적으로 선택 가능한 상위 타임프레임(M1–MN1) 주요 상품 외환, 금(XAUUSD) 및 기타 C
Entry Points Pro for MT5
Yury Orlov
4.52 (153)
Entry Points Pro는 주문을 넣기 전에 어디에서 진입하고, 스탑을 어디에 두고, 어떤 랏으로 거래할지 보여 줍니다. 가격 지금 199 USD이며, 이 가격으로는 8카피입니다. 이후 가격은 249 USD, 최종 가격은 349 USD입니다. 저는 시장에서 트레이딩으로 돈을 벌고 그것을 보여 드립니다. 그래서 이 인디케이터를 모두에게 팔 필요가 없습니다. 스스로 생각하는 트레이더를 위한 도구이지, 마법 버튼이 아닙니다. 돌파가 없으면 거래도 없습니다. 회색 화살표는 취소된 신호입니다. 가격이 신호 캔들을 돌파하지 못했으므로 진입도 손실도 없습니다. 화살표는 캔들이 마감될 때 나타나며 리페인팅되지 않습니다. 설정은 두 가지: 예치금과 거래당 리스크. 결제 전에 확인하세요: 무료 데모는 MT5 전략 테스터에서 작동하며 2분이면 됩니다. 구매 후에는 제가 직접 설정을 도와 드리겠습니다. 2019년, 저는 이 지표가 무엇을 할 수 있는지 전 세계에 보여 주었습니다. 실계좌에서 지표의
Ultra Indicator
Ihor Otkydach
5 (1)
ULTRA는 “올인원” 방식으로 작동하는 기술적 지표로, 시장을 독자적으로 분석하고, 매매 신호를 생성하며, 손절매 주문 설정 수준을 표시하고, 이익을 실현하거나 손실을 최소화하기 위해 포지션을 청산해야 할 시점을 제안합니다. 다시 말해, 시장을 분석하는 법을 모르거나, 가격 수준(손절매를 어디에 설정할지)을 파악하지 못하거나, 자금 관리에 어려움을 겪더라도 상관없습니다. ULTRA가 그 모든 것을 대신 해줄 테니까요! 구매자 특전 : ULTRA 지표를 구매하신 후, 저에게 비공개 메시지를 보내주시면 “ULTRA BOT”을 무료 선물로 드립니다. 이 도구는 해당 지표의 신호를 바탕으로 개설한 거래를 관리하는 데 도움을 주는 특별한 도구입니다(각 거래에 대해 손절매를 설정하고, 최상의 결과를 얻을 수 있도록 전략의 규칙에 따라 거래를 자동으로 청산해 줍니다).  또한 구매자분들께 다양한 자산에 바로 적용할 수 있는 설정값을 제공해 드리고 있으며, 이를 통해 지표가 최대 효율로 작동할
Gann Made Easy MT5
Oleg Rodin
5 (13)
Gann Made Easy 는 mr.의 이론을 사용하여 최고의 거래 원칙을 기반으로 하는 전문적이고 사용하기 쉬운 Forex 거래 시스템입니다. W.D. 간. 이 표시기는 Stop Loss 및 Take Profit Levels를 포함하여 정확한 BUY 및 SELL 신호를 제공합니다. PUSH 알림을 사용하여 이동 중에도 거래할 수 있습니다. 구매 후 거래 방법 안내 및 유용한 추가 지표를 무료로 받으시려면 저에게 연락주세요! 아마도 Gann 거래 방법에 대해 이미 여러 번 들었을 것입니다. 일반적으로 Gann의 이론은 초보자 거래자뿐만 아니라 이미 거래 경험이 있는 사람들에게도 매우 복잡한 것입니다. Gann의 거래 방식은 이론적으로 적용하기 쉽지 않기 때문입니다. 나는 그 지식을 연마하고 Forex 지표에 최고의 원칙을 적용하기 위해 몇 년을 보냈습니다. 표시기는 적용하기가 매우 쉽습니다. 차트에 첨부하고 간단한 거래 권장 사항을 따르기만 하면 됩니다. 지표는 지속적으로 시장 분석
Boba Analysis Suite
Trade Ready Solutions LLC
5 (2)
Boba Analysis Suite Boba Analysis Suite는 MetaTrader 5용 분석 지표입니다. 시장 구조, 주요 가격 영역, 전반적인 시장 상황을 하나의 차트 화면에 통합하여 표시합니다. 트레이더이자 트레이딩 코치로서의 실무 경험을 바탕으로 개발되었으며, 시장 방향 평가, 주요 가격 수준 식별, 여러 시간대의 종합적인 분석 등 체계적인 분석 과정을 지원합니다. 시장 맥락을 고려한 분석 개별 신호의 의미는 시장 상황에 따라 달라집니다. Boba Analysis Suite는 현재 차트 상황을 더 넓은 시장 구조와 연결하고, 사전에 정한 규칙에 따라 매매 아이디어를 검토할 수 있도록 돕습니다. 주요 분석 기능은 다음과 같습니다. 추세 및 시장 구조: 시장 방향과 관련 구조적 맥락을 평가합니다. 주요 가격 영역 및 수준: 추가 분석이 필요한 중요한 영역을 차트에 시각적으로 표시합니다. 여러 시간대: 서로 다른 시간대의 정보를 통합하여 전반적인 시장 상황을 평가합니다.
M1 Sniper MT5
Oleg Rodin
5 (7)
M1 SNIPER 는 사용하기 쉬운 거래 지표 시스템입니다. M1 시간대에 맞춰 설계된 화살표 지표입니다. 이 지표는 M1 시간대 스캘핑을 위한 단독 시스템으로 사용할 수 있으며, 기존 거래 시스템의 일부로도 사용할 수 있습니다. 이 거래 시스템은 M1 시간대 거래용으로 특별히 설계되었지만, 다른 시간대에도 사용할 수 있습니다. 원래는 XAUUSD와 BTCUSD 거래를 위해 이 방법을 설계했지만, 다른 시장 거래에도 유용하다는 것을 알게 되었습니다. 이 지표의 신호는 추세 방향과 반대로 거래될 수 있습니다. 저는 지표의 신호를 활용하여 양방향으로 거래할 수 있도록 돕는 특별한 거래 기법을 알려드립니다. 이 방법은 특별한 동적 지지선과 저항선 가격 영역을 활용하는 것을 기반으로 합니다. 구매하시면 M1 SNIPER 화살표 지표를 바로 다운로드하실 수 있습니다. 또한, 아래 스크린샷에 표시된 Apollo Dynamic SR 지표는 M1 SNIPER 도구를 사용하는 모든 사용자에게 무료로
FiboSniper Pro
Van Minh Nguyen
5 (4)
FiboSniper Pro – Multi-Filter Fibonacci System with Auto SL/TP and Control Panel FiboSniper Pro는 동적 Fibonacci Envelopes와 여러 확인 필터를 결합하여 선별된 Buy 및 Sell 신호를 생성하는 기술적 지표입니다. Fibonacci 레벨은 Moving Average와 ATR을 기반으로 계산된 후 ADX, EMA, RSI, ATR, Volume, Time 및 Candle 구조를 통해 필터링됩니다. 이 지표는 ATR 기반의 자동 Stop Loss 및 Take Profit 레벨을 차트에 직접 표시하며, 빠른 설정 조정을 위한 인터랙티브 Control Panel을 제공합니다. 구매 후 MQL5 메시지로 저에게 연락하시면 Auto Trader X를 무료로 받으실 수 있으며, 이 지표의 거래 신호를 자동화하는 방법에 대한 안내도 제공됩니다. User Guide 및 Set Files: [Click here
Auto Optimized SpeedAngle 은 지속적인 워크포워드 최적화(Walk-Forward Optimization, WFO)를 통해 곡선 적합(curve-fitting)을 제거한 기관 수준의 모멘텀 벡터화 시스템입니다. 시장 체제가 바뀔 때 성능이 떨어지는 정적 입력에 의존하는 대신, 이 지표는 표본 외(Out-of-Sample, OOS) 검증을 사용하여 매개변수를 동적으로 재보정하며, 표시되는 신호가 과거의 우연이 아닌 진정한 통계적 우위를 나타내도록 보장합니다. 핵심 기관용 프레임워크 워크포워드 최적화 엔진: 핵심 알고리즘은 수천 가지의 룩백(lookback) 및 임계값 조합을 지속적으로 스캔하며, 데이터를 인샘플(in-sample)과 표본 외(out-of-sample) 세트로 엄격하게 분리합니다. 미지의 데이터 환경에서 수학적 우수성이 증명된 경우에만 새로운 매개변수 구성을 채택합니다. 정량적 목적 함수: 순수한 총이익을 쫓는 대신, 최적화 엔진은 기관 수준의 안정성
SQN Max indicator for MT5 by ITC
Renaud Herve Francois Candel
Sqn Max Indicator Sqn Max is an exclusive indicator to trade the market with high effectiveness. The indicator is based on price action, volatility and trend. This indicator is as simple as possible but not too simple. The indicator can generate alerts to ease the trading process. You don't have to stay all day in front of your screen. The indicator can be used with any class of assets and with any time frame. It is possible to achieve better results trading our list of selected assets. We achi
SIO Oscillator
Davit Beridze
SIO Oscillator: 자기 최적화 세미분산 불균형 오실레이터 지표를 구매하시면 이를 기반으로 한 전문가 어드바이저(EA)를 무료로 받으실 수 있습니다. 대부분의 오실레이터는 모든 가격 움직임을 똑같이 취급합니다. SIO는 상승 압력과 하락 압력을 분리하여 둘 사이의 불균형을 측정하고, 매수자와 매도자 중 어느 쪽이 실제로 시장을 주도하고 있는지 보여줍니다. 불균형이 극단에 도달하면 SIO는 진입가, 손절(Stop Loss), 익절(Take Profit) 수준이 포함된 명확한 신호를 표시합니다. SIO의 차별점은 고정된 설정에 의존하지 않는다는 것입니다. 내장된 자기 최적화 엔진이 현재 종목과 시간 프레임에 맞는 파라미터를 지속적으로 탐색하고, 사용하기 전에 검증합니다. 두 가지 신호 모드 평균 회귀(Mean Reversion): 불균형의 극단에서 거래하며 균형으로의 복귀를 노립니다. 추세 추종(Trend Following): 지속적이고 우세한 불균형의 방향으로 거래합니다. 자
Power Candles MT5
Daniel Stein
4.58 (12)
Power Candles V3 - 자체 최적화 강도 지표 파워 캔들 V3는 적용된 모든 차트에서 통화 및 상품의 강세를 실행 가능한 거래 계획으로 전환합니다. 단순히 캔들에 색상을 입히는 대신, 백그라운드에서 실시간 자동 최적화를 수행하여 현재 보고 있는 종목에 대한 최적의 손절매, 익절 및 신호 임계값을 제공합니다. 한 번의 클릭으로 실시간 거래에 적용할 수 있으며, 진입점, 손절매 및 익절 선이 정확한 가격에 맞춰 차트에 표시되고, 방향과 함께 알림이 발령됩니다. 이 도구는 Stein Investments 에코시스템의 일부입니다. 18개 이상의 도구와 함께 당신의 1대1 AI 트레이딩 멘토 Max.  항상 대기 중, 모든 인디케이터를 깊이 있게 이해, 무언가를 차근차근 생각해보고 싶은 순간에 도움을 줍니다.  https://stein.investments 에서 만나보세요 매 종가 바마다 3,000회 이상의 트레이딩 시뮬레이션. 9가지 강도 상태. 2가지 전략을 병렬로 테스트.
Astral Structure
Ottaviano De Cicco
Astral Structure 셋업을 평가하고 초기 계획을 확인하세요. 출시 특별가 - $99. 출시 행사 종료 후 $149. 시장 구조 셋업에는 여러 질문이 따릅니다. 더 넓은 시각에서도 일치하는지, 스톱 기준은 어디인지, 목표는 어떻게 정하는지 살펴봐야 합니다. Astral Structure는 시장 구조를 바탕으로 판단하는 재량 트레이더를 위해 이 질문들을 한 작업 공간에 모아 줍니다. 관련 셋업에 집중하세요. 최근의 적격 셋업과 방향, 조건 충족 여부를 함께 검토하세요. 시간대 간 일치를 확인하세요. 평가 중인 셋업을 놓치지 않고 선택한 시간대의 값을 비교하세요. 초기 계획을 연결해 두세요. 각 요소를 따로 조합하지 않고 해당 셋업에 연결된 스톱 및 목표 기준값을 검토하세요. Structure를 사용하면 최근 조건을 충족한 셋업을 일관된 방식으로 검토할 수 있습니다. 맥락과 초기 가격 계획을 한곳에서 함께 확인하세요. 맥락 속에서 셋업 읽기 최신 BUY 또는 SELL 셋업, 해
Dynamic Forex28 Navigator MT5
Bernhard Schweigert
5 (1)
다중 통화 강도 및 모멘텀 지표 MT5 Dynamic Forex28 Navigator는 오랫동안 사랑받아 온 인기 지표들의 진화형으로, 다섯 가지의 힘을 하나로 결합했습니다. Advanced Currency Strength28 Indicator (리뷰 700개) Advanced Currency IMPULSE with ALERT (리뷰 530개) Currency Strength EXOTICS GOLD Impulse with Alert CS28 Combo Signals (최근 보너스) 지표 네 개를 따로 구매해 차트에 겹쳐 놓을 필요가 없습니다. 28개 Forex 페어의 강도, 이를 이끄는 시장의 모멘텀, 그리고 두 가지 모두의 알림이 하나의 강력한 지표로 통합되어 한 창, 한 차트에서 확인할 수 있습니다. 위 프로그램들은 MQL5 Market에서 1,200개 이상의 리뷰를 받았으며 2016년부터 MT4 커뮤니티의 필수 지표로 자리잡았습니다. Dynamic Forex28 Navigato
Scalper Vault MT5
Oleg Rodin
5 (1)
Scalper Vault는 당일 매매(intraday trading)에서 일관된 성과를 내고자 하는 트레이더를 위해 설계된, 강력하고 모든 기능을 갖춘 트레이딩 시스템입니다. 이 고정밀 지표는 외환(Forex) 및 바이너리 옵션 트레이더 모두에게 기관급 분석을 제공하는 독립적인 종합 트레이딩 시스템 역할을 합니다. 구매 후 저에게 연락해 주시면, 트레이딩 팁과 함께 특별한 보너스를 제공해 드립니다! Scalper Vault는 추측에 의존하거나 복잡한 수동 분석을 할 필요를 없애주며, 사용하기 쉬운 트레이딩 기법을 통해 오직 매매 실행에만 집중할 수 있도록 돕습니다. 정확한 추세 추종 신호: 핵심 알고리즘이 시장 구조를 분석하여, 지배적인 시장 추세 방향과 일치하는 고확률 신호만을 제공함으로써 잘못된 진입을 획기적으로 줄여줍니다. 정밀한 고점 및 저점 탐지: 시장의 움직임이 소진되는 지점을 스캔하여 잠재적인 반전 구간을 식별합니다. 간(Gann) 이론 기반의 매수/매도 구간: 수학적


Azimuth Pro
Ottaviano De Cicco
5 (7)
Azimuth Pro V2: Synthetic Fractal Structure and Confirmed Entries for MT5 Overview Azimuth Pro is a multi-level swing structure indicator by Merkava Labs . Four nested swing layers, swing-anchored VWAP, ABC pattern detection, three-timeframe structural filtering, and closed-bar confirmed entries — one chart, one workflow from micro-swings to macro-cycles. This is not a blind signal product. It is a structure-first workflow for traders who care about location, context, and timing. Halloween P
Neuro Poseidon MT5
Daria Rezueva
4.68 (53)
Neuro Poseidon is a new indicator by Daria Rezueva. It combines precise trading signals with adaptive TP/SL levels - creating best possible trades as a result! Message me and get  Neuro Poseidon Assistant  as a gift to automize your trading process! What makes it stand out? 1. Proven profitability on all assets and timeframes 2. Only confirmed BUY and SELL signals present on the chart 3. Adaptive TP & SL levels generated by the software for each trade 4. Easy to understand - suitable for al
ARICoins
Temirlan Kdyrkhan
ARICoin is a powerful trading companion designed to generate high-probability entry signals with dynamic TP/SL/DP levels based on volatility. Built-in performance tracking shows win/loss stats, PP1/PP2 hits, and success rates all updated live. Key Features: Buy/Sell signals with adaptive volatility bands Real-time TP/SL/DP levels based on ATR Built-in MA Filter with optional ATR/StdDev volatility Performance stats panel (Success, Profit/Loss, PP1/PP2) Alerts via popup, sound, push, or email Cust
Adaptive Price Action Engine 지표를 구매하면 EA(자동매매 프로그램)가 무료 멀티 타임프레임 기반 자기 최적화 추세 & 캔들 패턴 분석 시스템 시장은 끊임없이 변화하며, 모든 Price Action 패턴이 모든 시장 환경에서 동일한 가치를 가지는 것은 아닙니다. Adaptive Price Action Engine 은 변화하는 시장 환경에 적응할 수 있도록 설계되었으며, 추세 구조, 멀티 타임프레임 분석, 캔들 패턴 및 통계적 최적화 를 하나의 분석 프레임워크로 결합합니다. 두 가지 적응형 모드 Dual Alpha Trend Mode 낮은 타임프레임과 높은 타임프레임에서 적합한 Alpha Trend 파라미터를 자동으로 탐색하여, 최근 시장 움직임에 맞춰 추세 분석을 조정합니다. Candlestick + Alpha Mode Alpha Trend를 통한 시장 국면 분석과 22개의 상승 및 하락 캔들 패턴 을 결합합니다. 모든 패턴을 동일하게 취급하는 대신, 다양
PZ Swing Trading MT5
PZ TRADING SLU
5 (5)
Protect against whipsaws: revolutionize your swing trading approach Swing Trading is the first indicator designed to detect swings in the direction of the trend and possible reversal swings. It uses the baseline swing trading approach, widely described in trading literature. The indicator studies several price and time vectors to track the aggregate trend direction and detects situations in which the market is oversold or overbought and ready to correct. [ Installation Guide | Update Guide | Tro
Advance AI Scanner
Mohamed Samsudeen
5 (1)
Advance AI Scanner is a multi-symbol analysis indicator for MetaTrader 5. It scans Forex pairs, metals, energy, stock indices and cryptocurrencies at the same time and rates each instrument with its own self-training model. It explains in plain English what moved each market and why, and it estimates how far upcoming economic news usually moves each symbol, measured on your broker's own price history. $199 instead of $499. 10 copies left at this price. One time purchase  Installation and User
Apex Patterns PRO 인디케이터 구매 시 - 기반 Expert Advisor 무료 제공. 자체 최적화 차트 패턴 및 브레이크아웃 분석 시스템 기존의 패턴 스캐너는 고정된 파라미터에 의존하므로 시장 변동성과 구조가 변화할 때 성능이 저하되는 경우가 많습니다. Apex Patterns PRO는 구조적 차트 패턴 인식, 모멘텀 필터링, 통계적 자체 최적화를 하나의 분석 프레임워크로 결합하여 변화하는 시장 환경에 적응하도록 설계되었습니다. 적응형 스캐닝 엔진 자체 최적화 패턴 모드 최근 과거 데이터를 바탕으로 적절한 패턴 파라미터를 자동으로 탐색하여, 정적인 설정 대신 현재 시장 행보에 맞춰 인디케이터의 구조 감지 방식을 적응시킵니다. 스마트 브레이크아웃 필터링 클래식 패턴 인식과 모멘텀, 거래량, 프라이스 액션 지표를 결합합니다. 모든 브레이크아웃을 동일하게 다루는 대신, 시장의 기저 구조를 평가하여 현재 통계적 환경에 부합하는 셋업을 식별합니다. 주요 기능 리페인트 없는 고
Advanced Supply Demand MT5
Bernhard Schweigert
4.53 (15)
현재 33% 할인! 초보자나 전문 트레이더를 위한 최고의 솔루션! 이 보조지표는 우리가 다수의 독창적 기능과 새로운 공식을 통합한 독특하고 고품질이며 저렴한 거래 도구입니다. 이 업데이트를 통해 이중 시간대를 표시할 수 있습니다. 더 높은 TF를 표시할 수 있을 뿐만 아니라 차트 TF와 더 높은 TF 모두를 표시할 수 있습니다: 중첩 영역 표시. 모든 Supply Demand 트레이더들이 좋아할 것입니다. :) 중요한 정보 공개 Advanced Supply Demand의 잠재력을 극대화하려면 다음을 방문하십시오. https://www.mql5.com/ko/blogs/post/720245   진입 또는 목표의 명확한 트리거 포인트를 정확히 찾아냄으로 해서 거래가 어떻게 개선될지 상상해 보십시오. 새로운 알고리즘을 기반으로 매수자와 매도자 간의 잠재적인 불균형을 훨씬 더 쉽게 분간할 수 있습니다. 왜냐하면 가장 강한 공급영역과 가장 강한 수요 영역과 과거에 어떻게 진행 되었는지를(이전
Superhero
Ihor Otkydach
5 (3)
SUPERHERO 지표는 “올인원” 방식으로 설계된 다중 통화 거래 시스템입니다. 이 지표는 시장을 독자적으로 분석하여 포지션을 개설하고 청산할 시점에 대한 신호를 제공합니다. 손절매(Stop Loss) 및 익절(Take Profit) 주문을 활용하며, 위험 대비 수익 비율(R:R)은 1:1입니다. 이 시스템은 스마트폰으로 푸시 알림을 전송할 수 있으므로, PC에 묶여 있을 필요 없이 “이동 중에도” 매매를 할 수 있습니다. 이는 자체 거래 전문 회사에 안성맞춤입니다. 모든 고객님께 드리는 특별 혜택: 이 지표를 구매하시는 모든 분께는 제가 특별히 준비한 유틸리티를 선물로 드릴 예정이며, 이 유틸리티는 다음과 같은 기능을 제공합니다: 손절매 및 익절 주문을 자동으로 설정합니다 가격이 목표 수준에 도달하면 자동으로 포지션을 청산합니다 미결제 주문 거래를 지원합니다 평균화 거래 모드를 지원합니다 이 훌륭하고 매우 편리한 유틸리티를 선물로 받고 싶으시다면, SUPERHERO 지표를 구매하
Bill Williams Advanced
Siarhei Vashchylka
5 (11)
Bill Williams Advanced is designed for automatic chart analysis using Bill Williams' "Profitunity" system. The indicator analyzes four timeframes at once. Manual (Be sure to read before purchasing) Advantages 1. Analyzes the chart using Bill Williams' "Profitunity" system. Signals are displayed in a table in the corner of the screen and on the price chart. 2. Finds all known AO and AC signals, as well as zone signals. Equipped with a trend filter based on the Alligator. 3. Finds "Divergence Bar
Naked Forex Kangaroo Tail Pro Indicator Kangaroo Tail Pro Indicator is a pattern recognition indicator for Forex, Stocks, Indices, Futures, Commodities and Cryptos. The Kangaroo Tail is a multi-bar pattern. The Kangaroo Tail pattern is very effective and is very simple to trade. The strategy that comes with the Kangaroo Tail is based on price action. The indicator does what it was designed for: displaying Kangaroo Tail patterns.     Don't expect to follow the up and down arrows and make mone
Murrey Math Classic
Sarvarbek Abduvoxobov
5 (2)
Murrey Math Classic Murrey Math Classic 은 금융 시장의 가격 변동을 수학적 정밀함으로 예측하도록 설계된 전문적이고 역동적인 트레이딩 지표입니다. 이 시스템은 전설적인 가격-시간 기하학을 현대화하여 현대 금융 시장에 적합한 고도로 구조화된 수학적 모델로 변환했습니다. 머레이 수학(Murrey Math)의 핵심 논리는 금융 시장이 무작위로 움직이지 않고 특정 리듬에 따라 움직인다는 것입니다. 음악이 한 옥타브의 8개 음으로 나뉘는 것처럼, 주어진 가격 범위는 0/8부터 8/8까지 8개의 동일한 수학적 레벨로 나뉩니다. 이 선들은 숨겨져 있고 신뢰도가 높은 지지 및 저항 영역으로 작용하여, 가격이 도달하기도 전에 잠재적 반전 지점을 드러내 줍니다. Code2Profit 채널 지표 작동 방식 | 전체 전략 개요 궁극의 다중 확인 진입 전략 설명 Murrey Math Classic이 기존 지표보다 우수한 이유 Murrey Math Classic:
AriFocus
Temirlan Kdyrkhan
AriFocus - Non-Repainting Buy/Sell Signals AriFocus - one clear signal. AriFocus marks buy and sell signals directly on the chart and suggests a stop-loss level for each one. Every signal is confirmed on bar close and never repaints. - Buy/sell arrows, confirmed on bar close - Suggested stop-loss level for every signal - Trend band and candle coloring to show direction at a glance - 10 ready-made presets, or your own settings (14 calculation methods) - Pop-up, push and email alerts with entr
ScalpPoint
Temirlan Kdyrkhan
ScalpPoint is a powerful trading companion designed to generate high-probability entry signals with dynamic TP/SL/DP levels based on volatility. Built-in performance tracking shows win/loss stats, PP1/PP2 hits, and success rates — all updated live. Key Features: Buy/Sell signals with adaptive volatility bands Real-time TP/SL/DP levels based on ATR Built-in MA Filter with optional ATR/StdDev volatility Performance stats panel (Success, Profit/Loss, PP1/PP2) Alerts via popup, sound, push, or emai
Volatility Master for MetaTrader is a real-time dashboard tool that scans up to  50 symbols  to identify high-volatility , trending markets instantly. With bullish/bearish signals, customizable alerts, and a user-friendly interface, it helps you avoid range-bound conditions and focus on high-probability trades. Clarity leads to confidence. Trade confidently and protect your capital effectively with this powerful dashboard. We don't offer free or bonus indicators in exchange of reviews from you.
Divergence Bomber
Ihor Otkydach
4.89 (94)
이 지표를 구매하신 분께는 다음과 같은 혜택이 무료로 제공됩니다: 각 거래를 자동으로 관리하고, 손절/익절 수준을 설정하며, 전략 규칙에 따라 거래를 종료하는 전용 도우미 툴 "Bomber Utility" 다양한 자산에 맞게 지표를 설정할 수 있는 셋업 파일(Set Files) "최소 위험", "균형 잡힌 위험", "관망 전략" 모드로 설정 가능한 Bomber Utility의 셋업 파일 이 전략을 빠르게 설치, 설정, 시작할 수 있도록 돕는 단계별 영상 매뉴얼 주의: 위의 모든 보너스를 받기 위해서는 MQL5 개인 메시지 시스템을 통해 판매자에게 연락해 주세요. 독창적인 커스텀 지표인 “Divergence Bomber(다이버전스 봄버)”를 소개합니다. 이 지표는 MACD 다이버전스(괴리) 전략을 기반으로 한 올인원(All-in-One) 거래 시스템입니다. 이 기술 지표의 주요 목적은 가격과 MACD 지표 간의 다이버전스를 감지하고, **향후 가격이 어느 방향으로 움직일지를 알려주
제작자의 제품 더 보기
CapitalSol Forex MTF Scanner Multi-Timeframe Forex Trend Scanner for MetaTrader 5 CapitalSol Forex MTF Scanner is a multi-symbol and multi-timeframe market analysis indicator designed to provide a structured overview of Forex market direction directly inside MetaTrader 5. Instead of opening and checking multiple currency charts individually, the scanner displays the selected Forex pairs in one compact dashboard and evaluates their directional state across several timeframes simultaneously.
Indices Metals MTF Scanner Scan major global indices and precious metals across multiple timeframes from one professional dashboard. The CapitalSol Indices Metals MTF Scanner is a multi-symbol and multi-timeframe market analysis tool for MetaTrader 5. It provides a structured overview of bullish and bearish market conditions across selected indices and metals without the need to open and analyze every chart individually. The scanner evaluates the relationship between a Fast EMA and Slow EMA on f
필터:
리뷰 없음
리뷰 답변