Signals Supply and Demand Force

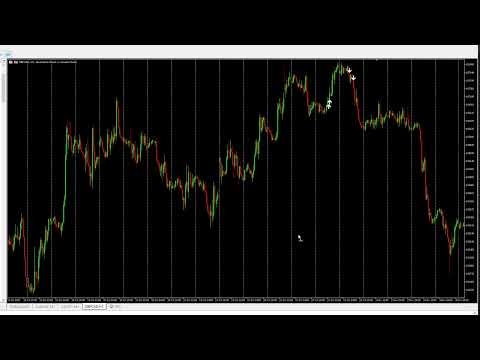
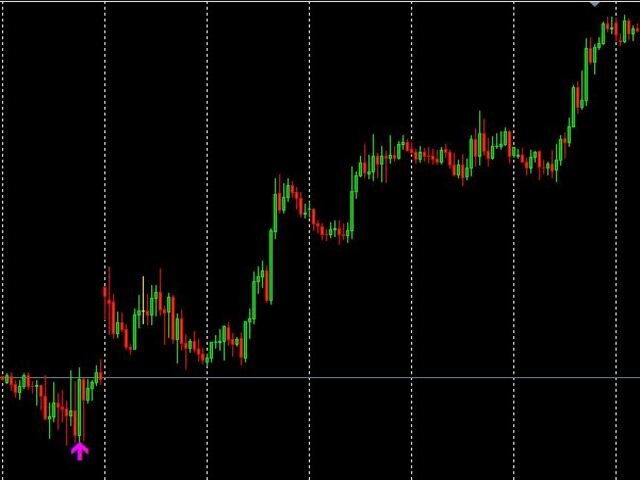
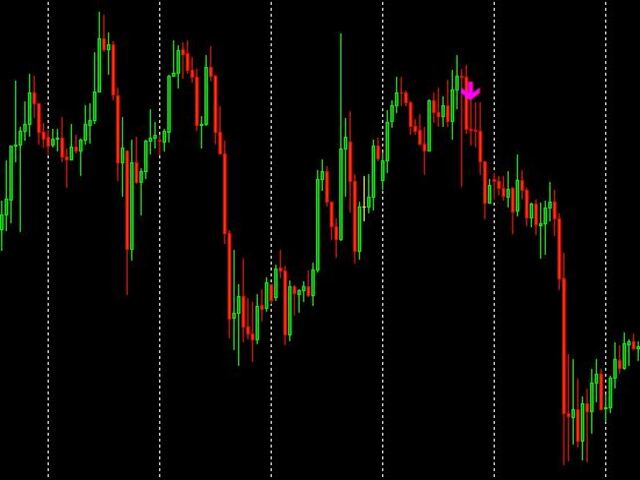
Este Indicador esta basado en el rebote de un soporte o resistencia fuerte con un indicador que tiene interno de fuerza de movimiento. Tiene la opción de ver el soporte y resistencia actual y ver la fuerza que tiene dicho soporte o resistencia.(Activando el parámetro Ver_Sop_Res)

Parámetros:

  • Sop o Res, Fuerza Mayor a...: Con este parámetro podrás ajustar la fuerza del soporte o resistencia, con la cual el indicador evaluara si es una señal bajista o alcista.
  • Velas Historial: Con este parámetro podrás ver el historial de señales en velas hacia atrás, que hizo el indicador.

Parámetros Horario:

-Podrás ajustar el horario y los días en las que puede aparecer las señales

Parámetros Alertas:

Podrás ajustar el tipo de Alerta que desees

Parámetros TREND FORCE :

Estos parámetros es parte del indicador de fuerza de movimiento que esta internamente

Parámetros  SUP AND DEMAND:

Estos son los parámetros del indicador de Sup and Demand

Los parámetros mas importantes son:

  •  BackLimit: Este parámetro permite saber al indicador , hasta que distancia en velas evaluara hacia atrás para sacar el soporte y resistencia.
  • zone_fuzzfactor: Este parámetro te permite ajustar la finura de la evaluación en ancho de la resistencia o soporte

RECOMENDACION: Funciona mejor en TIMEFRAMES mayores o igual a H1


Si deseas encontrar la mejor configuración de las señales te recomiendo que cambies los parámetros

  • BackLimit
  • zone_fuzzfactor
  • Sop o Res, Fuerza Mayor a...

Y los parámetros de TREND FORCE

  • trendPeriod 
  • TriggerUp    
  • TriggerDown 

추천 제품
The new update makes this indicator a complete tool for studying, analyzing and operating probabilistic patterns. It includes: On-chart Multi-asset percentage monitor. Configurable martingales. Twenty-one pre-configured patterns, including Mhi patterns and C3. An advanced pattern editor to store up to 5 custom patterns. Backtest mode to test results with loss reports. Trend filter. Hit operational filter. Martingale Cycles option. Various types of strategies and alerts. Confluence between patter
SPECIAL LAUNCH OFFER: $30 (1-Month Rent) Limited time offer to build our community and gather feedback! AmbM GOLD Institutional Scalper A high-precision M5 algorithm for XAUUSD (Gold) , engineered to trade exclusively at Institutional Liquidity Levels ($5/$10 psychological marks). PERFORMANCE DATA (BUY ONLY) • Win Rate: 87.09%. • Safe Growth: +$4,113 profit on $10k (13.75% Max Drawdown). • Extreme Stress Test: Successfully generated +$22,997 in a 5-year stress test (2020-2026), proving
LineaMMSuavizado
Cesar Juan Flores Navarro
Se considera la secuencia de la serie Fibonacci (2,3,5,8,13) que sera multiplicado por un periodo (11 o 33 o 70 etc.), de las 5 lineas se sacara una sola que sera contendrá el máximo y mínimo de las 5, a esta linea se le aplicara un suavizador de 3....y a esta linea suavizada se le volverá a aplicar un suavizador de 3. obteniéndose 2 lineas suavizadas. A simple vista se ve las intersecciones que hacen las lineas que pueden ser usadas para comprar o vender. Cambien se puede usar con apoyo de otro
Visual Range Directional Force Indicator
AL MOOSAWI ABDULLAH JAFFER BAQER
Range Directional Force Indicator – Designed for You to Optimize! The Range Directional Force Indicator is a cutting-edge tool designed to empower traders by visualizing market dynamics and directional strength. Built to offer insights into market trends and reversals, this indicator is an invaluable asset for traders seeking precision in their strategies. However, it is important to note that this indicator is not optimized, leaving room for you to tailor it to your unique trading preferences.
Quantum Flux Oscillator
AL MOOSAWI ABDULLAH JAFFER BAQER
Master Market Trends with the Quantum Flux Oscillator Unlock a new level of trading precision with the Quantum Flux Oscillator, a professional-grade indicator for MetaTrader 5 designed to identify and capitalize on market momentum. Stop guessing the direction of the trend and start making informed decisions based on a clear, powerful, and mathematically sound tool. For just $30, you can add this indispensable oscillator to your trading arsenal. The Logic Behind the Oscillator The Quantum Flux O
ZigZag Scalper Indicator (MT5) Price Structure Visualization Tool for MetaTrader 5 Overview ZigZag Scalper Indicator is a technical analysis tool developed for MetaTrader 5 that helps traders visualize price swings and short-term market structure. The indicator is designed to highlight significant highs and lows on the chart using a ZigZag-style calculation. By simplifying price movement into clearer swing structures, traders can better understand potential trend direction and short-term ma
Triangle Pattern Gann v3.1 - Complete Feature Documentation Core Functionality OverviewTriangle Pattern Gann v3.1 is a sophisticated MetaTrader 5 indicator that combines W.D. Gann's geometric trading principles with advanced triangle pattern recognition to deliver actionable trading signals. Primary Features1. Triangle Pattern Detection SystemAscending Triangle Recognition Function: Automatically identifies bullish continuation patterns Detection Criteria: Flat horizontal resistance line
CS Bollinger
MIKHAIL VINOGRADOV
CS Bollinger – 볼린저 밴드를 기반으로 한 신호 지표로, 주요 지지 및 저항 수준을 신속하게 파악하고 시각적인 거래 신호를 제공합니다. 개선된 수준 전환 로직을 통해 차트에서 자동으로 레벨을 조정하며, 가격 반전이 확인될 때 신호 화살표를 표시합니다. 이를 통해 트레이더는 시장 진입 및 이탈을 위한 최적의 순간을 빠르게 찾을 수 있습니다. 또한 개인의 거래 전략에 맞춰 유연한 설정이 가능하며, 초보자부터 숙련된 트레이더까지 폭넓게 사용할 수 있습니다. 매개변수 기본값 설명 BollingerPeriod 5 볼린저 밴드 계산 기간. 평균을 계산할 캔들의 수를 정의합니다. BollingerDeviation 5 밴드 상단과 하단 라인을 계산하는 데 사용되는 편차 계수 CheckZeroBar false 신호 생성 시 가장 최근 캔들(0번 캔들)의 확인 활성화 여부 ColorResistance clrDeepPink 위에서 아래로 전환하는 저항선의 색상 Colo
Boom kerdoskopos
David Chokumanyara
Boom Kerdoskopos Indicator – Sell With Confidence The Boom Kerdoskopos Indicator is a scalper’s dream for Boom markets on M1 timeframe . Built to protect you from spikes, it gives precise yellow down arrows for sell entries and red cross exit signals so you always know when to enter and leave the trade. With smart alerts (audible, push, email), you can trade stress-free and secure 8–10 safe candles every time. It’s perfect for scalpers who want fast, consistent profits. Why Traders Choose
AIntel Swing Indicator
Karlis Balcers
5 (1)
About AIntel Is there are reason you select RSI 14 or 21? Is there a reason you select EMA 25? Is there a reason you pick these periods for these and any other indicators? Those numbers might have worked 10 or 20 years ago. They might be working for traiding certain currency pair in a certain timeframe.. But they DO NOT give you the best profit and outcome at all times all pairs all trades! AInter is "automated inteligence" series indicators that optimize automatically for best profit so you don
Reversal Candlestick Patterns Indicator — Free Version This MT5 indicator identifies common bullish and bearish candlestick reversal patterns and displays them directly on the chart. It can be used on any market and timeframe, providing traders with clear visual references for potential reversal points. Main Features Automatic detection of well-known candlestick reversal patterns Works on all available MT5 timeframes Can be applied to Forex, Stocks, Commodities, Indices, and Cryptocurrency char
FREE
WAPV Weis Wave Chart Forex
Eduardo Da Costa Custodio Santos
The Weis Wave Chart Forex for MT5 is a Price and Volume indicator. The Price and Volume reading was widely disseminated through Richard Demille Wyckoff based on the three laws created by him: Supply and Demand, Cause and Effect and Effort vs. Result. In 1900 R.Wyckoff already used the wave chart in his analyses. Many years later, around 1990, David Weis Automated R. Wyckoff's wave chart and today we bring you the evolution of David Weis' wave chart. It shows the amount of Volume and the amount o
CosmiCLab NY Liquidity PRO M15 Professional Smart Money Concepts indicator for detecting New York liquidity sweeps and institutional market behavior. CosmiCLab NY Liquidity PRO M15 is designed to help traders identify key liquidity zones formed during the New York session and trade institutional price movements with precision. The indicator automatically analyzes market structure and highlights important levels based on the first M15 candle of the New York session (09:30 NY time) . These levels
Intraday Session TPO
Kummari Raghu Ram
Intraday Session TPO: Precision Volume Profiling for Day Traders Stop trading blind during the most volatile hours of the day. Standard daily volume profiles blend everything together, masking the true areas of liquidity and institutional interest. The Intraday Session TPO is engineered specifically for session-to-session traders. It empowers you to isolate and profile specific time windows—like the London Open, the New York Killzone, or the Asian range—so you can see exactly where the volume is
RastroBot EA
Raquel Costa
RastroBot usa o indicador Donchian Channel para identificar sinais de entrada, inspirados nas famosas estratégias Turtle. Simples e eficaz, é amplamente utilizado por traders profissionais e está integrado ao MT5. Ideal para quem quer usar esses sinais em operações de scalping. Não usa IA, Martingale ou Grid. Não é um "santo graal" do trading, mas uma estratégia honesta para lucrar com rápidas acelerações de tendência. O EA pode ser usado além do scalping, ajustando ou desativando o trailing
The "MR Volume Profile Rectangles 5" indicator is a charting tool that displays trading volume at different price levels rather than time intervals. A key concept in volume profile is the point of control (POC) —the price level with the highest volume traded during the session or time range. While tools like VWAP or OBV provide volume trends, the "MR Volume Profile Rectangles 5" indicator offers granular detail about where the most market activity occurs at specific price levels. This makes it a
Supply and Demand Indicator + FREE Currency Strength Meter ADD-ON Looking for a powerful tool that can help you identify the most reactive zones in the forex market? Our supply and demand indicator for MetaTrader 4 and 5 is exactly what you need. With its advanced algorithms and real-time analysis, this indicator helps traders of all experience levels make informed trading decisions. The supply and demand indicator is a cutting-edge tool that helps traders identify areas where buyers and sellers
Equinox Gold
Dmitriq Evgenoeviz Ko
Equinox Gold is a high-tech trading expert advisor (EA) specifically designed for the gold market ( XAUUSD ). The system is based on a unique Market Equilibrium algorithm that identifies areas of imbalance between supply and demand during extreme volatility. Unlike most robots that use dangerous sit-and-wait methods, Equinox Gold relies on mathematical momentum confirmation and strict risk control for every trade. MAIN ADVANTAGES VRP Filter (Volatility Range Filter): The robot automatically ada
Antique Trend
Nadiya Mirosh
The Antique Trend Indicator is a revolutionary trend trading and filtering solution with all the important features of a trend tool built into one tool! The Antique Trend indicator is good for any trader, suitable for any trader both for Forex and binary options. There is no need to configure anything, everything has been perfected by time and experience, it works great during flats and trends. The Antique Trend indicator is a tool for technical analysis of financial markets, reflecting curren
Volume Profile Advance
Israr Hussain Shah
Daily & Composite Volume Profile   This is a professional-grade market profile tool designed for MetaTrader 5. It utilizes a   Dual-Profile System   to visualize supply, demand, and liquidity concentrations. Key Features Left Side: Daily Session Profiles Automatically identifies the start and end of every trading day. Generates a unique Volume Profile for each individual day. Allows you to see how value migrated from yesterday to today (e.g., Is today's volume higher or lower than yesterday?).
Scalping PullBack Signal
Quang Huy Quach
5 (1)
1. Overview The Scalping PullBack Signal indicator is a powerful technical analysis tool designed to help traders identify scalping opportunities based on potential pullback and reversal signals. This tool is particularly useful on lower timeframes (below 15 minutes) but can also be applied on higher timeframes for longer-term trades. This indicator integrates several key analytical components, providing a comprehensive view of trends and potential entry/exit points, helping you make quick and e
FREE
Universal Volatility Compass (UVC): 모든 자산에서 자신 있게 시장 사이클을 탐색하세요 1993년 출시 이후, CBOE 변동성 지수(VIX)는 주식 시장의 시장 위험과 투자자 공포를 측정하는 기준이 되었습니다. VIX 수치가 높으면 변동성이 증가했음을 나타내며 종종 시장 바닥과 일치하고, 낮은 수치는 자기 만족감과 시장 최고점을 나타냅니다. 하지만 S&P 500, Nasdaq, Dow 외의 광활한 시장은 어떨까요? 상품, 외환, 암호화폐, 심지어 개별 주식까지 – 트레이더는 이러한 다양한 시장에서 공포를 효과적으로 측정하고 잠재적인 전환점을 식별하는 방법을 어떻게 알 수 있을까요? 래리 윌리엄스의 획기적인 "합성 VIX" 또는 "윌리엄스 VIX 픽스"(WVF)에서 영감을 받은 강력한 맞춤형 MT5 지표인 **Universal Volatility Compass (UVC)**를 소개합니다. 이것은 단순히 또 다른 지표가 아닙니다. VIX의 귀중한 통찰력을 거
Best SAR MT5
Ashkan Hazegh Nikrou
4.33 (3)
설명 :  우리는 외환 시장(PSAR)에서 전문적이고 인기 있는 지표 중 하나를 기반으로 하는 새로운 무료 지표를 도입하게 된 것을 기쁘게 생각합니다. 이 지표는 원래 포물선 SAR 지표에 대한 새로운 수정이며, 프로 SAR 지표에서 점과 가격 차트 사이의 교차를 볼 수 있습니다. 교차는 신호가 아니지만 이동 가능성의 끝을 말하는 것입니다. 새로운 파란색 점으로 매수를 시작하고 첫 번째 파란색 점 앞에 손절매를 1 attr 배치하고 마지막으로 점이 가격 차트를 교차하는 즉시 종료할 수 있습니다. 매수 또는 매도 신호를 여는 방법은 무엇입니까? 첫 번째 파란색 점으로 공개 매수 거래 및 첫 번째 빨간색 점으로 공개 매도 거래 정확한 손절매는 어디에 있습니까? 안전한 정지 손실은 첫 번째 점에 있을 수 있습니다(구매의 경우 첫 번째 파란색 점, 매도의 경우 첫 번째 빨간색 점) 올바른 이익실현은 어디에 있습니까? 이익실현은 손절매 거리와 RR에 따라 조정할 수 있으므로 내 제
FREE
Consecutive Candle MT5을 소개합니다. 이 혁신적인 지표는 강세 또는 약세 캔들의 연속성을 식별하여 귀하의 거래 전략을 향상시키도록 설계되었습니다. 이 도구는 forex, 주식, 암호화폐 및 원자재 시장의 거래자에게 완벽하며, 명확한 신호와 알림을 제공하여 정보에 기반한 결정을 내리는 데 도움을 줍니다. 트렌드 확인 및 잠재적 반전을 위한 적시 알림을 제공하는 능력 덕분에 Consecutive Candle MT5은 정확성과 사용의 용이성으로 찬사를 받고 있습니다. 많은 거래자들이 이 지표를 활용하여 지속적인 트렌드를 활용함으로써 거래 타이밍이 개선되고 성공률이 높아졌다고 보고했습니다. MQL 제품 설치 가이드 | MT4/MT5에서 구매한 MQL 제품 업데이트 | 일반 문제 해결 가이드 | 지표 설정 / 가이드 주요 기능 버퍼 통합: 지표 값을 Expert Advisor가 자동 신호 기반 거래를 위해 직접 읽을 수 있는 접근 가능한 버퍼로 노출합니다. 시각적 화살표 신
FREE
Simple Strategy indicator
Vladimir Kuzmin
4 (1)
Simple Strategy Indicator The Simple Strategy indicator is a reliable tool for identifying trend direction, leveraging three popular technical indicators: MACD, RSI, and Stochastic. It provides clear trading signals for quick market analysis. Trend Detection Logic Buy signal: MACD above signal line, RSI > 50, Stochastic > 50 Sell signal: MACD below signal line, RSI < 50, Stochastic < 50 Advantages Suitable for various assets: forex, stocks, cryptocurrencies, indices Optimal on daily (D1) timefr
FREE
Golden Gauss AI ONNX
Daglox Daglox Kankwanda
️  LAUNCH PHASE (ALPHA):  $499 for the first 20 copies. Current Status: Slots Open. After slot 20, price increases to   $799   to preserve the Alpha and protect user liquidity. The Mathematics of Gold: Machine Learning, Not Magic. Golden Gauss AI is not a standard EA. It is a   Probability Inference Engine   built on   ONNX (Open Neural Network Exchange)   technology. While retail markets are flooded with "Neural Networks" that overfit and fail, Golden Gauss utilizes a sophisticated   Grad
Price Magnet — Price Density and Attraction Levels Indicator Price Magnet is a professional analytical tool designed to identify key support and resistance levels based on statistical Price Density. The indicator analyzes a specified historical period and detects price levels where the market spent the most time. These zones act as “magnets,” attracting price action or forming a structural base for potential reversals. Unlike traditional Volume Profile tools, Price Magnet focuses on price-time d
HMA Trend Professional MT5
Pavel Zamoshnikov
4.25 (4)
Improved version of the free HMA Trend indicator (for MetaTrader 4) with statistical analysis. HMA Trend is a trend indicator based on the Hull Moving Average (HMA) with two periods. HMA with a slow period identifies the trend, while HMA with a fast period determines the short-term movements and signals in the trend direction. The main differences from the free version: Ability to predict the probability of a trend reversal using analysis of history data. Plotting statistical charts for analyzi
여러 심볼과 시간 프레임에서 전설적인 가틀리 패턴을 자동으로 감지하세요 가틀리 패턴 — 1935년 H.M. 가틀리가 발견하고 스콧 카니가 특정 피보나치 비율로 정교하게 다듬은 — 은 모든 하모닉 패턴의 "할아버지"로 여겨집니다. 정확한 B 포인트 61.8% 되돌림과 D 포인트 78.6% 완성은 기술적 분석에서 가장 신뢰할 수 있는 잠재적 반전 구역 중 하나를 만들어냅니다. 올바르게 형성된 가틀리 패턴을 수동으로 찾으려면 수 시간의 차트 분석과 신중한 피보나치 검증이 필요합니다. 이 대시보드는 최대 20개의 종목을 9개의 시간 프레임에 걸쳐 자동으로 스캔하고, 필요한 모든 비율을 검증하며, 유효한 가틀리가 완성되는 순간 알림을 보내 그 지루한 작업을 없애줍니다. 가틀리 패턴이 특별한 이유 가틀리는 각 레그에 엄격한 피보나치 요건을 가진 5점 XABCD 하모닉 구조입니다. 더 단순한 패턴과 달리 가틀리는 정확한 비율 정렬을 요구하며, 이는 거의 90년에 걸친 검증된 시장 심리학으로 뒷받
Multi MACD MT5
Vladimir Pokora
This tool monitors MACD indicators on all time frames in the selected markets. Displays a table with signals to open a BUY trade (green) or SELL trade (red). You can set the conditions for the signal. You can easily add or delete market names / symbols. If the conditions for opening a trade on multiple time frames are met, you can be notified by e-mail or phone message (according to the settings in MT5 menu Tools - Options…) You can also set the conditions for sending notifications. The list of
이 제품의 구매자들이 또한 구매함
Azimuth Pro
Ottaviano De Cicco
5 (6)
LAUNCH PROMO Azimuth Pro price is initially set at 299$ for the first 100 buyers. Final price will be 499$ . THE DIFFERENCE BETWEEN RETAIL AND INSTITUTIONAL ENTRIES ISN'T THE INDICATOR — IT'S THE LOCATION. Most traders enter at arbitrary price levels, chasing momentum or reacting to lagging signals. Institutions wait for price to reach structured levels where supply and demand actually shift. Azimuth Pro maps these levels automatically: swing-anchored VWAP, multi-timeframe structure lines, an
Divergence Bomber
Ihor Otkydach
4.89 (83)
이 지표를 구매하신 분께는 다음과 같은 혜택이 무료로 제공됩니다: 각 거래를 자동으로 관리하고, 손절/익절 수준을 설정하며, 전략 규칙에 따라 거래를 종료하는 전용 도우미 툴 "Bomber Utility" 다양한 자산에 맞게 지표를 설정할 수 있는 셋업 파일(Set Files) "최소 위험", "균형 잡힌 위험", "관망 전략" 모드로 설정 가능한 Bomber Utility의 셋업 파일 이 전략을 빠르게 설치, 설정, 시작할 수 있도록 돕는 단계별 영상 매뉴얼 주의: 위의 모든 보너스를 받기 위해서는 MQL5 개인 메시지 시스템을 통해 판매자에게 연락해 주세요. 독창적인 커스텀 지표인 “Divergence Bomber(다이버전스 봄버)”를 소개합니다. 이 지표는 MACD 다이버전스(괴리) 전략을 기반으로 한 올인원(All-in-One) 거래 시스템입니다. 이 기술 지표의 주요 목적은 가격과 MACD 지표 간의 다이버전스를 감지하고, **향후 가격이 어느 방향으로 움직일지를 알려주는
Entry In The Zone and SMC Multi Timeframe is a real-time market analysis tool developed based on Smart Money Concepts (SMC). It is designed to analyze market structure, price direction, reversal points, and key zones across multiple timeframes in a systematic way. The system displays Points of Interest (POI) and real-time No Repaint signals, with instant alerts when price reaches key zones or when signals occur within those zones. It functions as both an Indicator and a Signal System (2-in-1), c
ARICoins
Temirlan Kdyrkhan
ARICoin is a powerful trading companion designed to generate high-probability entry signals with dynamic TP/SL/DP levels based on volatility. Built-in performance tracking shows win/loss stats, PP1/PP2 hits, and success rates all updated live. Key Features: Buy/Sell signals with adaptive volatility bands Real-time TP/SL/DP levels based on ATR Built-in MA Filter with optional ATR/StdDev volatility Performance stats panel (Success, Profit/Loss, PP1/PP2) Alerts via popup, sound, push, or email Cust
이 지표를 구매하면 제 프로페셔널 트레이드 매니저를 무료로 드립니다. 우선 이 거래 시스템이 리페인팅, 리드로잉 및 레이그 인디케이터가 아니라는 점을 강조하는 것이 중요합니다. 이는 수동 및 로봇 거래 모두에 이상적인 것으로 만듭니다. 온라인 강좌, 설명서 및 프리셋 다운로드. "스마트 트렌드 트레이딩 시스템 MT5"은 새로운 및 경험이 풍부한 트레이더를 위해 맞춤형으로 제작된 종합적인 거래 솔루션입니다. 10개 이상의 프리미엄 인디케이터를 결합하고 7개 이상의 견고한 거래 전략을 특징으로 하여 다양한 시장 조건에 대한 다목적 선택이 가능합니다. 트렌드 추종 전략: 효과적인 트렌드 추이를 타기 위한 정확한 진입 및 손절 관리를 제공합니다. 반전 전략: 잠재적인 트렌드 반전을 식별하여 트레이더가 범위 시장을 활용할 수 있게 합니다. 스캘핑 전략: 빠르고 정확한 데이 트레이딩 및 단기 거래를 위해 설계되었습니다. 안정성: 모든 인디케이터가 리페인팅, 리드로잉 및 레이그가 아니므로 신뢰
FX Trend MT5 NG
Daniel Stein
5 (4)
FX Trend NG: 차세대 멀티 마켓 트렌드 인텔리전스 개요 FX Trend NG 는 다중 시간 프레임 기반의 전문 트렌드 분석 및 시장 모니터링 도구입니다. 몇 초 만에 전체 시장 구조를 파악할 수 있도록 설계되었습니다. 여러 차트를 일일이 전환할 필요 없이, 어떤 종목이 추세에 있는지, 어디에서 모멘텀이 약화되고 있는지, 그리고 어떤 시간 프레임이 서로 정렬되어 있는지 즉시 확인할 수 있습니다. 출시 기념 특별 혜택 – FX Trend NG 를 $30 (6개월) 또는 $80 평생 라이선스 로 이용할 수 있습니다. 이미 Stein Investments 고객이신가요? -> 메시지를 보내 전용 고객 그룹에 참여하세요. 설정이나 사용 방법이 필요하신가요? -> Stein Investments 공식 페이지 를 방문하세요. 1. FX Trend NG가 특별한 이유 3단계 추세 로직 – 단순한 Buy / Sell이 아닙니다 • 대부분의 지표는 Buy 또는 Sell 두 가지 상태만 제
Trend Screener Pro MT5
STE S.S.COMPANY
4.84 (102)
트렌드 표시기, 트렌드 트레이딩 및 필터링을 위한 획기적인 고유 솔루션, 하나의 도구 안에 내장된 모든 중요한 트렌드 기능! Forex, 상품, 암호 화폐, 지수 및 주식과 같은 모든 기호/도구에 사용할 수 있는 100% 다시 칠하지 않는 다중 시간 프레임 및 다중 통화 표시기입니다. Trend Screener는 차트에 점이 있는 화살표 추세 신호를 제공하는 효율적인 지표 추세 추종 지표입니다. 추세 분석기 표시기에서 사용할 수 있는 기능: 1. 트렌드 스캐너. 2. 최대 이익 분석이 있는 추세선. 3. 추세 통화 강도 측정기. 4. 경고가 있는 추세 반전 점. 5. 경고가 있는 강력한 추세 점. 6. 추세 화살표 Trend Screener Indicator가 있는 일일 분석 예, 일일 신호 성능...등은 여기에서 찾을 수 있습니다. 여기를 클릭하십시오. LIMITED TIME OFFER : Trend Screener Indicator는 50$ 및 평생 동안만 사용할 수 있습니다.
AriX
Temirlan Kdyrkhan
1 (4)
AriX Indicator for MT5 A powerful trend-following and signal-evaluation tool AriX is a custom MT5 indicator that combines Moving Averages and ATR-based risk/reward logic to generate clear buy/sell signals. It visualizes dynamic SL/TP levels, evaluates past trade outcomes, and displays win/loss statistics in a clean on-chart panel. Key features include: Buy/Sell signals based on MA crossovers ATR-based SL/TP1/TP2/TP3 levels with visual lines and labels Signal outcome tracking with real-time stat
FX Power MT5 NG
Daniel Stein
5 (31)
FX Power: 통화 강세 분석으로 더 스마트한 거래 결정을 개요 FX Power 는 어떤 시장 상황에서도 주요 통화와 금의 실제 강세를 이해하기 위한 필수 도구입니다. 강한 통화를 매수하고 약한 통화를 매도함으로써 FX Power 는 거래 결정을 단순화하고 높은 확률의 기회를 발견합니다. 트렌드를 따르거나 극단적인 델타 값을 사용해 반전을 예측하고자 한다면, 이 도구는 귀하의 거래 스타일에 완벽히 적응합니다. 단순히 거래하지 말고, FX Power 로 더 스마트하게 거래하세요. 1. FX Power가 거래자에게 매우 유용한 이유 통화와 금의 실시간 강세 분석 • FX Power 는 주요 통화와 금의 상대적 강세를 계산하고 표시하여 시장 역학에 대한 명확한 통찰력을 제공합니다. • 어떤 자산이 앞서고 있고 어떤 자산이 뒤처지는지 모니터링하여 보다 현명한 거래 결정을 내릴 수 있습니다. 포괄적인 멀티 타임프레임 뷰 • 단기, 중기 및 장기 타임프레임에서 통화와 금의 강세를
RFI levels PRO MT5
Roman Podpora
3.67 (3)
이 지표는 추세 반전 지점과 가격 반등 영역을 정확하게 보여줍니다.       주요 투자자들   . 새로운 트렌드가 형성되는 곳을 파악하고 최대한 정확하게 의사결정을 내리며 모든 거래를 완벽하게 통제합니다. TREND LINES PRO   지표와 함께 사용할 때 최대의 잠재력을 발휘합니다.  VERSION MT4 지표가 보여주는 내용: 새로운 추세의 시작 시 활성화되는 반전 구조 및 반전 수준. 최소한의 위험 대비 수익률을 갖는 이익 실현   (TAKE PROFIT)   및   손절매(STOP LOSS)   레벨 표시       RR 1:2   . 지능형 손실 감소 로직이 적용된 손절매 기능. 지정된 지표에서 두 가지 추세 유형에 대한 반전 패턴을 표시합니다. 지표: 트렌드를 따라   트렌드 라인 프로   (글로벌 트렌드 변화) 트렌드 프로   (빠른 트렌드 변화) 간단하고 효과적입니다       스캐너       실시간 추세 (신규). 다중 시간 프레임 도구 필터링. 표시하다  
Quantum TrendPulse
Bogdan Ion Puscasu
5 (22)
SuperTrend   ,   RSI   ,   Stochastic   의 힘을 하나의 포괄적인 지표로 결합하여 트레이딩 잠재력을 극대화하는 궁극의 트레이딩 도구   인 Quantum TrendPulse를   소개합니다. 정밀성과 효율성을 추구하는 트레이더를 위해 설계된 이 지표는 시장 추세, 모멘텀 변화, 최적의 진입 및 종료 지점을 자신 있게 식별하는 데 도움이 됩니다. 주요 특징: SuperTrend 통합:   주요 시장 추세를 쉽게 따라가고 수익성의 물결을 타세요. RSI 정밀도:   매수 과다 및 매도 과다 수준을 감지하여 시장 반전 시점을 파악하는 데 적합하며 SuperTrend 필터로 사용 가능 확률적 정확도:   변동성이 큰 시장에서 숨겨진 기회를 찾기 위해 확률적 진동   을 활용하고 SuperTrend의 필터로 사용 다중 시간대 분석:   M5부터 H1 또는 H4까지 다양한 시간대에 걸쳐 시장을 최신 상태로 유지하세요. 맞춤형 알림:   맞춤형 거래 조건이 충족되면
Atomic Analyst MT5
Issam Kassas
3.94 (31)
우선적으로 언급할 점은이 거래 지표가 다시 그리지 않고 지연되지 않으며 이를 통해 수동 및 로봇 거래 모두에 이상적이라는 점입니다. 사용자 매뉴얼: 설정, 입력 및 전략. Atomic Analyst는 가격의 강도와 모멘텀을 활용하여 시장에서 더 나은 이점을 찾는 PA Price Action Indicator입니다. 고급 필터를 장착하여 잡음과 거짓 신호를 제거하고 거래 잠재력을 높이는 데 도움이 됩니다. 복잡한 지표의 다중 레이어를 사용하여 Atomic Analyst는 차트를 스캔하고 복잡한 수학적 계산을 간단한 신호와 색상으로 변환하여 초보 트레이더가 이해하고 일관된 거래 결정을 내릴 수 있도록합니다. "Atomic Analyst"는 새로운 및 경험이 풍부한 트레이더를위한 종합적인 거래 솔루션입니다. 프리미엄 지표와 최고 수준의 기능을 하나의 거래 전략에 결합하여 모든 종류의 트레이더에 대한 다재다능한 선택지가되었습니다. 인트라데이 거래 및 스캘핑 전략 : 빠르고 정확한 일일
Grabber System MT5
Ihor Otkydach
4.83 (23)
탁월한 기술적 지표인 Grabber를 소개합니다. 이 도구는 즉시 사용 가능한 “올인원(All-Inclusive)” 트레이딩 전략으로 작동합니다. 하나의 코드 안에 강력한 시장 기술 분석 도구, 매매 신호(화살표), 알림 기능, 푸시 알림이 통합되어 있습니다. 이 인디케이터를 구매하신 모든 분들께는 다음의 항목이 무료로 제공됩니다: Grabber 유틸리티: 오픈 포지션을 자동으로 관리하는 도구 단계별 영상 매뉴얼: 설치, 설정, 그리고 실제 거래 방법을 안내 맞춤형 세트 파일: 인디케이터를 빠르게 자동 설정하여 최고의 성과를 낼 수 있도록 도와줍니다 다른 전략은 이제 잊어버리세요! Grabber만이 여러분을 새로운 트레이딩의 정점으로 이끌어 줄 수 있습니다. Grabber 전략의 주요 특징: 거래 시간 프레임: M5부터 H4까지 거래 가능한 자산: 어떤 자산이든 사용 가능하지만, 제가 직접 테스트한 종목들을 추천드립니다 (GBPUSD, GBPCAD, GBPCHF, AUDCAD, AU
Trend indicator AI mt5
Ramil Minniakhmetov
5 (16)
트렌드 인공 지능 지표는 실행 가능한 진입 점 및 반전 경고와 추세 식별을 결합하여 상인의 시장 분석을 향상시킬 훌륭한 도구입니다. 이 표시기는 사용자가 자신감과 정밀도로 외환 시장의 복잡성을 탐색 할 수 있도록 지원합니다 기본 신호 외에도 트렌드 인공 지능 지표는 풀백 또는 되돌림 중에 발생하는 2 차 진입 점을 식별하여 거래자가 기존 트렌드 내에서 가격 수정을 활용할 수 있도록합니다. 중요한 장점: ·작동 4 및 5 *명확한 구매 또는 판매 신호 *다시 칠하지 않습니다 *모든 자산에서 작동 나는 전보 사기에 개 또는 세트를 판매하지 않도록주의. 모든 설정은 블로그에 여기에 무료.  중요! 지침 및 보너스를 얻기 위해 구입 후 즉시 저에게 연락! 진짜 가동 감시는 뿐 아니라 나의 다른 제품 여기에서 찾아낼 수 있습니다: https://www.mql5.com/en/users/mechanic/seller&nbsp ; 설정 및 입력: 모든 자산에 대해 기본 설정을 권
Trend Lines PRO MT5
Roman Podpora
5 (1)
트렌드 라인즈 프로       이 지표는 시장이 실제로 어떤 방향으로 전환되는지 파악하는 데 도움이 됩니다. 실제 추세 반전 지점과 주요 시장 참여자들이 다시 진입하는 지점을 보여줍니다. 보시다시피       BOS 라인       복잡한 설정이나 불필요한 노이즈 없이 더 높은 시간대의 추세 변화와 주요 레벨을 확인할 수 있습니다. 신호는 차트에 다시 그려지지 않고 캔들이 마감된 후에도 계속 표시됩니다. MT4 버전   -   RFI LEVELS PRO   표시기   와 결합 시 최대 잠재력을 발휘합니다. 지표가 보여주는 내용: 실제 변화       추세(BOS 라인) 한 번 신호가 나타나면 그 신호는 계속 유효합니다! 이는 신호를 발생시킨 후 변경될 수 있는 리페인팅 방식의 지표와 중요한 차이점입니다. 리페인팅 방식의 지표는 잠재적으로 자금 손실로 이어질 수 있습니다. 이제 더욱 높은 확률과 정확도로 시장에 진입할 수 있습니다. 또한 화살표가 나타난 후 목표가(익절)에 도달하거나
Meridian Pro
Ottaviano De Cicco
Meridian Pro: Professional Multi-Timeframe Trend Matrix for MT5 Overview Meridian Pro is a multi-timeframe trend matrix by Merkava Labs that compresses directional state, strength, momentum condition and matrix agreement into one compact panel. One adaptive engine, applied consistently from M1 to W1. No per-symbol tuning. No indicator stacking. One structured readout across every asset and every timeframe. Launch Offer — Get Meridian Pro for USD 99 (introductory). Regular price: USD 149. 1. Why
우선적으로, 이 거래 도구는 전문적인 거래에 이상적인 비-다시 그리기 및 지연되지 않는 지표입니다.  온라인 강좌, 사용자 매뉴얼 및 데모. 스마트 가격 액션 컨셉트 인디케이터는 신규 및 경험 많은 트레이더 모두에게 매우 강력한 도구입니다. Inner Circle Trader Analysis 및 Smart Money Concepts Trading Strategies와 같은 고급 거래 아이디어를 결합하여 20가지 이상의 유용한 지표를 하나로 결합합니다. 이 인디케이터는 스마트 머니 컨셉트에 중점을 두어 대형 기관의 거래 방식을 제공하고 이동을 예측하는 데 도움을 줍니다.  특히 유동성 분석에 뛰어나 기관이 어떻게 거래하는지 이해하는 데 도움을 줍니다. 시장 트렌드를 예측하고 가격 변동을 신중하게 분석하는 데 탁월합니다. 귀하의 거래를 기관 전략에 맞추어 시장의 동향에 대해 더 정확한 예측을 할 수 있습니다. 이 인디케이터는 시장 구조를 분석하고 중요한 주문 블록을 식별하고 다양
ARIPoint
Temirlan Kdyrkhan
ARIPoint is a powerful trading companion designed to generate high-probability entry signals with dynamic TP/SL/DP levels based on volatility. Built-in performance tracking shows win/loss stats, PP1/PP2 hits, and success rates all updated live. Key Features: Buy/Sell signals with adaptive volatility bands Real-time TP/SL/DP levels based on ATR Built-in MA Filter with optional ATR/StdDev volatility Performance stats panel (Success, Profit/Loss, PP1/PP2) Alerts via popup, sound, push, or email Cu
Btmm state engine pro
Garry James Goodchild
5 (2)
Get the user guide here  https://g-labs.software/guides/BTMM_State_Engine_Welcome_Pack.html BTMM State Engine Pro — the   all-in-one Banks   & Institutions Market Maker indicator for Meta Trader 5. Built for   BTMM traders who follow the Asian   session breakout methodology with Kill Zone timing , level stacking, peak formation detection , and multi-pair scanning — all   from a single chart. Combines   a full BTMM State Engine   with a built-in multi-pair Scanner dashboard, eliminating the need
OmniSync Projection
Antonio-alin Teculescu
5 (1)
Chronos Fractal Engine is an innovative price projection indicator for MetaTrader 5, designed to transform your technical analysis by intelligently identifying and projecting historical price patterns. Built upon an advanced correlation algorithm and the fractal principles of the market, this powerful tool visualizes potential future price movements, giving you a unique edge in your trading decisions. What is Chronos Fractal Engine? At its core, the Chronos Fractal Engine employs a sophisticat
Trend Forecaster
Alexey Minkov
5 (7)
The Trend Forecaster indicator utilizes a unique proprietary algorithm to determine entry points for a breakout trading strategy. The indicator identifies price clusters, analyzes price movement near levels, and provides a signal when the price breaks through a level. The Trend Forecaster indicator is suitable for all financial assets, including currencies (Forex), metals, stocks, indices, and cryptocurrencies. You can also adjust the indicator to work on any time frames, although it is recommen
Matrix Arrow Indicator MT5
Juvenille Emperor Limited
5 (18)
매트릭스 화살표 표시기 MT5 는 외환, 상품, 암호 화폐, 지수, 주식과 같은 모든 기호/도구에 사용할 수 있는 100% 다시 칠하지 않는 다중 기간 표시기를 따르는 고유한 10 in 1 추세입니다.  Matrix Arrow Indicator MT5 는 다음과 같은 최대 10개의 표준 지표에서 정보와 데이터를 수집하여 초기 단계에서 현재 추세를 결정합니다. 평균 방향 이동 지수(ADX) 상품 채널 지수(CCI) 클래식 하이켄 아시 캔들 이동 평균 이동 평균 수렴 발산(MACD) 상대 활력 지수(RVI) 상대 강도 지수(RSI) 포물선 SAR 스토캐스틱 오실레이터 윌리엄스의 백분율 범위 모든 지표가 유효한 매수 또는 매도 신호를 제공하면 강력한 상승/하락 추세를 나타내는 다음 캔들/막대가 시작될 때 해당 화살표가 차트에 인쇄됩니다. 사용자는 사용할 표시기를 선택하고 각 표시기의 매개변수를 개별적으로 조정할 수 있습니다. 매트릭스 화살표 표시기 MT5는 선택한 표시기에서만 정보를 수
이 지표는 실제 거래에 완벽한 자동 파동 분석 지표입니다! 사례... 참고:   웨이브 그레이딩에 서양식 이름을 사용하는 데 익숙하지 않습니다. Tang Lun(Tang Zhong Shuo Zen)의 명명 규칙의 영향으로 기본 웨이브를   펜   으로 명명하고 2차 웨이브 밴드를   세그먼트   로 명명했습니다. 동시에, 세그먼트에는 추세 방향이 있습니다.   주요 추세 세그먼트에는   이름이 지정되지만(이 이름 지정 방법은 향후 노트에서 사용됩니다. 먼저 말씀드리겠습니다.) 알고리즘은 굴곡 이론과 거의 관련이 없으므로 그렇게 해서는 안 됩니다. 이는 나의 시장 분석을   통해 요약된 끊임없이 변화하고 복잡한 운영 규칙을   반영합니다. 밴드는 더 이상 사람마다 다르지 않도록 표준화되고 정의되었습니다. 인위적인 간섭의 드로잉 방법은 시장 진입을 엄격하게 분석하는 데 핵심적인 역할을 합니다. 이 지표를 사용하는 것은 거래 인터페이스의 미학을 개선하고 원래의 K-line 거래를
Introduction to X3 Chart Pattern Scanner X3 Cherart Pattern Scanner is the non-repainting and non-lagging indicator detecting X3 chart patterns including Harmonic pattern, Elliott Wave pattern, X3 patterns, and Japanese Candlestick patterns. Historical patterns match with signal patterns. Hence, you can readily develop the solid trading strategy in your chart. More importantly, this superb pattern scanner can detect the optimal pattern of its kind. In addition, you can switch on and off individu
소개       Quantum Breakout PRO   , 브레이크아웃 존 거래 방식을 변화시키는 획기적인 MQL5 지표! 13년 이상의 거래 경험을 가진 숙련된 트레이더 팀이 개발한       퀀텀 브레이크아웃 PRO       혁신적이고 역동적인 브레이크아웃 존 전략으로 거래 여정을 새로운 차원으로 끌어올리도록 설계되었습니다. Quantum Breakout Indicator는 5개의 이익 목표 영역이 있는 브레이크아웃 영역의 신호 화살표와 브레이크아웃 상자를 기반으로 한 손절 제안을 제공합니다. 초보자 거래자와 전문 거래자 모두에게 적합합니다. Quantum EA 채널:       여기를 클릭하세요 중요한! 구매 후 설치 매뉴얼을 받으려면 개인 메시지를 보내주십시오. 추천: 기간: M15 통화쌍: GBPJPY, EURJPY, USDJPY,NZDUSD, XAUUSD 계정 유형: 스프레드가 매우 낮은 ECN, Raw 또는 Razor 브로커 시간: GMT +3 중개인 :
PZ Divergence Trading MT5
PZ TRADING SLU
3.71 (7)
Unlock hidden profits: accurate divergence trading for all markets Tricky to find and scarce in frequency, divergences are one of the most reliable trading scenarios. This indicator finds and scans for regular and hidden divergences automatically using your favourite oscillator. [ Installation Guide | Update Guide | Troubleshooting | FAQ | All Products ] Easy to trade Finds regular and hidden divergences Supports many well known oscillators Implements trading signals based on breakouts Displays
ACB Breakout Arrows MT5
KEENBASE SOFTWARE SOLUTIONS
5 (1)
ACB Breakout Arrows 지표는 특별한 돌파 패턴을 감지하여 시장에서 중요한 진입 신호를 제공합니다. 이 지표는 차트를 지속적으로 스캔하면서 한 방향으로 움직임이 자리 잡을 때를 포착하여 큰 움직임 직전에 정확한 진입 신호를 제공합니다. 다중 종목 및 다중 시간대 스캐너는 여기에서 확인하세요 - ACB Breakout Arrows MT5용 스캐너 핵심 기능 지표가 자동으로 손절(Stop Loss) 및 익절(Take Profit) 수준을 제공합니다. 모든 시간대의 돌파 신호를 추적하는 MTF 스캐너 대시보드 포함. 데이 트레이더, 스윙 트레이더 및 스캘퍼에게 적합합니다. 신호 정확도를 높이기 위해 최적화된 알고리즘 사용. 손익분기점 또는 빠른 수익 목표를 위한 특별한 라인 (Quick Profit Line) 제공. 승률, 성공 비율, 평균 수익 등의 성과 분석 지표 제공. 재도색 없음. 신호는 고정되어 신뢰할 수 있습니다. 거래 확인 - ACB Trade Filter 지
Shock Pullback
Suleiman Alhawamdah
5 (1)
간단히 말해, 현재 캔들 옆에 흰색 숫자(‘핍’이라고 불림)의 움직임이 나타나기 시작하면 거래를 시작할 수 있습니다. 흰색 ‘핍’은 현재 매수 또는 매도 거래가 활성화되어 있으며 흰색으로 표시된 것처럼 올바른 방향으로 움직이고 있음을 나타냅니다. 흰색 핍의 움직임이 멈추고 정적인 녹색으로 바뀌면 이는 현재 모멘텀의 종료를 의미합니다. 숫자의 녹색은 매수 또는 매도 거래를 통해 얻은 총 수익을 ‘핍’ 단위로 나타냅니다. 또한, 인디케이터 내의 다른 고급 전문 분석 도구를 활용하여 거래를 시작할 수 있습니다. 인디케이터에 표시되는 신호와 색상을 관찰함으로써 높은 정확도로 수많은 스캘핑 기회를 포착할 수 있습니다. 테스트 중이거나 실시간 차트에서 인디케이터를 충분히 이해하는 것이 중요합니다. 대부분의 외환 시장에 적합: 금 거래 및 인기 있는 지수 시장(Dow Jones, S&P 500, Nasdaq, DAX 등), 그리고 EUR/USD, GBP/USD, USD/JPY 등 강력한 통화쌍
Currency Strength Dashboard Pro
Anastasia Danilova
5 (1)
Currency Strength Dashboard Pro MetaTrader 5 를 위한 실시간 통화 강도 분석 전문 대시보드 입니다. 이 지표는 8개의 주요 통화 (EUR, USD, GBP, JPY, CHF, AUD, CAD, NZD)의 강도를 계산하고, 28개의 통화쌍 을 동시에 여러 시간 프레임에서 분석하여 표시합니다. 이 대시보드는 트레이더가 추가 계산이나 여러 차트 간 전환 없이 한눈에 시장 전체 상황을 파악 할 수 있도록 해줍니다. 계산 방법 이 지표는 고급 수학적 통화 강도 분석 방법 을 기반으로 합니다. 이는 유사한 지표에서 널리 사용되는 RSI 기반 방법 보다 더 정확하고 객관적인 결과를 제공합니다. 이 방법은 28개의 모든 통화쌍 간의 관계를 동시에 분석 하여 시장에서 실제로 형성되는 힘의 균형을 보다 명확하고 편향 없이 보여줍니다. 실시간 대시보드 메인 테이블에는 8개의 통화 에 대한 전체 데이터가 표시됩니다. Rank (순위) — 전체 강도 기준 통화 순위, 1
Ace Trend
Mikhail Sergeev
5 (3)
우리는 당신에게 트렌드 거래의 세계에서 게임의 규칙을 변경하는 혁신적인 지표를 제시한다. 이 표시기는 성능을 재고하고 거래 경험을 전례없는 높이로 높이도록 설계되었습니다. 우리의 표시기는 경쟁 업체와 차별화 된 고급 기능의 고유 한 조합을 자랑합니다. "실제 가격 요인"의 첨단 기술은 가장 어렵고 휘발성 시장 상황에서도 탁월한 안정성을 보장합니다. 불안정한 패턴,깨진 지표 및 의식적이고 통제 된 거래에 작별 인사를하십시오. 표시기는 단지 아름다운 그림이 아닙니다! 지표는 거래자의 편으로 확률을 이동시켜 이익을 얻어야 합니다. 표시 신호(완전 자동 모드)에 따라 거래 결과에 익숙해: https://www.mql5.com/ko/signals/2339244 표시기는 형성된 막대에 다시 그리지 않습니다. 막대가 형성된 경우 표시기 판독 값은 변경되지 않습니다. 이 표시기는 모든 시간대에 작동합니다. 표준은 시간대입니다. 귀하의 의견은 매우 중요합니다! 당신은 어떤 질문,제안이,또는 당신의
필터:
리뷰 없음
리뷰 답변