Boss E Indicator

Boss E Indicator

Short description

Visual market-structure indicator for MetaTrader 5 combining accumulation ranges, liquidity sweeps, CISD confirmation, fair value gaps, retracement entries and a compact dashboard.

Full description

Boss E Indicator is a visual market-structure tool for MetaTrader 5. It converts a discretionary sequence often described as accumulation, manipulation and distribution into configurable, objective rules that can be applied consistently across charts.

The indicator is designed for traders who want to study the relationship between consolidation, stop liquidity, displacement and price imbalance without manually marking every element. It does not place or manage trades. It provides structured visual information that can support discretionary analysis.

Analytical sequence

Boss E Indicator searches for the following sequence:

1. An accumulation range is identified using a configurable lookback and an ATR-based maximum width.
2. Price trades beyond the range boundary and closes back inside, creating a potential liquidity sweep.
3. A closed candle confirms a Change in State of Delivery by crossing the relevant micro-structure.
4. A three-candle Fair Value Gap is formed during a sufficiently strong displacement.
5. Price returns to the Fair Value Gap according to the selected entry mode.
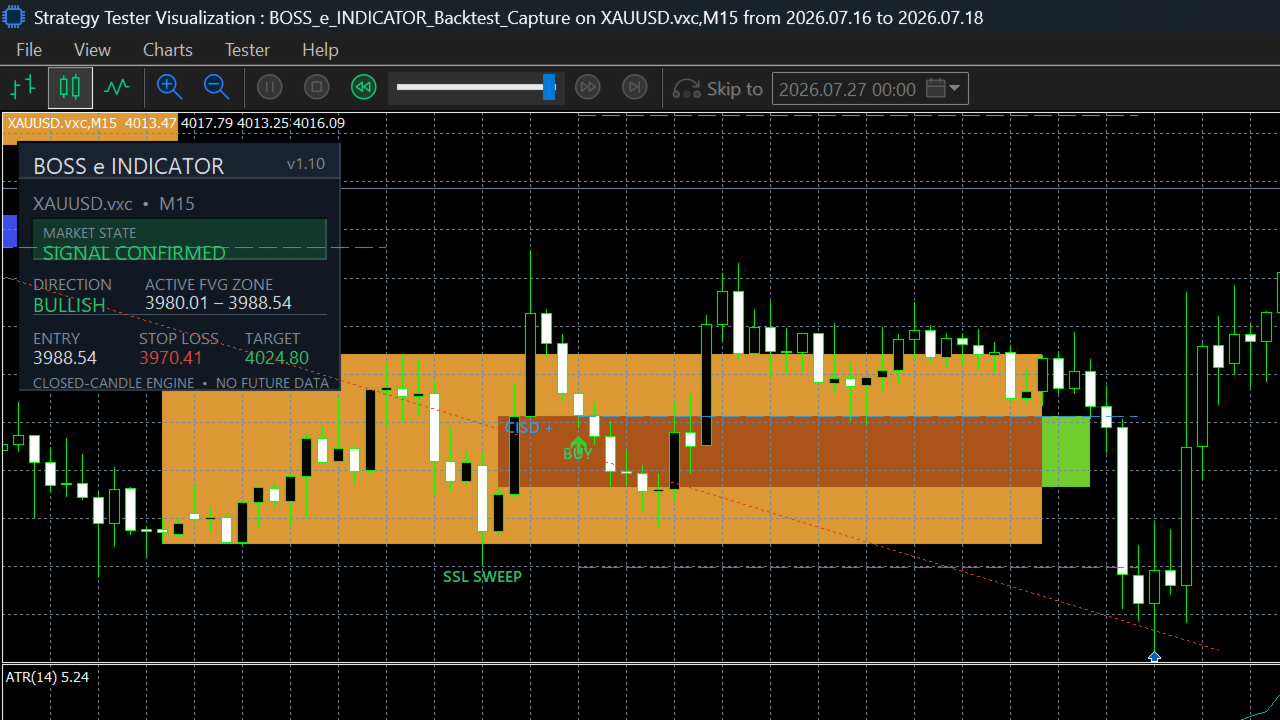
6. The indicator displays the setup direction, entry reference, invalidation level and risk-to-reward target.

Every signal is based on completed candles. The indicator does not require future bars to confirm historical signals.

Main chart features

- Accumulation range visualization
- Buy-side and sell-side liquidity sweep labels
- Bullish and bearish CISD labels
- Bullish and bearish Fair Value Gap zones
- BUY and SELL signal arrows
- Configurable entry reference
- Stop-loss reference beyond the sweep
- Risk-to-reward target projection
- Historical setup visualization
- Optional session filter
- Popup, sound, push and email alerts

Professional dashboard

The dashboard provides a compact summary of the most recent detected structure:

- Current symbol and timeframe
- Market state
- Bullish, bearish or neutral direction
- Active Fair Value Gap boundaries
- Entry reference
- Stop-loss reference
- Target reference
- Setup status, including waiting, confirmed, target reached or invalidated

The panel uses an opaque layered design so that chart annotations do not interfere with its text. Its position, colors and visibility can be adjusted from the inputs.

Entry modes

The indicator provides three entry interpretations:

First Touch

A setup is triggered when price first overlaps the Fair Value Gap.

Midpoint

A setup is triggered when price reaches the 50 percent level of the Fair Value Gap.

Close Inside

A setup is triggered only when a completed candle closes inside the Fair Value Gap.

These modes allow the trader to choose between an earlier, more responsive reference and a more conservative closed-candle confirmation.

Detection inputs

Accumulation Lookback

Controls how many completed candles are used to define the potential range.

Maximum Range Width

Limits the accumulation range relative to ATR. This makes the range definition adaptive to the volatility of each symbol.

ATR Period

Controls the volatility measurement used by the range and displacement filters.

Structure Lookback

Determines how much micro-structure is evaluated for CISD confirmation.

Confirmation Window

Defines the maximum number of candles allowed between the liquidity sweep and CISD.

FVG Search Window

Defines the maximum number of candles allowed between CISD and Fair Value Gap formation.

Entry Expiry

Invalidates an untouched Fair Value Gap after the selected number of candles.

Minimum Displacement

Requires the Fair Value Gap candle to have a minimum range relative to ATR.

Minimum FVG Size

Filters imbalances that are smaller than the selected number of points.

Trade-map inputs

The trade map is intended as a visual planning reference.

- Risk-to-reward target multiplier
- Stop buffer beyond the sweep
- Entry, stop and target line visibility
- Fair Value Gap visibility
- Accumulation range visibility
- Forward projection length

The displayed values are analytical references. They are not orders and do not modify the trading account.

Signal filters

Bullish and bearish setups can be enabled independently. An optional broker-time session filter can restrict liquidity sweeps to a chosen trading window. Overnight sessions are supported when the start hour is later than the end hour.

Alerts

Alerts are generated when a newly closed candle confirms an entry signal. Available channels include:

- MetaTrader popup alert
- Sound alert
- Mobile push notification
- Email notification

Push and email alerts require the corresponding MetaTrader terminal settings to be configured by the user.

Suggested workflow

1. Apply the indicator to the desired symbol and timeframe.
2. Begin with the default settings.
3. Review historical examples and confirm that the detected ranges match the characteristics of the selected market.
4. Choose the preferred Fair Value Gap entry mode.
5. Adjust the session filter if analysis is limited to a specific market session.
6. Use the visual entry, invalidation and target references as part of a broader trading plan.
7. Forward-test the configuration before using it in a live decision-making process.

Timeframe considerations

Lower timeframes generally produce more signals and more market noise. Higher timeframes produce fewer signals and may require a longer historical period. The same parameters should not be assumed to behave identically on every symbol or timeframe.

Testing performed during development found that XAUUSD M15 produced a practical balance between signal frequency and selectivity under the tested configuration. This is a historical development observation, not a forecast or a guarantee of future results.

Important limitations

Boss E Indicator does not identify institutional orders or private order-book information. Terms such as accumulation, liquidity sweep and Fair Value Gap are represented through mathematical price-action rules.

The indicator does not guarantee that a sweep will reverse, that a Fair Value Gap will be respected or that a displayed target will be reached. Market conditions, spread, slippage, news, execution quality and parameter selection can materially affect trading outcomes.

This product is an analytical indicator. It does not open, modify or close positions.

Recommended starting configuration

- Entry mode: First Touch
- Accumulation lookback: 20 candles
- Maximum range width: 5 ATR
- ATR period: 14
- Structure lookback: 5 candles
- Sweep-to-CISD window: 8 candles
- CISD-to-FVG window: 6 candles
- Entry expiry: 20 candles
- Minimum displacement: 0.8 ATR
- Target reference: 2.0 R

These values are starting points rather than universal settings.

Frequently asked questions

Does the indicator trade automatically?

No. Boss E Indicator is a visual analytical indicator and does not send trade requests.

Are signals based on closed candles?

Yes. Entry arrows and alerts are confirmed after the relevant candle has closed.

Can it be used on symbols other than gold?

Yes. The core range and displacement filters adapt through ATR. Point-based Fair Value Gap and stop-buffer inputs may need adjustment for symbols with different price formats.

Why are there no signals on some higher timeframes?

The complete sequence is selective. Higher timeframes may require more history, a wider range threshold or a longer confirmation window.

Can individual chart elements be hidden?

Yes. The accumulation range, Fair Value Gap zones, trade levels and dashboard can be enabled or disabled independently.

Does it use DLL files or external services?

No. The indicator is contained in one EX5 file and does not require DLL calls, WebRequest access or third-party services.

Risk notice

Trading financial instruments involves risk. Historical chart behavior and strategy-tester observations do not guarantee future performance. Use the indicator as one component of an independently evaluated trading process.

추천 제품
The  OBV MTF  is an Enterprise-grade On-Balance Volume indicator that transforms standard OBV into a complete trading system. It combines gradient-aware momentum analysis, divergence detection, multi-timeframe alignment, and dynamic customisable midpoint-filtering in a single intuitive professional volume analysis tool. Core Features 1. 5-State Momentum Engine Aqua (Strong Bullish) : OBV slope rising with positive acceleration SteelBlue (Weak Bullish) : OBV rising but losing momentum Gray (Neutr
ULTIMATE RSI PRO X-TREME: MULTI-FILTER REVERSAL SYSTEM MT5 Welcome to the most advanced, highly customizable, and powerful RSI-based indicator available on the MQL5 Market! The "Ultimate RSI Pro X-Treme" (RSI TVKU) is not just another standard Relative Strength Index indicator. It is a complete, all-in-one trading system designed for serious tr
RoboTick Signal
Mahir Okan Ortakoy
Hello, In this indicator, I started with a simple moving average crossover algorithm. However, in order ot get more succesfull results, I created different scenarios by basin the intersections and aptimized values of the moving averages on opening, closing, high and low values. I am presenting you with the most stable version of the moving averages that you have probably seen in any environment. We added a bit of volume into it. In my opinion, adding the Bollinger Band indicator from the ready-
Please feel free to join this Telegram group where users can share their strategies and settings that work for them using this indicator --> t.me/MTFMACS ALSO AVAILABLE ON TRADINGVIEW The MTFMACS family is now available on TradingView for users who prefer charting on that platform. Contact me via the Telegram group for direct access. ————————————————————————————————— BEFORE YOU PURCHASE — PLEASE READ A free version of this indicator is available. Please purchase this paid version only if you
SnR Smart Eco2
Syamsurizal Dimjati
SUPPORT & RESISTANCE (S&R) Smart Ecosystem Support & Resistance Detection automatically identifies price zones where buying or selling pressure has repeatedly appeared in the past. Zones are built using price reaction strength, fractal behavior, ATR-based zone width, and historical validation. This module provides: Dynamic support and resistance zones Zone classification (weak, untested, verified, proven, turncoat) Optional zone merging and extension Visual clarity with theme-based or custom col
Pattern Builder Pro — MetaTrader 5용 커스텀 스윙 패턴 스캐너 Pattern Builder Pro는 트레이더가 원하는 스윙 패턴을 직접 손으로 그리고, Market Watch의 모든 심볼을 여러 타임프레임에 걸쳐 통계적으로 유사한 가격 형태를 스캔할 수 있게 해주는 MetaTrader 5 인디케이터 겸 마켓 스캐너입니다. 헤드앤숄더, 삼각형, 플래그 등 고정된 형태에 국한된 기존 차트 패턴 인디케이터와 달리, 이 MT5 패턴 인식 도구는 스윙 포인트 수와 형태에 제한 없이 자신만의 프라이스 액션 패턴을 정의할 수 있으며, Dynamic Time Warping(DTW)과 Procrustes 분석을 포함한 11개 가중치 지표로 구성된 유사도 엔진을 통해 실시간으로 일치하는 패턴을 찾아냅니다. 주요 기능: XY 그리드 기반의 인터랙티브 패턴 드로잉 보드 — 픽셀 단위로 스윙 포인트 배치 다중 지표 유사도 엔진: 기하학적 형태, 각도 시퀀스, 기울기, 되돌림 비율
Fibo Shadow
Robby Suhendrawan
Fibo Shadow (FISH) – The Precision Entry & Zero Floating Indicator for MT5 (피보 섀도우(FISH) – MT5용 정밀 진입 및 제로 플로팅 지표) Fibo Shadow로 정밀 트레이딩의 기술을 마스터하세요. 시장 진입 위치를 추측하는 데 지치셨나요? 넓은 스탑 로스로 고생하고 "완벽한" 진입을 놓치고 계신가요? 고확률 피보나치 되돌림 진입을 찾는 과정을 자동화하도록 설계된 전문가용 지표인 Fibo Shadow (FISH) 를 만나보세요. Fibo Shadow는 단순한 피보나치 도구가 아닙니다. 시장 피봇을 식별하고 기관 트레이더가 진입할 가능성이 가장 높은 "골든 존"을 투영하는 동적 프라이스 액션 엔진 입니다. 트레이더가 Fibo Shadow를 선택하는 이유 100% 논리페인트 (Non-Repaint): 신호가 플롯되고 피보 존이 생성되면 그대로 유지됩니다. 과거 분석 및 전략 백테스팅을 신뢰할 수 있습니다. "제로 플로팅
Identify where the "Big Players" are positioned. The Sniper POC Tracker is a professional-grade Volume Profile indicator designed to reveal the Point of Control (POC)—the price level where the most volume has been traded. In SMC trading, the POC acts as a magnetic zone for liquidity and a critical level for institutional decision-making. Key Features: Dynamic POC Tracking: Real-time calculation of the most significant volume level based on a custom lookback period. Institutional Insight: Visuali
A dual-timeframe trend engine with volume-weighted divergence and market structure confluence. Volume Divergence Pro plots two linear-regression trend readings — a fast one and a slow one — and colors each by whether the volume actively participating in that move is building or fading. On top of that trend picture, it detects regular and hidden divergences between price and momentum, and can require those divergences to agree with the prevailing market structure before showing them. Built for tr
CRT + Volume Profile  Candle Range Theory levels on several timeframes, filtered by the previous session's volume profile, with lower-timeframe entries (CISD / MSS) and strips of higher-timeframe candles drawn right of price. One indicator for the whole CRT workflow: where the range is, whether the sweep happened at a level that matters, and where the entry shift is. HOW THE CRT MODEL IS DETECTED - C1 is the range candle. Its high and low become CRT H and CRT L, with the 0.5 level between the
Gf Breakout
Kayode George Absi
A ZigZag indicator for MetaTrader 5 that finds swing highs and lows, spots W-bottom and M-top patterns, and gives a BUY or SELL signal when the second leg of a pattern forms at an H1 swing point and price breaks the trendline. 1. Key advantages See the structure at a glance. Clear red ZigZag lines join the major swings, with a down arrow on every swing high and an up arrow on every swing low. Trade with the higher timeframe. On M1, M5 or M15, a signal only appears when the second leg sits on an
제품명:   Breakthrough Tracker 트레이딩 시스템 핵심 포지셔닝 본 시스템은 수년간의 실전 트레이딩 경험을 바탕으로, 다양한 시장 환경에서 지속적으로 개선하고 최적화한 결과물입니다. 근본적인 목적은 방향성이 없는 횡보장에서 잦은 진입으로 인해 계좌가 잠식되는 만성적 문제점을 과감히 제거하는 데 있습니다. 핵심 로직은 한 문장으로 요약됩니다.   오직 돌파(breakout)에서만 매매하고, 절대 횡보(consolidation) 구간에는 참여하지 않는다.   복잡한 기술적 지표의 중첩을 배제하고, 의사 결정 과정을 간결하고 규칙 기반이며 반복 가능한 프레임워크로 압축하여, 어떤 시장 환경에서도 명확한 트레이딩 시각을 유지할 수 있도록 설계되었습니다. 적합 상품 및 시간대 본 시스템은 현물 금(XAUUSD) 및 주요 외환 통화쌍(EURUSD, GBPUSD, USDJPY 등)에 깊이 최적화되어 있으며, 여러 시간대에서도 호환됩니다. 단기 당일 매매(단타) 트레이더라면  
SEE WHERE PRICE IS !!   Multi-Period High & Low Zones  가격의 좌표를 보라 !! 가격이 어디에 있는지 모르면 , 어떤 전략도 의미가 없다 . B2U High & Low Price Zone does not change the market. It changes how you see it. B2U Market State System Part of the B2U Market State System If you don’t know where price is, no strategy really matters. B2U High & Low Price Zone visualizes multi-period high / low structures and the current price gap in one clean, intuitive view. B2U High & Low Price Zone 은 여러 시간 축의 최고가 · 최저가 구조와  현재 가격의 위치 (Gap
SMC Market Structure PRO — Order Blocks, FVG, Liquidity & Confluence Zones Stop guessing. Start reading the market the way the big players see it. SMC Market Structure PRO automatically detects smart money zones of interest on your chart — Order Blocks, Fair Value Gaps (FVG) and time-based imbalances — and highlights Confluence Zones where all three types of structure overlap. That is exactly where price reacts most often. This is a complete market structure analysis tool based on the Smart Mone
RelativeVolume
Richard Barile
Relative Volume (RVOL) Indicator See When Volume Really Matters Not all volume is equal. The Relative Volume (RVOL) Indicator helps you quickly identify when the market is experiencing unusually high trading activity compared with its recent average. Instead of simply showing how much volume is trading, RVOL puts current volume into context—making it easier to spot moments when buyers or sellers may be becoming more active. Key Features Identify High-Volume Bullish Moves Quickly spot candles
RSIScalperPro
PATRICK WENNING
RSIScalperPro를 소개합니다 - 메타트레이더 5용 RSI 기반의 혁신적인 인디케이터로, 1분 차트에서의 스캘핑에 최적화되어 있습니다! RSIScalperPro를 사용하면 정확한 진입 및 청산 신호를 제공하는 강력한 도구를 손에 넣을 수 있습니다. RSIScalperPro는 서로 다른 두 가지 RSI 지표를 사용하여 과매수 및 과매도 레벨에 대한 명확한 신호를 제공합니다. 2개의 RSI의 시간 프레임 및 제한 값을 원하는 대로 조정하여 트레이딩 전략에 최적화된 결과를 얻을 수 있습니다. 차트 상의 개별 화살표는 거래 진입 및 청산 타이밍을 쉽게 파악하는 데 도움이 됩니다. 또한 RSIScalperPro의 특징 중 하나는 사용자 정의 가능한 3개의 이동 평균선입니다. 이를 통해 트렌드의 방향을 판단하고 강력한 거래 신호를 확인하는 데 도움이 됩니다. 이를 통해 조기에 트렌드를 감지하고 수익성 높은 거래에 참여할 수 있습니다. 뿐만 아니라 RSIScalperPro는 새로운 거래
BBands PMO
Norio Takahashi
The indicator allows you to simplify the interpretation of signals produced by the classical MACD indicator.  It is based on the double-smoothed rate of change (ROC).  Bollinger Bands is made from EMA line.  The indicator is a logical continuation of the series of indicators using this classical and efficient technical indicator. The strength of the trend is determined by Bands and main line. If the bands width are smaller than the specified value, judge it as suqueeze and do not recommend tra
Dragon Scale
Paulus Femi Leunufna
DRAGON SCALE User Guide Indicator Visualization The DRAGON SCALE indicator displays several visual elements on the chart: Scale Zone – Displayed as purple areas (accumulation zones) and red areas (distribution zones) surrounding the pivot level. Lifebeat Signal – Appears as an arrow below the candle when the price enters a critical zone. The color of the arrow indicates the direction (green for bullish, red for bearish, yellow for neutral). Entry Countdown – Appears as an arrow above the cand
Volume Profile for MetaTrader 5 Price movement alone does not explain where the market is actually traded . What matters is where volume is built and how these areas shift over time. This Volume Profile displays the volume distribution directly on the chart , making it clear which price levels were accepted by the market and where rejection occurred. This allows structurally relevant zones to be identified and integrated into individual decision-making processes. The tool is designed for high pe
FVG - Fair Value Gap The FVG - Fair Value Gap is an advanced MQL5 indicator designed for traders who utilize institutional order flow and Smart Money Concepts to identify market inefficiencies. This indicator automatically detects and highlights Fair Value Gaps (FVGs) on your chart, providing a clear visual representation of potential support and resistance zones, reversal points, and high-probability trading setups. Key Features: Automated FVG Detection:   The indicator automatically identifie
There is a strong correlation between tick volume and real volume.  This is important for 2 reasons: Real volume is a very important indicator because, among many other benefits, it provides strong confirmations of the emergence/dissipation of trends. Real volume is not available in Forex, instead, one has to make do with tick volume. Unfortunately, tick volume is highly broker dependent.  Additionally, it is often not used effectively to define indicators.  Virtually all indicators that use
Trend Pulse Apex
Camila Bernardez Camero
Trend Pulse Apex — 패턴 인식 + 트렌드 필터 + 모멘텀 필터 (리페인트 없음) Trend Pulse Apex는 높은 확률의 캔들 패턴을 감지하여 실시간 트렌드 및 모멘텀 분석으로 확인합니다. 닫힌 봉에만 고정된 화살표와 명확한 레이블을 표시하여 리페인트나 지연 없이 정확한 신호를 제공합니다. 주요 기능 • 패턴 인식: 엄격한 시가/고가/저가/종가 조건을 평가하여 Shooting Stars, Engulfings, Stars, Dojis, Hammers, Piercing Lines, Dark Cloud Covers 등 10가지 이상의 고급 일본식 캔들 패턴을 식별합니다. • 트렌드 필터: 내장된 ADX 모듈이 타임프레임에 따라 자동 조정되어 강세 추세와 횡보장을 구분하며, 차트에 “Weak” 또는 “Strong” 상태를 표시합니다. • 모멘텀 오버레이: 설정 가능한 RSI 수치가 트렌드 레이블 옆에 표시되어 과매수/과매도 구역을 강조하고 진입 타이밍을 최적화합니다.
Trend Pro is a next-generation, professional-grade trend-following indicator engineered for MetaTrader 5. Built upon a volume-weighted momentum algorithm (MFI/RSI) and dynamic volatility bands (ATR), this tool extracts the dominant market trend while filtering out the noise of choppy consolidation zones. Unlike standard indicators that clutter your chart with messy signals, Trend Pro was coded from the ground up for algorithmic precision, 100% non-repainting signals, and a premium visual experie
기관 거래량 분석 도구 [tambangEA] 문제점 대부분의 트레이더는 시장을 분석하기 위해 너무 많은 도구를 사용합니다. 거래량 지표, 가중평균거래량(VWAP) 지표, 지지/저항 지표, 모멘텀 지표, 그리고 거래 맥락 분석 도구까지. 그 결과는 대개 같습니다. 차트가 복잡해지고, 신호가 혼합되어 의사 결정이 느려지며, 진입 시점이 늦어집니다. 표준 거래량 분석 도구는 중요한 부분을 간과합니다. 시장 활동은 보여주지만, 다음과 같은 정보를 명확하게 제공하지 못합니다. 시장이 가격을 수용하는 지점, 가치가 집중된 지점, 불균형이 발생하는 지점, 돌파 압력이 실제로 존재하는지 여부, 그리고 현재의 위험 조건이 추세 지속을 지지하는지 아니면 반전을 경고하는지 여부. 전문 트레이더에게 이는 실질적인 문제로 작용합니다. 정보는 너무 많지만, 구조는 부족합니다. 해결책 기관 거래량 분석 도구 [tambangEA]는 시장 구조를 명확한 시각적 의사 결정 프레임워크로 전환하기 위해 개발되었습
The Effort and Result indicator is based on the work of Karthik Marar; a volume spread analysis trader. It compares a price change (Result) to the volume size (Effort) for a certain period.  By comparing the effort and result, we can get more information about the future price movement. Both values are normalized and converted to a scale of 0 - 100 % based on a selectable look-back period. This indicator is also known as the Effort Index. The law of effort and result The law of effort vs. res
Apex Heat Zone
Alier Nunez Fonseca
표시기는 현재 시세를 작성하여 과거 시세와 비교할 수 있으며 이를 바탕으로 가격 변동을 예측합니다. 표시기에는 원하는 날짜로 빠르게 이동할 수 있는 텍스트 필드가 있습니다. 옵션: 기호 - 표시기가 표시할 기호 선택. SymbolPeriod - 지표가 데이터를 가져올 기간 선택. IndicatorColor - 표시기 색상. HorisontalShift - 지시자가 그린 따옴표를 지정된 막대 수만큼 이동합니다. Inverse - true는 인용 부호를 반대로, false - 원래 보기를 반전합니다. ChartVerticalShiftStep - 차트를 수직으로 이동합니다(키보드의 위/아래 화살표). 다음은 날짜를 입력할 수 있는 텍스트 필드의 설정으로, '엔터'를 누르면 즉시 이동할 수 있습니다.
TradeAQ
Guo Sheng Zhao
LuoMo Volume & Price Structure 8.98 A multi-function chart indicator for   MetaTrader 4 and MetaTrader 5 , designed to display key volume, volatility, sentiment, and price-structure information directly on the main chart. Main Features Volume and price-based Support & Resistance Volume spike and exhaustion signals ATR volatility expansion alerts Volume Profile with HVN and LVN Bullish and bearish sentiment distribution Developing or fixed POC VAH and VAL levels Supply and Demand zones Volume-wei
Triple Machine
Thomas Bradley Butler
Build your own model to predict averages of turning points of the Triple Moving Average Oscillator. It is simple.  Rate me with stars. Just load the indicator Triple Moving Average Oscillator in you platform and choose the period.  Scroll through to observe the averages of the highs and lows over a period of time. Add the levels for a buy and a sell on the Triple Machine and this will show the average of highs and lows to look for buys and sell. You can load multiple copies with multiple levels.
SC MTF Didi MT5
Krisztian Kenedi
이중 라인 신호, 멀티 타임프레임 지원, 사용자 정의 시각 신호 및 구성 가능한 알림 시스템을 갖춘 DIDI 지표(3-MA 비율). 프리랜서 프로그래밍 서비스, 업데이트 및 기타 TrueTL 제품은 제 MQL5 프로필 에서 이용 가능합니다. 피드백과 리뷰를 매우 환영합니다! DIDI란? DIDI는 서로 다른 기간을 가진 세 개의 이동평균(MA) 간의 관계를 표시하는 비율 지표입니다: Curta(단기), Media(중기), Longa(장기). 지표는 Curta와 Longa MA를 Media MA로 나누어 두 개의 비율 라인을 계산하며, Media는 1.0의 기준 레벨로 기능합니다. DIDI는 빠른 이동평균과 느린 이동평균이 중간 기간 평균과 어떻게 관련되는지를 보여줌으로써 추세 강도와 잠재적 반전 지점을 식별하는 데 도움을 줍니다. 1.0 이상의 값은 MA가 기준선 위(강세)에 있음을, 1.0 미만의 값은 MA가 기준선 아래(약세)에 있음을 나타냅니다. Curta와 Longa 라
FREE
이 제품의 구매자들이 또한 구매함
Trend Sniper X
Sarvarbek Abduvoxobov
4.86 (43)
Trend Sniper X 는 트레이더가 추세 방향과 잠재적 반전 지점을 명확하고 정확하게 포착할 수 있도록 도와주는 MetaTrader 5용 멀티 타임프레임 추세 추종 지표입니다. MT4용: https://www.mql5.com/en/market/product/193245 가격 정보: 현재 가격은 프로모션 할인가이며, 향후 업데이트 및 새로운 기능이 출시됨에 따라 변동될 수 있습니다. 보너스 혜택: 본 지표 전용 무료 자동매매 Assistant EA를 받으시려면 구매 후 작성자에게 메시지를 보내주시기 바랍니다. Code2Profit 채널 멀티 타임프레임 분석으로 시장을 마스터하세요! Trend Sniper X로 승률을 극대화하는 방법: 핵심 규칙 및 세션 팁 기술 사양 플랫폼 MetaTrader 5 지표 유형 멀티 타임프레임 추세 지표 운용 타임프레임 모든 차트 타임프레임 지원, 독립적으로 선택 가능한 상위 타임프레임(M1–MN1) 주요 상품 외환, 금(XAUUSD) 및 기타 C
새로운 왕의 등장 - 인디케이터 + 주문 관리 표시(TP1 + TP2 + TP3) + 선택형 텔레그램 시그널 전송 기능 포함 (무료) (완전한 트레이딩 및 시그널 시스템) 골드를 위한 최고의 EA: Gold Slayer 이 인디케이터는 고급 전략, 사용자 지정 가능한 주문 관리 시스템, 그리고 엔벨로프 확장을 결합한 평균 회귀(mean reversion) 시스템을 포함하고 있습니다. 또한 RSI와 같은 여러 지능형 확인 필터를 통해 높은 확률의 반전 진입 구간을 포착하여 BUY 및 SELL 시그널을 제공합니다. 단순히 거래 방법만 배우는 것이 아니라, 여러 포지션을 효과적으로 관리하고 이전에 수익 중인 오픈 포지션으로 손실 거래를 커버하는 방법까지 익힐 수 있습니다. M5 전용으로 설계 및 최적화되었으며, 유동성이 풍부해 시그널이 더 깔끔하고 신뢰도 높은 BTCUSD와 XAUUSD에서 뛰어난 성능을 발휘합니다. 이 인디케이터는 ATR 기반으로 자동 계산된 진입가, 손절가, 익절가와
Smart Trend Trading System — MetaTrader 5 구매 후 MQL5에서 저에게 메시지를 보내시면 Smart Universal Expert Advisor를 무료로 받으실 수 있으며, 온라인 강좌, PDF 매뉴얼 및 비공개 그룹 이용 권한도 함께 제공됩니다. STTS는 추세 방향, 진입·청산 신호, 반전 구간, 주요 가격 수준을 차트에 모아 보여줍니다. 시스템을 참고해 수동으로 거래하거나, 별도의 호환 EA를 연결하여 선택한 설정에 따라 자동으로 거래를 실행할 수 있습니다. 하나의 시스템, 네 가지 트레이딩 접근법 STTS의 트레이딩 접근법은 크게 네 가지로 나뉩니다. • 스캘핑 — 단기 신호와 시장 움직임을 살펴봅니다. • 추세 매매 — 방향을 평가하고 추세 안에서 기회를 찾습니다. • 반전 매매 — 잠재적인 전환 구간과 방향 변화를 파악합니다. • 거래량 매매 — 거래량 기반 정보로 시장 활동을 평가합니다. 진입·청산 화살표, 추세 정보, 지지·저항 수
Zoryk Gold
Reda El Koutbane
4.76 (17)
ZORYK — MetaTrader 5용 XAUUSD 전문 신호 및 트레이드 플래닝 시스템 이런 경험이 있을 것입니다. 골드를 분석하고 진입을 기다린 뒤 마침내 포지션을 열었지만 가격이 곧바로 반대 방향으로 움직입니다. 너무 일찍 청산하거나 Stop Loss를 옮기거나 몇 초 동안 망설입니다. 그 후 시장은 내가 없이도 처음 예상했던 목표까지 정확히 움직입니다. 문제는 항상 방향이 아니었습니다. 진짜 문제는 불확실성이었습니다. 정확한 진입 위치를 몰랐습니다. 어느 지점에서 원래의 트레이드 아이디어가 무효가 되는지 몰랐습니다. 가까운 수익을 확보해야 할지 더 큰 움직임을 기다려야 할지 판단하기 어려웠습니다. 현재 setup이 정말 강한지 아니면 단지 새로운 거래를 억지로 찾고 있는지도 확신하기 어려웠습니다. 골드는 매우 빠르게 움직입니다. 명확한 계획이 없다면 좋은 분석도 몇 초 만에 나쁜 결정으로 바뀔 수 있습니다. ZORYK는 이 문제를 해결하기 위해 개발되었습니다.
M5 Sniper
MeanFX
5 (3)
당신의 트레이딩 우위를 한눈에 확인하세요! M5 Sniper 는 MeanFX의 새로운 지표입니다. 정확한 트레이딩 신호 와 적응형 TP/SL 레벨 을 결합하여, 결과적으로 가능한 최고의 통계적 트레이딩을 만들어냅니다! 5회 구매마다 가격이 인상되며, 다음 가격은 69$입니다. 구매 후 저에게 메시지를 보내주시면 팁/가이드와 보너스 EA를 제공해 드립니다. 무엇이 이 지표를 특별하게 만들까요? Gold XAUUSD에서 검증된 통계적 성과 ( 거의 모든 자산에서 작동 하며, 일관된 결과 없이 모든 것을 다루려고 하기보다는 하나의 타임프레임을 완전히 익히는 데 집중합니다) 각 심볼당 하루 1~8회의 트레이드 와 높은 승률을 제공하며, 모든 통계적 우위를 우리의 편으로 가져갑니다. 차트에는 확인된 BUY 및 SELL 신호만 표시됩니다. 각 트레이드에 대해 지표가 생성하는 적응형 TP 및 SL 레벨 평균 승률 75%+ 평균 Signal Ratio 최소 1.1+ 알람 및 알림이 휴대폰 으로도
SuperScalp Pro
Van Minh Nguyen
4.54 (37)
SuperScalp Pro - Professional Multi-Layer Confluence Scalping System SuperScalp Pro는 기존 Supertrend에 여러 지능형 확인 필터를 추가하여 기능을 강화한 고급 스캘핑 지표입니다. 잘못된 신호를 크게 줄이면서 성공 가능성이 더 높은 Buy/Sell 거래 기회를 식별하는 데 도움을 줍니다. 명확한 Buy 및 Sell 화살표가 차트에 직접 표시되며, ATR 기반 Stop Loss 및 Take Profit 레벨도 실시간으로 자동 계산됩니다. 구매 후 MQL5 메시지로 저에게 연락하시면 SuperScalp Pro Auto Trader EA를 무료로 받으실 수 있으며, 사용자 가이드와 비공개 그룹 이용 권한도 제공됩니다. 권장 설정 파일 다운로드: [Set File] 전체 문서는 제품 블로그에서 확인할 수 있습니다: [User Guide] 업데이트를 받으려면 공식 채널에 참여하세요: [Official Channel]
SMC Intraday Formula
VividMind Digital Solutions
5 (26)
먼저 솔직하게 말하겠습니다. 어떤 인디케이터도 단독으로 당신을 수익성 있게 만들어주지 않습니다. 누군가 그렇게 말한다면, 그는 당신에게 꿈을 파는 것입니다. 완벽한 매수/매도 화살표를 보여주는 모든 인디케이터는 완벽하게 보이도록 만들 수 있습니다 — 단지 올바른 과거 구간을 확대하고 승리한 거래만 캡처하면 됩니다. 우리는 그렇게 하지 않습니다.  SMC Intraday Formula는 도구입니다. 시장 구조를 읽고, 가장 높은 확률의 가격 구간을 표시하며, 현재 스마트 머니의 흐름이 어떻게 보이는지 아주 단순한 언어로 보여줍니다. 최종 결정은 여전히 당신이 합니다. 실행도 당신이 합니다. 하지만 이제는 희망이 아니라 정확성으로 거래하게 됩니다. 우리는 이 인디케이터를 지난 약 3년 동안 골드(XAUUSD) 및 주요 외환 통화쌍의 데이 트레이딩 스캘핑에 사용해 왔습니다. M1, M5, M15, M30에서 우리의 핵심 도구입니다. 이 도구는 미래를 예측하려 하지 않습니다 — 지금 형성
Entry Points Pro for MT5
Yury Orlov
4.52 (152)
전설이 돌아왔습니다: Entry Points Pro 10. MQL5 마켓 Top-3 자리를 3년간 지켜온 전설적인 지표의 재출시입니다. 두 버전 합산 600개 이상의 리뷰, 매일 이 지표로 거래하는 수천 명의 트레이더, 28,000회 이상의 데모 다운로드   MT4+MT5 . 지난 5년간 여러분이 남긴 리뷰를 하나도 빠짐없이 읽었고, 약속 대신 그 답을 버전 10에 담았습니다. 1999년부터 시장에서 활동하며 정직함과 자신의 평판, 그리고 고객을 소중히 여기는 개발자가 만들었습니다. Entry Points Pro의 진입 시그널은 절대 리페인팅되지 않습니다. 그리고 이번에는 개발자의 말뿐이 아니라 검증 가능한 사실입니다: 확정 시그널은 캔들 종가에서만 표시되며, 자동화 테스트에서 리페인팅 0건 이 확인되었습니다(EURUSD, XAUUSD, BTCUSD에서 2,486,568회의 불변조건 검사 — 위반 0건). 검증 방법은 공개되어 있으니 전략 테스터에서 직접 재현해 보실 수 있습니다.
GoldenX Entry MT5
VividMind Digital Solutions
5 (17)
GoldenX Entry는 MT5용 인디케이터로, 적응형 Smart Entry Trend 알고리즘, 신호 스코어링 시스템, 시장 레짐 감지 기능, 그리고 변동성 필터를 포함합니다. 각 신호에는 계산된 진입 레벨, 3개의 익절(TP1, TP2, TP3) 레벨, 그리고 손절(Stop-Loss) 레벨이 포함됩니다. 이 인디케이터는 다양한 시장 환경에 적응하도록 설계된 다중 분석 레이어 구조 위에 구축되어 있으며, 내장 최적화기와 통계 추적 시스템을 결합합니다. 또한 Risk-to-Reward(RR) 지표와 과거 거래 행동 기반의 정량 분석을 제공합니다. 시작은 간단합니다 — 선택한 타임프레임에서 최적화기를 실행한 뒤 차트에서 바로 인디케이터를 사용하면 됩니다. 핵심 기능 GoldenX Entry는 하나의 차트에서 신호 엔진, 트레이드 관리 기능, 그리고 과거 통계 추적을 통합합니다: - 내장 최적화기: 최적화기는 차트에서 원클릭으로 실행됩니다. 200개의 파라미터 조합을 두 단계 탐색
Auto Optimized SpeedAngle 은 지속적인 워크포워드 최적화(Walk-Forward Optimization, WFO)를 통해 곡선 적합(curve-fitting)을 제거한 기관 수준의 모멘텀 벡터화 시스템입니다. 시장 체제가 바뀔 때 성능이 떨어지는 정적 입력에 의존하는 대신, 이 지표는 표본 외(Out-of-Sample, OOS) 검증을 사용하여 매개변수를 동적으로 재보정하며, 표시되는 신호가 과거의 우연이 아닌 진정한 통계적 우위를 나타내도록 보장합니다. 핵심 기관용 프레임워크 워크포워드 최적화 엔진: 핵심 알고리즘은 수천 가지의 룩백(lookback) 및 임계값 조합을 지속적으로 스캔하며, 데이터를 인샘플(in-sample)과 표본 외(out-of-sample) 세트로 엄격하게 분리합니다. 미지의 데이터 환경에서 수학적 우수성이 증명된 경우에만 새로운 매개변수 구성을 채택합니다. 정량적 목적 함수: 순수한 총이익을 쫓는 대신, 최적화 엔진은 기관 수준의 안정성
ARIPoint
Temirlan Kdyrkhan
1 (4)
ARIPoint is a powerful trading companion designed to generate high-probability entry signals with dynamic TP/SL/DP levels based on volatility. Built-in performance tracking shows win/loss stats, PP1/PP2 hits, and success rates all updated live. Key Features: Buy/Sell signals with adaptive volatility bands Real-time TP/SL/DP levels based on ATR Built-in MA Filter with optional ATR/StdDev volatility Performance stats panel (Success, Profit/Loss, PP1/PP2) Alerts via popup, sound, push, or email Cu
Gann Made Easy MT5
Oleg Rodin
5 (12)
Gann Made Easy 는 mr.의 이론을 사용하여 최고의 거래 원칙을 기반으로 하는 전문적이고 사용하기 쉬운 Forex 거래 시스템입니다. W.D. 간. 이 표시기는 Stop Loss 및 Take Profit Levels를 포함하여 정확한 BUY 및 SELL 신호를 제공합니다. PUSH 알림을 사용하여 이동 중에도 거래할 수 있습니다. 구매 후 거래 방법 안내 및 유용한 추가 지표를 무료로 받으시려면 저에게 연락주세요! 아마도 Gann 거래 방법에 대해 이미 여러 번 들었을 것입니다. 일반적으로 Gann의 이론은 초보자 거래자뿐만 아니라 이미 거래 경험이 있는 사람들에게도 매우 복잡한 것입니다. Gann의 거래 방식은 이론적으로 적용하기 쉽지 않기 때문입니다. 나는 그 지식을 연마하고 Forex 지표에 최고의 원칙을 적용하기 위해 몇 년을 보냈습니다. 표시기는 적용하기가 매우 쉽습니다. 차트에 첨부하고 간단한 거래 권장 사항을 따르기만 하면 됩니다. 지표는 지속적으로 시장 분석
M1 Sniper MT5
Oleg Rodin
5 (7)
M1 SNIPER 는 사용하기 쉬운 거래 지표 시스템입니다. M1 시간대에 맞춰 설계된 화살표 지표입니다. 이 지표는 M1 시간대 스캘핑을 위한 단독 시스템으로 사용할 수 있으며, 기존 거래 시스템의 일부로도 사용할 수 있습니다. 이 거래 시스템은 M1 시간대 거래용으로 특별히 설계되었지만, 다른 시간대에도 사용할 수 있습니다. 원래는 XAUUSD와 BTCUSD 거래를 위해 이 방법을 설계했지만, 다른 시장 거래에도 유용하다는 것을 알게 되었습니다. 이 지표의 신호는 추세 방향과 반대로 거래될 수 있습니다. 저는 지표의 신호를 활용하여 양방향으로 거래할 수 있도록 돕는 특별한 거래 기법을 알려드립니다. 이 방법은 특별한 동적 지지선과 저항선 가격 영역을 활용하는 것을 기반으로 합니다. 구매하시면 M1 SNIPER 화살표 지표를 바로 다운로드하실 수 있습니다. 또한, 아래 스크린샷에 표시된 Apollo Dynamic SR 지표는 M1 SNIPER 도구를 사용하는 모든 사용자에게 무료로
Adaptive Price Action Engine 지표를 구매하면 EA(자동매매 프로그램)가 무료 멀티 타임프레임 기반 자기 최적화 추세 & 캔들 패턴 분석 시스템 시장은 끊임없이 변화하며, 모든 Price Action 패턴이 모든 시장 환경에서 동일한 가치를 가지는 것은 아닙니다. Adaptive Price Action Engine 은 변화하는 시장 환경에 적응할 수 있도록 설계되었으며, 추세 구조, 멀티 타임프레임 분석, 캔들 패턴 및 통계적 최적화 를 하나의 분석 프레임워크로 결합합니다. 두 가지 적응형 모드 Dual Alpha Trend Mode 낮은 타임프레임과 높은 타임프레임에서 적합한 Alpha Trend 파라미터를 자동으로 탐색하여, 최근 시장 움직임에 맞춰 추세 분석을 조정합니다. Candlestick + Alpha Mode Alpha Trend를 통한 시장 국면 분석과 22개의 상승 및 하락 캔들 패턴 을 결합합니다. 모든 패턴을 동일하게 취급하는 대신, 다양
Power Candles MT5
Daniel Stein
4.58 (12)
Power Candles V3 - 자체 최적화 강도 지표 파워 캔들 V3는 적용된 모든 차트에서 통화 및 상품의 강세를 실행 가능한 거래 계획으로 전환합니다. 단순히 캔들에 색상을 입히는 대신, 백그라운드에서 실시간 자동 최적화를 수행하여 현재 보고 있는 종목에 대한 최적의 손절매, 익절 및 신호 임계값을 제공합니다. 한 번의 클릭으로 실시간 거래에 적용할 수 있으며, 진입점, 손절매 및 익절 선이 정확한 가격에 맞춰 차트에 표시되고, 방향과 함께 알림이 발령됩니다. 이 도구는 Stein Investments 에코시스템의 일부입니다. 18개 이상의 도구와 함께 당신의 1대1 AI 트레이딩 멘토 Max.  항상 대기 중, 모든 인디케이터를 깊이 있게 이해, 무언가를 차근차근 생각해보고 싶은 순간에 도움을 줍니다.  https://stein.investments 에서 만나보세요 매 종가 바마다 3,000회 이상의 트레이딩 시뮬레이션. 9가지 강도 상태. 2가지 전략을 병렬로 테스트.
다음 업데이트 — 버전 2.52 곧 출시! [신규] 시장 분석 및 트레이딩 워크플로를 향상시키기 위해 설계된 4가지 주요 신규 기능을 기대해 주세요. 트레이딩 요구 사항을 충족하도록 설계된 4가지 새로운 기능으로 시장 분석을 한 단계 더 발전시킵니다. 다음 기능을 소개합니다: 1. TRADE OVERVIEW DASHBOARD 2. CONFLUENCE AT ZONE 3. STRONG & WEAK HIGH/LOW 4. OTE 1. TRADE OVERVIEW DASHBOARD 시장 전체 상황을 더 쉽게 파악할 수 있도록 도와주는 대시보드입니다. 트레이딩 의사결정을 지원하는 가이드를 제공하며, 하나의 화면에서 시장을 분석하고 체계적으로 트레이딩을 계획할 수 있도록 도와줍니다. 멀티 타임프레임 시장 개요 (Multi-Timeframe Market Overview) 시장 방향과 가격 구조를 더욱 명확하게 파악 시장 상황을 빠르게 확인 체계적인 시장 분석 및 진입 계획을 위한 가이드 2. CO
Boba Analysis Suite
Trade Ready Solutions LLC
5 (2)
Boba Analysis Suite Boba Analysis Suite는 MetaTrader 5용 분석 지표입니다. 시장 구조, 주요 가격 영역, 전반적인 시장 상황을 하나의 차트 화면에 통합하여 표시합니다. 트레이더이자 트레이딩 코치로서의 실무 경험을 바탕으로 개발되었으며, 시장 방향 평가, 주요 가격 수준 식별, 여러 시간대의 종합적인 분석 등 체계적인 분석 과정을 지원합니다. 시장 맥락을 고려한 분석 개별 신호의 의미는 시장 상황에 따라 달라집니다. Boba Analysis Suite는 현재 차트 상황을 더 넓은 시장 구조와 연결하고, 사전에 정한 규칙에 따라 매매 아이디어를 검토할 수 있도록 돕습니다. 주요 분석 기능은 다음과 같습니다. 추세 및 시장 구조: 시장 방향과 관련 구조적 맥락을 평가합니다. 주요 가격 영역 및 수준: 추가 분석이 필요한 중요한 영역을 차트에 시각적으로 표시합니다. 여러 시간대: 서로 다른 시간대의 정보를 통합하여 전반적인 시장 상황을 평가합니다.
FiboSniper Pro
Van Minh Nguyen
5 (4)
FiboSniper Pro – Multi-Filter Fibonacci System with Auto SL/TP and Control Panel FiboSniper Pro는 동적 Fibonacci Envelopes와 여러 확인 필터를 결합하여 선별된 Buy 및 Sell 신호를 생성하는 기술적 지표입니다. Fibonacci 레벨은 Moving Average와 ATR을 기반으로 계산된 후 ADX, EMA, RSI, ATR, Volume, Time 및 Candle 구조를 통해 필터링됩니다. 이 지표는 ATR 기반의 자동 Stop Loss 및 Take Profit 레벨을 차트에 직접 표시하며, 빠른 설정 조정을 위한 인터랙티브 Control Panel을 제공합니다. 구매 후 MQL5 메시지로 저에게 연락하시면 Auto Trader X를 무료로 받으실 수 있으며, 이 지표의 거래 신호를 자동화하는 방법에 대한 안내도 제공됩니다. User Guide 및 Set Files: [Click here
Tokyo mt5 Indicator
Vasiliy Strukov
5 (12)
Tokyo Indicator는 추세 방향, 잠재적 거래 신호 및 시장 상황을 명확하고 시각적으로 보여줍니다. 색상으로 구분된 계단식 추세선은 강세 구간(파란색)과 약세 구간(자홍색)을 명확히 구별해 줍니다. 추세가 전환될 때 나타나는 방향성 화살표는 잠재적인 매수 및 매도 기회를 강조하여 보여줍니다. 통합 대시보드는 현재 신호, 시장 성향(bias), 모멘텀, 변동성, 신호 품질 등의 정보를 한눈에 파악할 수 있도록 구성되어 있습니다. 이를 통해 트레이더는 별도의 패널을 오갈 필요 없이 가격 움직임(price action)과 지표의 데이터를 동시에 분석할 수 있습니다. 깔끔한 차트 화면과 간결한 시장 개요를 제공하는 Tokyo Indicator는 체계적인 추세 분석과 거래 결정을 지원합니다. 모든 시간대와 다양한 자산(특히 금)에서 활용할 수 있습니다. 추세 방향, 잠재적 거래 신호 및 시장 상황을 명확하고 시각적으로 보여줍니다. 색상으로 구분된 계단식 추세선은 강세 구간(파란색)
Trend Catcher ind mt5
Ramil Minniakhmetov
5 (18)
트렌드 캐처 인디케이터 트렌드 캐처 인디케이터는 개발자가 자체 개발한 맞춤형 적응형 트렌드 분석 지표들을 조합하여 시장 가격 움직임을 분석합니다. 단기적인 노이즈를 제거하고 근본적인 모멘텀 강도, 변동성 확대, 가격 구조 움직임에 집중하여 진정한 시장 방향을 파악합니다. 또한 이동 평균, RSI, 변동성 필터와 같은 맞춤형 지표들을 활용하여 가격을 평활화하고 트렌드를 필터링합니다. 실제 운영 모니터링 및 기타 제품은 다음 링크에서 확인하실 수 있습니다:   https://www.mql5.com/en/users/mechanic/seller 텔레그램에서는 EA나 설정 파일을 판매하지 않습니다. 사기이니 주의하세요. 모든 설정 파일은 블로그에서 무료로 제공됩니다. 중요! 구매 후 즉시 연락 주시면 사용 방법 및 보너스를 드립니다!
Gold Trend Coach MT5
Cristhian Alexander Gaibor Cuasquer
5 (2)
Gold Trend Coach는 MetaTrader 5용 골드(XAUUSD) 추세 지표로, 매수 및 매도 신호, 손절과 세 개의 익절 목표를 봉 마감 시 확정하며, 멀티 타임프레임 코치 대시보드와 휴대폰 및 Telegram 알림을 제공합니다. 런던과 뉴욕 세션의 M5 스캘핑과 M15 데이트레이딩을 위해 만들어졌습니다. Gold Trend Coach: 진입, 손절, 세 개의 목표가 있는 XAUUSD 골드 추세 신호. 출시 가격 $39, 처음 20개 한정, 이후 $59. 구매 후 메시지를 주시면 구매자 키트를 바로 보내 드립니다. 최악의 연속 손실을 차트 위에 그대로 보여 주는 골드 지표. 이 마켓의 모든 XAUUSD 지표는 자신의 승리 신호를 보여 줍니다. Gold Trend Coach는 손실 신호도 보여 줍니다. 빨간색으로 세고, 최악의 연속 손실과 순결과를 보기 좋은 것만이 아니라 모든 것을 세는 패널에 표시합니다. 신호가 손절에 닿으면 보입니다. 세 번 연속 손절에 닿아도 보입
Quantum TrendPulse
Bogdan Ion Puscasu
5 (26)
SuperTrend   ,   RSI   ,   Stochastic   의 힘을 하나의 포괄적인 지표로 결합하여 트레이딩 잠재력을 극대화하는 궁극의 트레이딩 도구   인 Quantum TrendPulse를   소개합니다. 정밀성과 효율성을 추구하는 트레이더를 위해 설계된 이 지표는 시장 추세, 모멘텀 변화, 최적의 진입 및 종료 지점을 자신 있게 식별하는 데 도움이 됩니다. 주요 특징: SuperTrend 통합:   주요 시장 추세를 쉽게 따라가고 수익성의 물결을 타세요. RSI 정밀도:   매수 과다 및 매도 과다 수준을 감지하여 시장 반전 시점을 파악하는 데 적합하며 SuperTrend 필터로 사용 가능 확률적 정확도:   변동성이 큰 시장에서 숨겨진 기회를 찾기 위해 확률적 진동   을 활용하고 SuperTrend의 필터로 사용 다중 시간대 분석:   M5부터 H1 또는 H4까지 다양한 시간대에 걸쳐 시장을 최신 상태로 유지하세요. 맞춤형 알림:   맞춤형 거래 조건이 충족되면
Neuro Poseidon MT5
Daria Rezueva
4.75 (52)
Neuro Poseidon is a new indicator by Daria Rezueva. It combines precise trading signals with adaptive TP/SL levels - creating best possible trades as a result! Message me and get  Neuro Poseidon Assistant  as a gift to automize your trading process! What makes it stand out? 1. Proven profitability on all assets and timeframes 2. Only confirmed BUY and SELL signals present on the chart 3. Adaptive TP & SL levels generated by the software for each trade 4. Easy to understand - suitable for al
Azimuth Pro
Ottaviano De Cicco
5 (7)
Azimuth Pro V2: Synthetic Fractal Structure and Confirmed Entries for MT5 Overview Azimuth Pro is a multi-level swing structure indicator by Merkava Labs . Four nested swing layers, swing-anchored VWAP, ABC pattern detection, three-timeframe structural filtering, and closed-bar confirmed entries — one chart, one workflow from micro-swings to macro-cycles. This is not a blind signal product. It is a structure-first workflow for traders who care about location, context, and timing. Halloween P
소개       Quantum Breakout PRO   , 브레이크아웃 존 거래 방식을 변화시키는 획기적인 MQL5 지표! 13년 이상의 거래 경험을 가진 숙련된 트레이더 팀이 개발한       퀀텀 브레이크아웃 PRO       혁신적이고 역동적인 브레이크아웃 존 전략으로 거래 여정을 새로운 차원으로 끌어올리도록 설계되었습니다. Quantum Breakout Indicator는 5개의 이익 목표 영역이 있는 브레이크아웃 영역의 신호 화살표와 브레이크아웃 상자를 기반으로 한 손절 제안을 제공합니다. 초보자 거래자와 전문 거래자 모두에게 적합합니다. Quantum EA 채널:       여기를 클릭하세요 중요한! 구매 후 설치 매뉴얼을 받으려면 개인 메시지를 보내주십시오. 추천: 기간: M15 통화쌍: GBPJPY, EURJPY, USDJPY,NZDUSD, XAUUSD 계정 유형: 스프레드가 매우 낮은 ECN, Raw 또는 Razor 브로커 시간: GMT +3 중개인 :
Dynamic Forex28 Navigator MT5
Bernhard Schweigert
5 (1)
다중 통화 강도 및 모멘텀 지표 MT5 Dynamic Forex28 Navigator는 오랫동안 사랑받아 온 저희 지표의 진화 버전으로, 세 가지 기능을 하나로 결합했습니다: Advanced Currency Strength28 Indicator (리뷰 700개) Advanced Currency IMPULSE with ALERT (리뷰 530개) CS28 Combo Signals (최근 보너스) 두 이전 지표는 MQL5 Market에서 합계 1,200개가 넘는 리뷰를 받았으며 2016년부터 MT4 커뮤니티의 필수품이었습니다. Dynamic Forex28 Navigator MT5는 검증된 동일한 로직을 그대로 이어갑니다. MetaTrader 5를 위해 완전히 다시 제작 – MT5의 네이티브 다중 심볼 아키텍처를 최대한 활용하도록 설계되었습니다. 사용 설명서: https://www.mql5.com/en/blogs/post/758844 MT4 버전을 찾고 계신가요? 여기를 클릭하세요: ht
Scalper Vault MT5
Oleg Rodin
5 (1)
Scalper Vault는 당일 매매(intraday trading)에서 일관된 성과를 내고자 하는 트레이더를 위해 설계된, 강력하고 모든 기능을 갖춘 트레이딩 시스템입니다. 이 고정밀 지표는 외환(Forex) 및 바이너리 옵션 트레이더 모두에게 기관급 분석을 제공하는 독립적인 종합 트레이딩 시스템 역할을 합니다. 구매 후 저에게 연락해 주시면, 트레이딩 팁과 함께 특별한 보너스를 제공해 드립니다! Scalper Vault는 추측에 의존하거나 복잡한 수동 분석을 할 필요를 없애주며, 사용하기 쉬운 트레이딩 기법을 통해 오직 매매 실행에만 집중할 수 있도록 돕습니다. 정확한 추세 추종 신호: 핵심 알고리즘이 시장 구조를 분석하여, 지배적인 시장 추세 방향과 일치하는 고확률 신호만을 제공함으로써 잘못된 진입을 획기적으로 줄여줍니다. 정밀한 고점 및 저점 탐지: 시장의 움직임이 소진되는 지점을 스캔하여 잠재적인 반전 구간을 식별합니다. 간(Gann) 이론 기반의 매수/매도 구간: 수학적
Volatility Master for MetaTrader is a real-time dashboard tool that scans up to  50 symbols  to identify high-volatility , trending markets instantly. With bullish/bearish signals, customizable alerts, and a user-friendly interface, it helps you avoid range-bound conditions and focus on high-probability trades. Clarity leads to confidence. Trade confidently and protect your capital effectively with this powerful dashboard. We don't offer free or bonus indicators in exchange of reviews from you.
SR Liquidity MT5
Oleg Rodin
5 (2)
SR Liquidity 는 시장 유동성이 집중되고 가격이 가장 강력하게 반응하는 숨겨진 구간을 포착하도록 설계된 트레이딩 지표입니다. 이러한 특수 유동성 구간은 강력한 지지 및 저항선 역할을 하며, 시장 반전 가능성이 가장 높은 지점을 명확하게 보여주는 지도가 되어 줍니다. SR Liquidity는 일반적인 지지 및 저항선을 단순히 그리는 대신, 실제 가격 움직임을 분석하여 매수 및 매도 압력이 집중되는 구간을 포착합니다. 이러한 구간은 실질적인 시장의 흐름을 주도하는 유동성 풀(liquidity pools)에 해당합니다. 이 지표는 해당 구간을 차트에 직접 시각화하여, 가격 반응이 실제로 나타나기 전에 이를 미리 예측할 수 있도록 돕습니다. 즉, 가격 추세가 전환될 가능성을 사전에 파악하게 해주는 것입니다. 결과적으로 이 지표는 가공되지 않은 가격 움직임(price action)을 시장의 핵심 가격대, 다시 말해 추세 전환점이 될 수 있는 지점들을 보여주는 명확하고 실용적인 로드맵
OrderFlux – MetaTrader 5용 Order Flow Footprint Chart, Volume Profile 및 Market Profile 지표 OrderFlux는 MetaTrader 5용 오더 플로우 Footprint 지표로, 각 캔들 내부에서 실제로 어떤 거래가 발생하는지 명확하게 보여줍니다. 개별 캔들을 펼쳐 각 가격 수준에서 체결된 거래량을 표시하고, 공격적인 매도와 공격적인 매수를 구분합니다. 틱 데이터를 기반으로 실시간 Footprint 차트를 구성하며, Delta, Imbalance, Absorption, Volume Profile, Market Profile(TPO), VWAP, Cumulative Delta(CVD), DOM 탭 및 경제 캘린더를 하나의 정돈되고 읽기 쉬운 인터페이스에 통합합니다. 일반적인 차트는 시가, 고가, 저가, 종가만 보여줍니다. 이는 가격 움직임의 결과이지 원인은 아닙니다. OrderFlux는 오더 플로우 트레이딩의 핵심 질문에
제작자의 제품 더 보기
Onnyx AI
Januar Rifai
ONNYX AI 버전 3.33 MetaTrader 5 헤징 계좌용 다중 통화 EA입니다. 수요·공급 구역을 만들고 유효 구역에 가격이 닿을 때 진입을 평가하며 통합 포트폴리오 패널로 포지션을 관리합니다. 12-24-12-1 ONNX 네트워크가 내장되어 로컬 엔진은 외부 서비스 없이 작동합니다. 버전 3.33 변경 사항 - 초기 로트 0.01과 배수 1.20 같은 작은 마틴게일 배수의 로트 증가를 수정했습니다. 각 단계는 반올림 전 초기 로트에서 기하급수적으로 계산한 후 브로커 볼륨 스텝에 맞춥니다. - Maximum Basket Positions 기본값을 100으로 변경했습니다. 마틴게일은 기본적으로 비활성화되어 있습니다. - 가상 증거금 부족 시 테스터가 조기 종료되던 동작을 제거하여 전체 기간을 완료합니다. - 차트 종목과 다중 통화 스캐너의 바스켓 관리를 개선했습니다. 주요 기능 - 수요·공급 구역, 추세, 캔들 및 상위 타임프레임 확인. - 내장 ONNX와 종목별 온라인 학습
ONNYX INDICATOR 버전 1.14 MetaTrader 5용 수요·공급 구역 분석 지표입니다. 확정된 스윙을 기준으로 구역을 생성하고 ATR로 폭을 조정하며 품질을 백분율로 표시합니다. 종가가 확정된 후 생성된 BUY/SELL 신호는 사라지지 않도록 설계되었습니다. 주요 기능 - 구역 내부에 품질 백분율을 표시하는 수요·공급 구역. - 확정 봉에서 나타나는 큰 BUY/SELL 화살표. - 선택 가능한 EMA 추세 필터와 캔들 거부 확인. - 추세, 가격 레벨 및 시장 상황 패널. - 관련 경제 뉴스 최대 5개 표시. 발표 전 Forecast/Previous, 발표 후 Actual 표시. - 60초 뉴스 갱신 및 전략 테스터용 캘린더 캐시. - 팝업, 푸시 및 이메일 알림. - iCustom 버퍼: 0=BUY 가격, 1=SELL 가격. 사용 방법 차트에 지표를 적용하고 히스토리 로딩을 기다린 뒤 추세와 활성 구역을 확인하십시오. 확정 봉 신호를 개인 리스크 관리와 함께 사용하십
CoCoTe Indicator CoCoTe Indicator는 MetaTrader 5용 시장 구조 분석 도구입니다. 확정된 Break of Structure(BOS), Change of Character(CHoCH), 유동성 스윕, 매집 구간을 차트에 직접 표시합니다. 신호는 Shift 1이 적용된 마감 캔들을 기준으로 계산되므로 아직 형성 중인 현재 캔들은 확인 과정에 사용되지 않으며 장중 변동으로 인한 불필요한 잡음을 줄입니다. 정보 패널은 최근 시장 구조, 방향성, 감지된 유동성 이벤트, 매집 상태를 한눈에 보여 줍니다. 시각적인 라벨과 가격 레벨을 통해 모든 스윙 고점과 저점을 수동으로 표시하지 않고도 가격 움직임을 효율적으로 검토할 수 있습니다. 입력 설정에서 스윙 깊이, 확인 거리, 매집 범위, 색상, 라벨, 패널 디자인을 조절할 수 있습니다. 이 지표는 거래를 자동으로 실행하지 않으며 수익을 보장하지 않습니다. 개인 분석, 위험 관리, 충분한 테스트와 함께 사용하십시오.
THE SIMPLE, THE BETTER Simple Ema Rsi Trader v1.19 is a clean, transparent trend-following Expert Advisor for MetaTrader 5. It combines two of the most widely understood indicators—Exponential Moving Averages and RSI—to create disciplined entries without grid, martingale, averaging, or complicated black-box logic. HOW IT TRADES • BUY when Fast EMA is above Slow EMA, RSI is above the Buy minimum level, and RSI is below the Buy maximum level. • SELL when Fast EMA is below Slow EMA, RSI is belo
MTF SnD EA ARF — Multi-Timeframe Supply & Demand Trading for MetaTrader 5 Trade supply and demand zones with a clear, configurable ruleset. MTF SnD EA ARF combines automatic zone detection, multi-timeframe trend confirmation, rejection-candle entries, money-based basket management, optional martingale, and Dynamic Recovery System (DRS) logic in one EA. LAUNCH PRICE: USD 30 The price is planned to increase by USD 10 after every confirmed sale, subject to MQL5 Market rules. Early buyers keep the
AMD Pro EA
Januar Rifai
AMD Pro EA – Advanced Smart Money Concepts with Martingale & Hedging AMD Pro EA is a powerful and flexible Expert Advisor designed based on Smart Money Concepts (SMC), specifically the Accumulation – Manipulation – Distribution (AMD) model combined with advanced risk management tools. This EA detects high-probability setups using liquidity sweeps, rejection candles, Break of Structure (BOS), and Fair Value Gaps (FVG), then manages trades using either classical single entry, Martingale, or Hedgin
VWAP Volume Profile Price Action EA This Expert Advisor combines session VWAP, a bar-based volume profile, price action patterns and an optional higher-timeframe trend filter. It supports session-hour filtering and optional grid management with configurable limits. The on-chart dashboard displays trend, setup and filter status. STRATEGY COMPONENTS - Session VWAP calculated from the current trading day. - Volume profile levels (POC, VAH and VAL) estimated from recent chart bars and tick volume.
필터:
리뷰 없음
리뷰 답변