Fair Value Gap MT5
- 지표
-
Ahmed Soliman
 I'm a programmer for 25 years. 20 years programming in mql4/5.
I wrote the first mql4 tutorial which helped a lot of people around the world.
Currently I'm programming in C++, C#, .Net, VB, PHP, MQL4/5 etc.
I promise clean code and after delivery support. - 버전: 1.2
- 활성화: 10
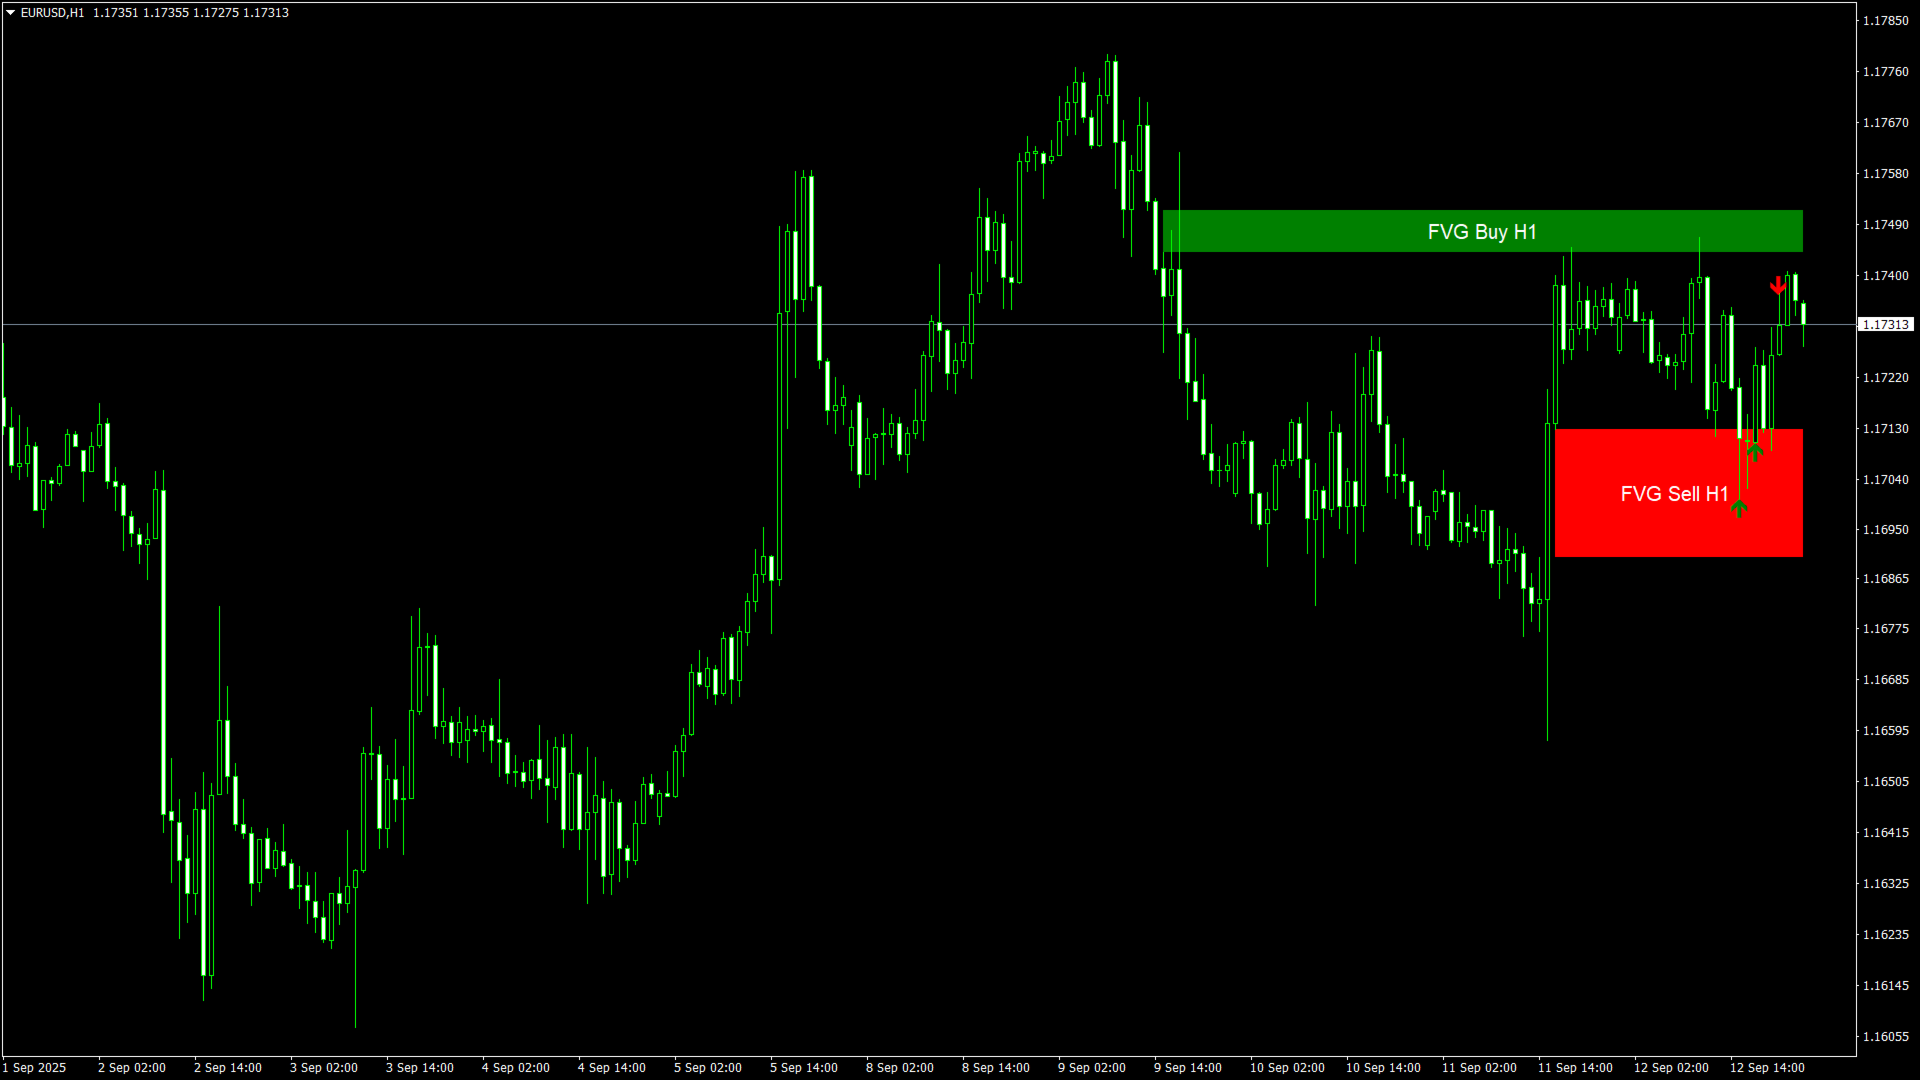
FVG - Fair Value Gap
The FVG - Fair Value Gap is an advanced MQL5 indicator designed for traders who utilize institutional order flow and Smart Money Concepts to identify market inefficiencies. This indicator automatically detects and highlights Fair Value Gaps (FVGs) on your chart, providing a clear visual representation of potential support and resistance zones, reversal points, and high-probability trading setups.
Key Features:
-
Automated FVG Detection: The indicator automatically identifies and plots Fair Value Gaps, saving you the time and effort of manual analysis.
-
Customizable Drawing Tools: Choose between displaying FVGs as Rectangles or TrendLines to best suit your charting style.
-
Trading Options: The indicator includes multiple FVG trading options to help you manage potential trade entries, including CloseBelowAbove , FirstLineTouch , SecondLineTouch , and MiddleLineTouch .
-
Alerts and Notifications: The indicator can send you real-time alerts and email notifications when a new FVG forms or when the price interacts with an FVG zone. This allows you to stay informed and react quickly to market opportunities.
-
Adaptable to Any Market: The concept of Fair Value Gaps is a universal principle that can be applied to Forex, stocks, commodities, and cryptocurrency markets.
How It Works:
Fair Value Gaps are areas on a chart where buying and selling activity is unbalanced, often created during a sharp price movement. These gaps signify market inefficiencies and can act as magnets for price, as the market tends to revisit and "fill" these zones to restore balance.
Benefits to Traders:
-
Improved Market Timing: By highlighting these key inefficiency zones, the indicator helps you identify optimal entry and exit points for your trades.
-
Enhanced Decision-Making: Use the identified FVGs as dynamic support and resistance levels to confirm trend strength and make more informed trading decisions.
-
Effective Risk Management: With clear entry and exit points, you can establish more precise risk management strategies, which is crucial for trading success.
-
Professional Insights: Fair Value Gaps often form due to large institutional orders, so this tool can provide insights into where major players are influencing the market.
Disclaimer: Trading involves risk, and past performance is not indicative of future results. It is important to use this indicator as part of a comprehensive trading strategy and with proper risk management.