Volume Divergence Pro MT5

  • 지표
  • Ravi Shakya
    Ravi Shakya
    I’m Ravi Shakya, an MT5 developer with 5 years of trading experience in NEPSE and Forex. I use Smart Money Concepts (SMC) and price action to create simple and useful trading indicators, tools, and Expert Advisors.
  • 버전: 2.10
  • 업데이트됨: 3 10월 2026
  • 활성화: 10

A dual-timeframe trend engine with volume-weighted divergence and market structure confluence.

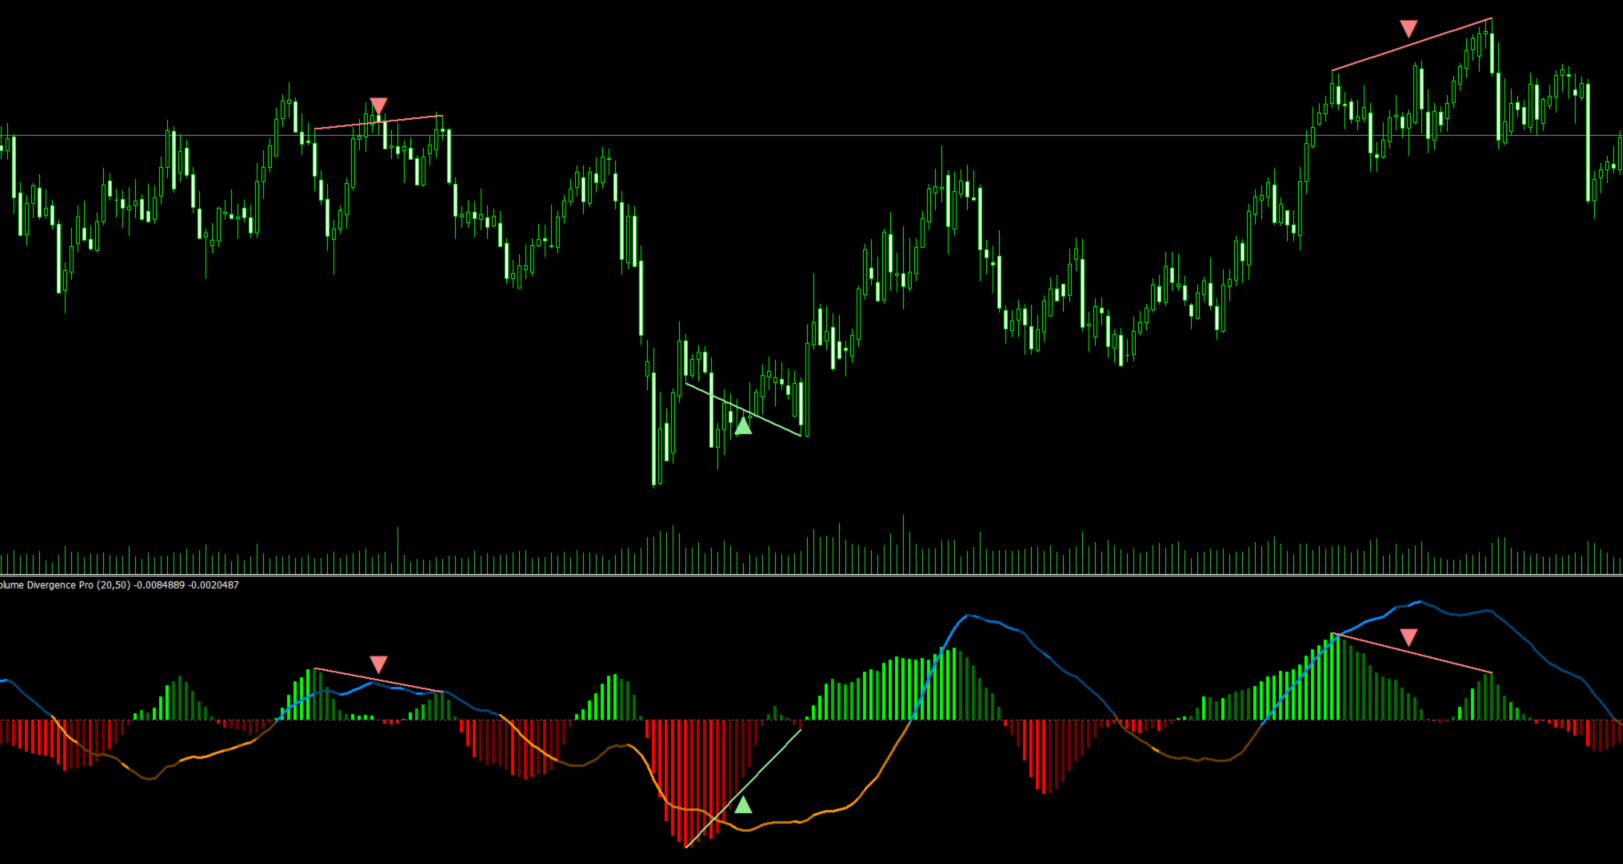
Volume Divergence Pro plots two linear-regression trend readings — a fast one and a slow one — and colors each by whether the volume actively participating in that move is building or fading. On top of that trend picture, it detects regular and hidden divergences between price and momentum, and can require those divergences to agree with the prevailing market structure before showing them.

Built for traders who want to see why a move is or isn't confirmed, not just that price is moving.

Key features

  • Fast + slow regression trend — a short-term column histogram and a long-term trend line, both derived from least-squares regression on price
  • Volume-weighted coloring — every bar's volume is split into buying and selling participation from candle structure, and the color of each column shows whether that participation is strengthening or fading
  • Regular & hidden divergence detection — choose regular only, hidden only, or both, with independent bullish/bearish coloring
  • Divergences drawn on the chart, not just the indicator pane — connector lines and arrows appear directly on the candles at the price pivots, alongside the oscillator view
  • Market structure filter (optional) — a break-of-structure engine flags the prevailing bias from swing highs/lows, and can require divergences to agree with it before they're shown, filtering out signals that fight the trend
  • Continuation marks (optional) — when a divergence is suppressed for going against structure, the indicator can watch for the candle that invalidates it and mark that candle as a trend-continuation signal
  • Configurable alerts — popup, sound, push notification, and email, one alert per bar per condition
  • Fully customizable — every color, line style, arrow size, and threshold is exposed as an input; nothing is hardcoded

How it works

  1. Two regression slopes are fitted to price over a fast and a slow lookback window and scaled to show net movement across each window
  2. Each candle's volume is split into buy/sell participation using its body-to-wick structure
  3. Swing highs and lows of the fast series are compared against the corresponding price pivots to flag regular divergence (momentum disagrees with a new price extreme) and hidden divergence (momentum extends while price consolidates)
  4. If the market structure filter is enabled, a divergence only prints when it agrees with the last confirmed break of structure

Inputs at a glance

  • Trend engine: price source, fast/slow window length, volume source, volume split method
  • Divergence: regular / hidden / both, swing size, colors
  • Market structure: on/off, swing size, neutral handling, line styles and colors
  • Continuation: on/off, expiry, cancel-on-flip, colors, arrow size
  • Drawings: pane and/or chart, arrows, max objects kept, history depth
  • Alerts: per-channel toggles, sound file

Notes

Works on any symbol and timeframe. Indicator only — no trades are placed, no account information is required. Designed as a discretionary confirmation tool: combine it with your own entry, risk, and trade management rules rather than trading its signals in isolation.

Past performance and pattern recognition do not guarantee future results. This product does not constitute financial advice.


추천 제품
VWAP Z-Score (Rolling) Positive values indicate price trading above VWAP, while negative values indicate price trading below VWAP. Typical Use Cases Mean-reversion strategies Overbought / oversold detection VWAP-based statistical analysis Confirmation tool for discretionary or algorithmic trading Risk-aware trade entries and exits Notes Uses tick volume for VWAP weighting (standard for Forex symbols). The indicator does not repaint. Designed for analytical and decision-support purposes only.
Trend Pulse Apex
Camila Bernardez Camero
Trend Pulse Apex — 패턴 인식 + 트렌드 필터 + 모멘텀 필터 (리페인트 없음) Trend Pulse Apex는 높은 확률의 캔들 패턴을 감지하여 실시간 트렌드 및 모멘텀 분석으로 확인합니다. 닫힌 봉에만 고정된 화살표와 명확한 레이블을 표시하여 리페인트나 지연 없이 정확한 신호를 제공합니다. 주요 기능 • 패턴 인식: 엄격한 시가/고가/저가/종가 조건을 평가하여 Shooting Stars, Engulfings, Stars, Dojis, Hammers, Piercing Lines, Dark Cloud Covers 등 10가지 이상의 고급 일본식 캔들 패턴을 식별합니다. • 트렌드 필터: 내장된 ADX 모듈이 타임프레임에 따라 자동 조정되어 강세 추세와 횡보장을 구분하며, 차트에 “Weak” 또는 “Strong” 상태를 표시합니다. • 모멘텀 오버레이: 설정 가능한 RSI 수치가 트렌드 레이블 옆에 표시되어 과매수/과매도 구역을 강조하고 진입 타이밍을 최적화합니다.
Product Name: Fair Value Channel Consolidation Breakout THE MACHINE LEARNING HAVE BEEN DESACTIVATED FOR A EASY TEST!!( OBS: IF THE CLIENT WANT IT WE CAN INTEGRATE IT EASILY) ATTENTION !!!! THE RIGHT INPUTS TO USE IN XAU/USD  CAN BE VIZUALIZED IN THE SCREENSHOTS, IF THE INPUTS ARE NOT USED THE RESULT CAN DIFFERS! TAKE PROFIT , SELL LOSS AND TRAILLING STOP CAN BE CHANGED IF YOU DESIRE Stop trading the past. Start trading the true Fair Value. Fair Value Channel Consolidation Breakout  is not just
The  OBV MTF  is an Enterprise-grade On-Balance Volume indicator that transforms standard OBV into a complete trading system. It combines gradient-aware momentum analysis, divergence detection, multi-timeframe alignment, and dynamic customisable midpoint-filtering in a single intuitive professional volume analysis tool. Core Features 1. 5-State Momentum Engine Aqua (Strong Bullish) : OBV slope rising with positive acceleration SteelBlue (Weak Bullish) : OBV rising but losing momentum Gray (Neutr
Introduction to Sideways Market Analyzer Notable period of Low volatility and non-trending movements in the financial market is considered as Sideways Market. Sooner or later, the low volatility will increase and the price will pick up a trend after Sideways Market. In terms of trading point of view, Sideways Market can serve as the very good entry timing for traders. Sideways Market is also quite often the representation of accumulation of large orders from big investors. Therefore, knowing the
Triple Machine
Thomas Bradley Butler
Build your own model to predict averages of turning points of the Triple Moving Average Oscillator. It is simple.  Rate me with stars. Just load the indicator Triple Moving Average Oscillator in you platform and choose the period.  Scroll through to observe the averages of the highs and lows over a period of time. Add the levels for a buy and a sell on the Triple Machine and this will show the average of highs and lows to look for buys and sell. You can load multiple copies with multiple levels.
SEE WHERE PRICE IS !!   Multi-Period High & Low Zones  가격의 좌표를 보라 !! 가격이 어디에 있는지 모르면 , 어떤 전략도 의미가 없다 . B2U High & Low Price Zone does not change the market. It changes how you see it. B2U Market State System Part of the B2U Market State System If you don’t know where price is, no strategy really matters. B2U High & Low Price Zone visualizes multi-period high / low structures and the current price gap in one clean, intuitive view. B2U High & Low Price Zone 은 여러 시간 축의 최고가 · 최저가 구조와  현재 가격의 위치 (Gap
FirstCandle LDN NY
Isaac Alexander Pinero Garcias
First Candle Sessions — LDN & NY MT5 Indicator   |   M1 to H1   |   London and New York Sessions   What It Does Automatically marks the High, Low and 50% midpoint of the first 5-minute candle at the opening of the London and New York sessions, creating a clear visual range to trade breakouts every day without any manual work.   Buy signal: when a subsequent candle closes above the High of the first candle. Sell signal: when a subsequent candle closes below the Low of the first candle. No signal
Apex Trend Engine
Thiago Balonyi Candal Da Rosa
Apex Trend Engine is a professional Expert Advisor built to trade market structure and directional momentum with a disciplined risk framework. Unlike conventional systems that rely on lagging indicators or risky recovery methods, Apex Trend Engine focuses on identifying high-probability trend conditions and executing trades with precision and control. The system uses a combination of structural price analysis, volatility filtering, and trend validation to avoid low-quality market conditions. Tra
IsisQueen
Alexandro Matos
ISIS Indicator - The Power of Moving Average Crossovers for Accurate Trading ISIS Indicator Overview ISIS is an advanced technical indicator for MetaTrader 5, designed to identify accurate buy (BUY) and sell (SELL) signals based on the crossover of two configurable moving averages. It is designed to be used in conjunction with the OSIRIS robot, but can also be applied manually by traders looking for trend-based strategies. With a smart combination of a fast moving average (Fast MA) and a sl
I recommend you to read the  product's blog  (manual) from start to end so that it is clear from the beginning what the indicator offers. This multi time frame and multi symbol supply and demand zone dashboard indicator sends alerts when the price has reached a supply/demand zone. It is also possible to use it to be alerted about regular double tops/bottoms instead of zones. It can be used with all time frames from M1 to MN. Maximum 9 time frames can be shown in the dashboard at the same time. 
Market Structure Evaluator MTF Market Structure Evaluator MTF is an institutional-grade price action indicator designed for Smart Money Concepts (SMC) and Market Structure traders. It automatically tracks Market Structure Breaks ( BOS ) and Change of Character ( CHOCH ) in real-time across multiple timeframes, giving you a complete macro-to-micro view of market trend alignment without cluttering your charts or having to analyse other timeframes. Whether you trade manually or build automated tr
Volume Profile Multiple — 알고리즘 트레이딩을 위한 버퍼 지원 다중 블록 볼륨 프로파일 타임프레임을 바꿀 때마다 볼륨 프로파일을 블록별로 다시 그리고 재계산하는 데 지치셨나요? Volume Profile Multiple 은 차트에 여러 개의 연속된 볼륨 프로파일을 자동으로 그려주어, 마지막으로 표시된 구간뿐만 아니라 시장의 각 구간에서 기관의 관심이 실제로 어디에 있었는지를 보여줍니다. 이 지표가 하는 일 이 지표는 가격 히스토리를 N개의 캔들 단위로 블록화합니다(블록 개수와 블록당 캔들 수는 자유롭게 설정 가능). 각 블록마다 완전한 볼륨 프로파일을 계산합니다: 컨트롤 포인트(POC), 밸류 에어리어 상단/하단(VAH/VAL), 그리고 고거래량 구간과 저거래량 구간(HVN/LVN)입니다. 그 결과 블록별 시장 구조를 시각화한 지도가 만들어지며, 이를 통해 실제 거래량 기반의 매집 구간, 지지/저항, 그리고 밸류 에어리어 간 가격 순환을 파악할 수 있습니다. 알고
Single Arrow MTF
Ahmed Hamed Hamed Eadwan
SingleArrow MTF — Market Description — ko SingleArrow MTF — 독립형 ZigZag + Williams %R 다이버전스 신호 파일 하나. 화살표 하나. 의사결정 하나. SingleArrow MTF 는 MetaTrader 5용 전문가급 자체 완결형 다이버전스 신호 지표입니다. 전용 선형 시간 ZigZag 엔진, 레그 분리를 갖춘 Williams %R 다이버전스 필터, 선택적 피벗 보호 레이어, 멀티 타임프레임 합의 대시보드, 자동 지지/저지를 하나로 결합——모두 단일 파일로 컴파일되며 외부 지표, 라이브러리, DLL이 필요 없습니다. 이런 분께 날것의 오실레이터 대신 깔끔하고 규칙 기반인 다이버전스 화살표를 원하는 재량 트레이더 . 기계 판독 가능하고 리페인트에 투명한 신호 소스(버퍼 + GlobalVariable 채널)가 필요한 EA 개발자 . 확인되고 히스토리에서 안정적인 신호 스트림(Confirm 모드)이 필요한 백테스터·전략가 . 아키
Volume flow Profile
Israr Hussain Shah
Master Edition은 거래량과 자금 흐름의 관점을 통해 시장 구조를 시각화하도록 설계된 전문가급 분석 도구입니다. 표준 거래량 지표와 달리, 이 도구는 차트에 일일 거래량 프로필을 직접 표시하여 가격 발견이 발생한 위치와 "스마트 머니"가 위치한 곳을 정확하게 볼 수 있게 합니다. 이 Master Edition은 명확성과 속도를 위해 설계되었으며, 로드 시 차트 레이아웃을 즉시 아름답게 만드는 독특한 자동 테마 동기화 시스템을 특징으로 합니다. 주요 기능: 진정한 자금 흐름 계산: 표준 틱 거래량을 넘어섭니다. "Use Money Flow"를 활성화하면 거래량이 가격에 따라 가중치가 부여되어 특정 가격 수준에서의 실제 자본 투입을 드러냅니다. 가치 영역(VA) 시각화: 가치 영역(기본값: 거래량의 70%)을 자동으로 계산합니다. VA Fill: 통제 구역을 즉시 식별하기 위해 가치 영역 배경을 음영 처리합니다. 주요 수준: 통제점(POC), 가치 영역 고점(VAH), 가치 영
SMC Market Structure PRO — Order Blocks, FVG, Liquidity & Confluence Zones Stop guessing. Start reading the market the way the big players see it. SMC Market Structure PRO automatically detects smart money zones of interest on your chart — Order Blocks, Fair Value Gaps (FVG) and time-based imbalances — and highlights Confluence Zones where all three types of structure overlap. That is exactly where price reacts most often. This is a complete market structure analysis tool based on the Smart Mone
Volume Thermal Vision
Jean Carlos Martins Roso
Volume Thermal Vision으로 볼륨의 힘을 경험하세요 트레이딩을 한 단계 업그레이드할 준비가 되셨나요? MetaTrader 5용 궁극의 볼륨 지표인 Volume Thermal Vision을 소개합니다. 볼륨 분석을 전략적 우위로 전환시켜 주는 이 지표는 높은 확률의 기회를 식별하려는 트레이더를 위해 개발되었으며, VSA(Volume Spread Analysis), ICT(Inner Circle Trader), SMC(Smart Money Concepts), Wyckoff 등 방법론에 최적화되어 EURUSD, GBPUSD, US30 등 페어의 시장 행동을 해독하는 데 도움을 줍니다. 왜 Volume Thermal Vision인가? 고급 볼륨 분석: 12단계 컬러 레벨로 볼륨 강도를 시각화하여 축적, 분배 및 기관 움직임을 명확하게 식별합니다. 독점 시각 프로토콜: Tactical, StealthMode, ThermalVision, NightVision 4가지 모드를 선택해
Trend Pulse Multi Timeframe
Jorge Eliecer Valencia Ferreira
**What it does** Trend Pulse Pro colors a 50 EMA according to the market state: green in an uptrend, red in a downtrend, and gray in a range. To decide which is which, it combines two things: trend strength (ADX) and the moving average's slope divided by the ATR. Dividing by the ATR ensures the same threshold works on gold, a forex pair, or an index, without readjusting it every time volatility changes. Along this line, the indicator prints buy and sell arrows based on a 9/21 EMA crossover. M
RSIScalperPro
PATRICK WENNING
RSIScalperPro를 소개합니다 - 메타트레이더 5용 RSI 기반의 혁신적인 인디케이터로, 1분 차트에서의 스캘핑에 최적화되어 있습니다! RSIScalperPro를 사용하면 정확한 진입 및 청산 신호를 제공하는 강력한 도구를 손에 넣을 수 있습니다. RSIScalperPro는 서로 다른 두 가지 RSI 지표를 사용하여 과매수 및 과매도 레벨에 대한 명확한 신호를 제공합니다. 2개의 RSI의 시간 프레임 및 제한 값을 원하는 대로 조정하여 트레이딩 전략에 최적화된 결과를 얻을 수 있습니다. 차트 상의 개별 화살표는 거래 진입 및 청산 타이밍을 쉽게 파악하는 데 도움이 됩니다. 또한 RSIScalperPro의 특징 중 하나는 사용자 정의 가능한 3개의 이동 평균선입니다. 이를 통해 트렌드의 방향을 판단하고 강력한 거래 신호를 확인하는 데 도움이 됩니다. 이를 통해 조기에 트렌드를 감지하고 수익성 높은 거래에 참여할 수 있습니다. 뿐만 아니라 RSIScalperPro는 새로운 거래
TradeAQ
Guo Sheng Zhao
LuoMo Volume & Price Structure 8.98 A multi-function chart indicator for   MetaTrader 4 and MetaTrader 5 , designed to display key volume, volatility, sentiment, and price-structure information directly on the main chart. Main Features Volume and price-based Support & Resistance Volume spike and exhaustion signals ATR volatility expansion alerts Volume Profile with HVN and LVN Bullish and bearish sentiment distribution Developing or fixed POC VAH and VAL levels Supply and Demand zones Volume-wei
Market Profile Osw MT5
William Oswaldo Mayorga Urduy
사용자 매뉴얼: Market Profile Osw Market Profile Osw는 특정 기간 동안의 거래량 및 가격 분포를 시각화할 수 있는 고급 경매 분석 도구입니다. 기존의 캔들 차트와 달리, 이 시스템은 가장 활발한 거래가 발생한 위치를 보여주어 실제 시장 참여를 기반으로 한 심리적 지지 및 저항 영역을 식별할 수 있게 해줍니다. 1. 매개변수 가이드 (입력 메뉴) 일반 설정 Show Market Profile: 차트에서 프로필 표시를 활성화 또는 비활성화합니다. Volume Type: 가격 변동 횟수(Tick) 또는 실제 거래량(특정 브로커 및 자산에서 사용 가능) 중 활동 측정 방법을 선택할 수 있습니다. Look Back Bars: 지표가 현재 프로필을 생성하기 위해 소급할 캔들 개수를 정의합니다. Profile Right Side: 프로필을 가격축 옆(오른쪽)에 그릴지 아니면 분석 기간의 시작점(왼쪽)에 그릴지 결정합니다. Seconds Refresh: 지표가 데
거래량 가중 MACD 볼륨 가중 MACD(VW-MACD)는 Buff Dormeier가 작성했으며 그의 책 Investing With Volume Analysis에 설명되어 있습니다. 볼륨 가중 가격 추세의 수렴과 발산을 나타냅니다. 볼륨을 포함하면 VW-MACD가 일반적으로 기존 MACD보다 응답성과 신뢰성이 높아집니다.   MACD(이동 평균 수렴 발산)란 무엇입니까? 이동 평균 수렴 발산은 1979년 Gerald Appel에 의해 만들어졌습니다. 표준 MACD는 단기 지수 평균과 장기 지수 평균 간의 차이를 표시합니다. 차이(MACD 라인)가 양수이고 상승하면 가격 추세가 상승하고 있음을 나타냅니다. MACD 라인이 음수이면 가격 추세가 하락하고 있음을 나타냅니다. 이 차이의 부드러운 지수 평균이 계산되어 MACD 신호 라인을 형성합니다. MACD선이 MACD 신호선 위에 있으면 MACD의 모멘텀이 상승하고 있음을 나타냅니다. 마찬가지로 MACD가 MACD 신호선 아래
MaMI Currency Strength Engine v2 Compact is an institutional-style currency imbalance dashboard designed to identify where capital is flowing across the forex market by analyzing the relative strength and weakness of major global currencies in real time. Instead of relying on traditional lagging indicators, the engine compares multiple currency pairs to detect dominant market pressure, strongest-versus-weakest currency imbalances, and high-probability trading opportunities. The dashboard
Opulence Levels
Tokunbo Greatpath Adebowale
Opulence Levels is a precision-engineered, non-repainting indicator that automatically identifies the most critical price levels on any chart — the exact zones where smart money reacts, liquidity is hunted, and the next big move is born. Powered by swing-based structure analysis and multi-timeframe intelligence, Opulence Levels cuts through chart noise to deliver clean, high-probability BUY LEVELS and SELL LEVELS with surgical accuracy. No guesswork. No repainting. Just levels that matter. What
VPEO Volume Statistics VPEO Volume Statistics is a customizable volume-analysis indicator for MetaTrader 5. VPEO stands for Volume Pressure and Efficiency Oscillator. The indicator combines directional volume pressure, a statistical analysis of rising or falling market participation, volume-efficiency conditions, optional BUY and SELL markers, and a compact dashboard in one interface. The indicator is designed to answer three separate questions: Is current volume pressure mainly positive or nega
FREE
UR VolumeTrend MT5
Krzysztof Jan Debski
UR 볼륨트렌드   UR VolumeTrend는 볼륨 측면에서 진행 중인 추세를 보여주는 가장 명확한 볼륨 표시기입니다. UR TrendExhaustion과 같은 다른 지표와 완벽하게 작동하여 로컬 고점과 저점을 나타냅니다. 단 2개의 매개변수로 제한됩니다. 값이 높을수록 더 긴 추세가 표시됩니다. 기울기 극단은 잠재적 반전을 포착하기 위해 가능한 볼륨 소진을 보여줍니다. 두 줄 - 거래량 추세 및 평균입니다. 최고의 장점: 쉽고 모든 자산에 맞게 조정됩니다. 도구 업데이트를 최신 상태로 유지하고 빠진 것이 있다고 생각되면 요청을 보낼 수 있는 특별한 텔레그램 채팅이 있습니다! 왜 UR VolumeTrend인가? 거래량이 추세를 파악하는 데 중요하다는 데 모두 동의할 것입니다. 이 오실레이터는 사용하기 쉬운 하나의 표시기로 압축된 모든 볼륨 도구의 합계입니다. 보기 편한 방식으로 양수/음수 양을 보여줍니다. 뒤의 인터페이스는 볼륨이 과거에 비해 소진될 가능성이 있는지 또는
캔들 움직임 지수(CMI) — MT5용 시각적 캔들 강도 지표 캔들 움직임 지수(CMI)는 각 캔들의 강도와 모멘텀을 시각적으로 측정하는 강력한 MT5 지표입니다. 캔들 움직임을 색상으로 표시하여 트레이더가 추세 강도, 시장 반전, 변동성 구간을 쉽게 파악할 수 있도록 합니다. 이 지표는 캔들 강도를 빠르고 안정적으로 시각적으로 확인하고자 하는 스캘퍼, 일중 트레이더, 스윙 트레이더에게 이상적입니다. 주요 기능: 강세 또는 약세 모멘텀을 식별하는 시각적 캔들 강도 감지 각 캔들의 종가 대비 강세를 색상으로 표시 실시간 및 과거 실적의 신뢰성을 위한 비재도색 알고리즘 모든 시간대(M1~MN)에서 작동 민감도, 색상 및 임계값에 대한 사용자 정의 가능 낮은 CPU 사용량 및 실시간 차트에 최적화 ATR, RSI, MACD 또는 추세 필터와 같은 다른 도구와 결합 가능 작동 방식: CMI는 캔들의 종가와 시가 간의 상대적인 움직임을 계산하여 이 데이터를 시장 압력을 반
Tik Tok
Ivan Simonika
The Tik Tok indicator was created on the basis of the original extreme search indicators, the indicator is well suited for determining a reversal or a big sharp jerk in one direction, thanks to it you will know when this happens it will notify you when a blue dot for buying red for sale appears. It basically uses the process of detecting the rate of change in price growth and allows you to find entry and exit points from the market. fundamental technical indicator that allows you to assess the
Institutional Tick Engine Pro: 틱 속도 및 히트맵 분석 Institutional Tick Engine Pro는 원시 틱 데이터를 처리하도록 설계된 기술적 분석 제품군입니다. 레벨 2 데이터 없이 속도(Velocity), 히트맵 및 미세 구조 패턴을 포함한 주문 흐름 지표를 합성합니다. 주요 기능 1. 틱 속도 모니터 시장 속도(초당 틱 수)를 측정하여 가격 움직임의 강도를 분석합니다. 2. 합성 유동성 히트맵 높은 거래량에도 불구하고 가격이 정체되는 "흡수 구역"을 시각화하여 숨겨진 지정가 주문을 식별합니다. 3. 미세 구조 반전 신호 형성 중인 캔들 내에서 틱 비율 불균형을 분석하여 잠재적인 반전 신호를 감지합니다. 4. 오디오 트레이딩 어시스턴트 (가이거 모드) 시장 변동성에 따라 소리 빈도를 조절하는 "가이거 계수기" 모드를 포함합니다. 기술 사양 데이터 소스: 브로커 틱 데이터. 알림: 푸시 알림, 이메일, 사운드 및 화면 경고. 내보내기: CSV 내
BBands PMO
Norio Takahashi
The indicator allows you to simplify the interpretation of signals produced by the classical MACD indicator.  It is based on the double-smoothed rate of change (ROC).  Bollinger Bands is made from EMA line.  The indicator is a logical continuation of the series of indicators using this classical and efficient technical indicator. The strength of the trend is determined by Bands and main line. If the bands width are smaller than the specified value, judge it as suqueeze and do not recommend tra
이 제품의 구매자들이 또한 구매함
Trend Sniper X
Sarvarbek Abduvoxobov
4.9 (41)
Trend Sniper X 는 트레이더가 추세 방향과 잠재적 반전 지점을 명확하고 정확하게 포착할 수 있도록 도와주는 MetaTrader 5용 멀티 타임프레임 추세 추종 지표입니다. MT4용: https://www.mql5.com/en/market/product/193245 가격 정보: 현재 가격은 프로모션 할인가이며, 향후 업데이트 및 새로운 기능이 출시됨에 따라 변동될 수 있습니다. 보너스 혜택: 본 지표 전용 무료 자동매매 Assistant EA를 받으시려면 구매 후 작성자에게 메시지를 보내주시기 바랍니다. Code2Profit 채널 멀티 타임프레임 분석으로 시장을 마스터하세요! Trend Sniper X로 승률을 극대화하는 방법: 핵심 규칙 및 세션 팁 기술 사양 플랫폼 MetaTrader 5 지표 유형 멀티 타임프레임 추세 지표 운용 타임프레임 모든 차트 타임프레임 지원, 독립적으로 선택 가능한 상위 타임프레임(M1–MN1) 주요 상품 외환, 금(XAUUSD) 및 기타 C
Smart Trend Trading System — MetaTrader 5 구매 후 MQL5에서 저에게 메시지를 보내시면 Smart Universal Expert Advisor를 무료로 받으실 수 있으며, 온라인 강좌, PDF 매뉴얼 및 비공개 그룹 이용 권한도 함께 제공됩니다. STTS는 추세 방향, 진입·청산 신호, 반전 구간, 주요 가격 수준을 차트에 모아 보여줍니다. 시스템을 참고해 수동으로 거래하거나, 별도의 호환 EA를 연결하여 선택한 설정에 따라 자동으로 거래를 실행할 수 있습니다. 하나의 시스템, 네 가지 트레이딩 접근법 STTS의 트레이딩 접근법은 크게 네 가지로 나뉩니다. • 스캘핑 — 단기 신호와 시장 움직임을 살펴봅니다. • 추세 매매 — 방향을 평가하고 추세 안에서 기회를 찾습니다. • 반전 매매 — 잠재적인 전환 구간과 방향 변화를 파악합니다. • 거래량 매매 — 거래량 기반 정보로 시장 활동을 평가합니다. 진입·청산 화살표, 추세 정보, 지지·저항 수
Zoryk Gold
Reda El Koutbane
5 (16)
ZORYK — MetaTrader 5용 XAUUSD 전문 신호 및 트레이드 플래닝 시스템 이런 경험이 있을 것입니다. 골드를 분석하고 진입을 기다린 뒤 마침내 포지션을 열었지만 가격이 곧바로 반대 방향으로 움직입니다. 너무 일찍 청산하거나 Stop Loss를 옮기거나 몇 초 동안 망설입니다. 그 후 시장은 내가 없이도 처음 예상했던 목표까지 정확히 움직입니다. 문제는 항상 방향이 아니었습니다. 진짜 문제는 불확실성이었습니다. 정확한 진입 위치를 몰랐습니다. 어느 지점에서 원래의 트레이드 아이디어가 무효가 되는지 몰랐습니다. 가까운 수익을 확보해야 할지 더 큰 움직임을 기다려야 할지 판단하기 어려웠습니다. 현재 setup이 정말 강한지 아니면 단지 새로운 거래를 억지로 찾고 있는지도 확신하기 어려웠습니다. 골드는 매우 빠르게 움직입니다. 명확한 계획이 없다면 좋은 분석도 몇 초 만에 나쁜 결정으로 바뀔 수 있습니다. ZORYK는 이 문제를 해결하기 위해 개발되었습니다.
SuperScalp Pro
Van Minh Nguyen
4.56 (36)
SuperScalp Pro - Professional Multi-Layer Confluence Scalping System SuperScalp Pro는 클래식 Supertrend에 여러 지능형 확인 필터를 추가한 고급 스캘핑 지표입니다. 더 높은 확률의 Buy/Sell 거래 기회를 식별하는 데 도움을 주며, 잘못된 신호를 크게 줄이는 데 도움을 줍니다. 명확한 Buy 및 Sell 화살표가 차트에 직접 표시되며, ATR 기반 Stop Loss 및 Take Profit 수준이 실시간으로 자동 계산됩니다. 구매 후 설정 방법 및 권장 구성에 대한 안내가 필요하시면 저에게 문의해 주세요. SuperScalp Pro Auto Trader를 사용하여 신호를 쉽게 자동화할 수 있습니다: [Auto Trader] 권장 설정 파일 다운로드: [Set File] 전체 문서는 제품 블로그에서 확인할 수 있습니다: [User Guide] 업데이트를 확인하려면 공식 채널에 참여하세요: [Official C
새로운 왕의 등장 - 인디케이터 + 주문 관리 표시(TP1 + TP2 + TP3) + 선택형 텔레그램 시그널 전송 기능 포함 (무료) (완전한 트레이딩 및 시그널 시스템) 골드를 위한 최고의 EA: Gold Slayer 이 인디케이터는 고급 전략, 사용자 지정 가능한 주문 관리 시스템, 그리고 엔벨로프 확장을 결합한 평균 회귀(mean reversion) 시스템을 포함하고 있습니다. 또한 RSI와 같은 여러 지능형 확인 필터를 통해 높은 확률의 반전 진입 구간을 포착하여 BUY 및 SELL 시그널을 제공합니다. 단순히 거래 방법만 배우는 것이 아니라, 여러 포지션을 효과적으로 관리하고 이전에 수익 중인 오픈 포지션으로 손실 거래를 커버하는 방법까지 익힐 수 있습니다. M5 전용으로 설계 및 최적화되었으며, 유동성이 풍부해 시그널이 더 깔끔하고 신뢰도 높은 BTCUSD와 XAUUSD에서 뛰어난 성능을 발휘합니다. 이 인디케이터는 ATR 기반으로 자동 계산된 진입가, 손절가, 익절가와
SMC Intraday Formula
VividMind Digital Solutions
5 (26)
먼저 솔직하게 말하겠습니다. 어떤 인디케이터도 단독으로 당신을 수익성 있게 만들어주지 않습니다. 누군가 그렇게 말한다면, 그는 당신에게 꿈을 파는 것입니다. 완벽한 매수/매도 화살표를 보여주는 모든 인디케이터는 완벽하게 보이도록 만들 수 있습니다 — 단지 올바른 과거 구간을 확대하고 승리한 거래만 캡처하면 됩니다. 우리는 그렇게 하지 않습니다.  SMC Intraday Formula는 도구입니다. 시장 구조를 읽고, 가장 높은 확률의 가격 구간을 표시하며, 현재 스마트 머니의 흐름이 어떻게 보이는지 아주 단순한 언어로 보여줍니다. 최종 결정은 여전히 당신이 합니다. 실행도 당신이 합니다. 하지만 이제는 희망이 아니라 정확성으로 거래하게 됩니다. 우리는 이 인디케이터를 지난 약 3년 동안 골드(XAUUSD) 및 주요 외환 통화쌍의 데이 트레이딩 스캘핑에 사용해 왔습니다. M1, M5, M15, M30에서 우리의 핵심 도구입니다. 이 도구는 미래를 예측하려 하지 않습니다 — 지금 형성
GoldenX Entry MT5
VividMind Digital Solutions
5 (16)
GoldenX Entry는 MT5용 인디케이터로, 적응형 Smart Entry Trend 알고리즘, 신호 스코어링 시스템, 시장 레짐 감지 기능, 그리고 변동성 필터를 포함합니다. 각 신호에는 계산된 진입 레벨, 3개의 익절(TP1, TP2, TP3) 레벨, 그리고 손절(Stop-Loss) 레벨이 포함됩니다. 이 인디케이터는 다양한 시장 환경에 적응하도록 설계된 다중 분석 레이어 구조 위에 구축되어 있으며, 내장 최적화기와 통계 추적 시스템을 결합합니다. 또한 Risk-to-Reward(RR) 지표와 과거 거래 행동 기반의 정량 분석을 제공합니다. 시작은 간단합니다 — 선택한 타임프레임에서 최적화기를 실행한 뒤 차트에서 바로 인디케이터를 사용하면 됩니다. 핵심 기능 GoldenX Entry는 하나의 차트에서 신호 엔진, 트레이드 관리 기능, 그리고 과거 통계 추적을 통합합니다: - 내장 최적화기: 최적화기는 차트에서 원클릭으로 실행됩니다. 200개의 파라미터 조합을 두 단계 탐색
Entry Points Pro for MT5
Yury Orlov
4.52 (151)
전설이 돌아왔습니다: Entry Points Pro 10. MQL5 마켓 Top-3 자리를 3년간 지켜온 전설적인 지표의 재출시입니다. 수백 개의 호평 리뷰(두 버전 합산 589개), 매일 이 지표로 거래하는 수천 명의 트레이더, 31,000회 이상의 데모 다운로드   MT4+MT5 . 지난 5년간 여러분이 남긴 리뷰를 하나도 빠짐없이 읽었고, 약속 대신 그 답을 버전 10에 담았습니다. 1999년부터 시장에서 활동하며 정직함과 자신의 평판, 그리고 고객을 소중히 여기는 개발자가 만들었습니다. Entry Points Pro의 진입 시그널은 절대 리페인팅되지 않습니다. 그리고 이번에는 개발자의 말뿐이 아니라 검증 가능한 사실입니다: 확정 시그널은 캔들 종가에서만 표시되며, 자동화 테스트에서 리페인팅 0건 이 확인되었습니다(EURUSD, XAUUSD, BTCUSD에서 2,486,568회의 불변조건 검사 — 위반 0건). 검증 방법은 공개되어 있으니 전략 테스터에서 직접 재현해 보실 수
Gann Made Easy MT5
Oleg Rodin
5 (11)
Gann Made Easy 는 mr.의 이론을 사용하여 최고의 거래 원칙을 기반으로 하는 전문적이고 사용하기 쉬운 Forex 거래 시스템입니다. W.D. 간. 이 표시기는 Stop Loss 및 Take Profit Levels를 포함하여 정확한 BUY 및 SELL 신호를 제공합니다. PUSH 알림을 사용하여 이동 중에도 거래할 수 있습니다. 구매 후 거래 방법 안내 및 유용한 추가 지표를 무료로 받으시려면 저에게 연락주세요! 아마도 Gann 거래 방법에 대해 이미 여러 번 들었을 것입니다. 일반적으로 Gann의 이론은 초보자 거래자뿐만 아니라 이미 거래 경험이 있는 사람들에게도 매우 복잡한 것입니다. Gann의 거래 방식은 이론적으로 적용하기 쉽지 않기 때문입니다. 나는 그 지식을 연마하고 Forex 지표에 최고의 원칙을 적용하기 위해 몇 년을 보냈습니다. 표시기는 적용하기가 매우 쉽습니다. 차트에 첨부하고 간단한 거래 권장 사항을 따르기만 하면 됩니다. 지표는 지속적으로 시장 분석
ARIPoint
Temirlan Kdyrkhan
1 (4)
ARIPoint is a powerful trading companion designed to generate high-probability entry signals with dynamic TP/SL/DP levels based on volatility. Built-in performance tracking shows win/loss stats, PP1/PP2 hits, and success rates all updated live. Key Features: Buy/Sell signals with adaptive volatility bands Real-time TP/SL/DP levels based on ATR Built-in MA Filter with optional ATR/StdDev volatility Performance stats panel (Success, Profit/Loss, PP1/PP2) Alerts via popup, sound, push, or email Cu
당신의 트레이딩 우위를 한눈에 확인하세요! M5 Sniper 는 MeanFX의 새로운 지표입니다. 정확한 트레이딩 신호 와 적응형 TP/SL 레벨 을 결합하여, 결과적으로 가능한 최고의 통계적 트레이딩을 만들어냅니다! 5회 구매마다 가격이 인상되며, 다음 가격은 69$입니다. 구매 후 저에게 메시지를 보내주시면 팁/가이드와 보너스 EA를 제공해 드립니다. 무엇이 이 지표를 특별하게 만들까요? Gold XAUUSD에서 검증된 통계적 성과 ( 거의 모든 자산에서 작동 하며, 일관된 결과 없이 모든 것을 다루려고 하기보다는 하나의 타임프레임을 완전히 익히는 데 집중합니다) 각 심볼당 하루 1~8회의 트레이드 와 높은 승률을 제공하며, 모든 통계적 우위를 우리의 편으로 가져갑니다. 차트에는 확인된 BUY 및 SELL 신호만 표시됩니다. 각 트레이드에 대해 지표가 생성하는 적응형 TP 및 SL 레벨 평균 승률 75%+ 평균 Signal Ratio 최소 1.1+ 알람 및 알림이 휴대폰 으로도
Neuro Poseidon MT5
Daria Rezueva
4.75 (52)
Neuro Poseidon is a new indicator by Daria Rezueva. It combines precise trading signals with adaptive TP/SL levels - creating best possible trades as a result! Message me and get  Neuro Poseidon Assistant  as a gift to automize your trading process! What makes it stand out? 1. Proven profitability on all assets and timeframes 2. Only confirmed BUY and SELL signals present on the chart 3. Adaptive TP & SL levels generated by the software for each trade 4. Easy to understand - suitable for al
Auto Optimized SpeedAngle 은 지속적인 워크포워드 최적화(Walk-Forward Optimization, WFO)를 통해 곡선 적합(curve-fitting)을 제거한 기관 수준의 모멘텀 벡터화 시스템입니다. 시장 체제가 바뀔 때 성능이 떨어지는 정적 입력에 의존하는 대신, 이 지표는 표본 외(Out-of-Sample, OOS) 검증을 사용하여 매개변수를 동적으로 재보정하며, 표시되는 신호가 과거의 우연이 아닌 진정한 통계적 우위를 나타내도록 보장합니다. 핵심 기관용 프레임워크 워크포워드 최적화 엔진: 핵심 알고리즘은 수천 가지의 룩백(lookback) 및 임계값 조합을 지속적으로 스캔하며, 데이터를 인샘플(in-sample)과 표본 외(out-of-sample) 세트로 엄격하게 분리합니다. 미지의 데이터 환경에서 수학적 우수성이 증명된 경우에만 새로운 매개변수 구성을 채택합니다. 정량적 목적 함수: 순수한 총이익을 쫓는 대신, 최적화 엔진은 기관 수준의 안정성
안녕하세요, 트레이더 여러분! 많은 개인 투자자들이 느린 웹 스크립트에 의존하고 있습니다. 수익성 있는 거래를 위해서는 체계적인 프레임워크가 필수적입니다. Astro AI 지표는 단순한 차트 오버레이가 아닙니다. 터미널에서 직접 실행되는 두 개의 에이전트로 구성된 정교한 신경망입니다. 시스템 기술 상세 설명: 1. 에이전트 1: 분석가 (그래픽 신경망 – GNN) 시장은 개별 가격 막대로 이루어진 것이 아니라 상호 연결된 데이터 네트워크입니다. 기능: 에이전트 1은 그래픽 신경망을 사용하여 이러한 복잡하고 비선형적인 관계를 파악합니다. 장점: 기존 지표는 과거 이동 평균만을 고려하는 반면, 저희 GNN은 시장의 심층적인 구조적 관계를 실시간으로 처리하여 개별 트레이더의 거래량이 시장에 큰 영향을 미치기 전에 숨겨진 상관관계를 찾아냅니다. 2. 에이전트 2: 실행기 (근접 전략 최적화 – PPO) 패턴 인식은 절반의 성공일 뿐입니다. 현재 시장 변동에 기반하여 올바른
Adaptive Price Action Engine 지표를 구매하면 EA(자동매매 프로그램)가 무료 멀티 타임프레임 기반 자기 최적화 추세 & 캔들 패턴 분석 시스템 시장은 끊임없이 변화하며, 모든 Price Action 패턴이 모든 시장 환경에서 동일한 가치를 가지는 것은 아닙니다. Adaptive Price Action Engine 은 변화하는 시장 환경에 적응할 수 있도록 설계되었으며, 추세 구조, 멀티 타임프레임 분석, 캔들 패턴 및 통계적 최적화 를 하나의 분석 프레임워크로 결합합니다. 두 가지 적응형 모드 Dual Alpha Trend Mode 낮은 타임프레임과 높은 타임프레임에서 적합한 Alpha Trend 파라미터를 자동으로 탐색하여, 최근 시장 움직임에 맞춰 추세 분석을 조정합니다. Candlestick + Alpha Mode Alpha Trend를 통한 시장 국면 분석과 22개의 상승 및 하락 캔들 패턴 을 결합합니다. 모든 패턴을 동일하게 취급하는 대신, 다양
Welcome to ENTRY IN THE ZONE AND SMC MULTI TIMEFRAME  SPECIAL BENEFIT / FOR OUR MQL5 CUSTOMERS FREE ACCESS TO THE NEW TOOL  — COMING SOON — Learn more on our official website  : https://www.fableedge.net YouTube Channel : 24/7 LIVE SIGNALS  :   https://www.youtube.com/@FableEdgeView Entry In The Zone and SMC Multi Timeframe is a real-time market analysis tool based on Smart Money Concepts (SMC) , designed to analyze market structure, price direction, and key trading zones. It supports both Sing
M1 Sniper MT5
Oleg Rodin
5 (7)
M1 SNIPER 는 사용하기 쉬운 거래 지표 시스템입니다. M1 시간대에 맞춰 설계된 화살표 지표입니다. 이 지표는 M1 시간대 스캘핑을 위한 단독 시스템으로 사용할 수 있으며, 기존 거래 시스템의 일부로도 사용할 수 있습니다. 이 거래 시스템은 M1 시간대 거래용으로 특별히 설계되었지만, 다른 시간대에도 사용할 수 있습니다. 원래는 XAUUSD와 BTCUSD 거래를 위해 이 방법을 설계했지만, 다른 시장 거래에도 유용하다는 것을 알게 되었습니다. 이 지표의 신호는 추세 방향과 반대로 거래될 수 있습니다. 저는 지표의 신호를 활용하여 양방향으로 거래할 수 있도록 돕는 특별한 거래 기법을 알려드립니다. 이 방법은 특별한 동적 지지선과 저항선 가격 영역을 활용하는 것을 기반으로 합니다. 구매하시면 M1 SNIPER 화살표 지표를 바로 다운로드하실 수 있습니다. 또한, 아래 스크린샷에 표시된 Apollo Dynamic SR 지표는 M1 SNIPER 도구를 사용하는 모든 사용자에게 무료로
Divergence Bomber
Ihor Otkydach
4.89 (94)
이 지표를 구매하신 분께는 다음과 같은 혜택이 무료로 제공됩니다: 각 거래를 자동으로 관리하고, 손절/익절 수준을 설정하며, 전략 규칙에 따라 거래를 종료하는 전용 도우미 툴 "Bomber Utility" 다양한 자산에 맞게 지표를 설정할 수 있는 셋업 파일(Set Files) "최소 위험", "균형 잡힌 위험", "관망 전략" 모드로 설정 가능한 Bomber Utility의 셋업 파일 이 전략을 빠르게 설치, 설정, 시작할 수 있도록 돕는 단계별 영상 매뉴얼 주의: 위의 모든 보너스를 받기 위해서는 MQL5 개인 메시지 시스템을 통해 판매자에게 연락해 주세요. 독창적인 커스텀 지표인 “Divergence Bomber(다이버전스 봄버)”를 소개합니다. 이 지표는 MACD 다이버전스(괴리) 전략을 기반으로 한 올인원(All-in-One) 거래 시스템입니다. 이 기술 지표의 주요 목적은 가격과 MACD 지표 간의 다이버전스를 감지하고, **향후 가격이 어느 방향으로 움직일지를 알려주
Unix Scalper
Issam Kassas
4 (4)
Unix Scalper — MetaTrader 5 구매 후 MQL5에서 저에게 메시지를 보내시면 Smart Universal Expert Advisor를 무료로 받으실 수 있으며, 온라인 강좌, PDF 매뉴얼 및 비공개 그룹 이용 권한도 함께 제공됩니다. 매매 기회를 찾고, 거래 계획을 확인하고, 실행 방법을 선택하세요. UNIX Scalper는 시장 분석, BUY/SELL/WAIT 판단, Entry, Stop Loss, TP1 및 TP2 가격 수준을 하나의 정돈된 패널에 제공합니다. 신호와 거래 계획을 한눈에 • 명확한 판단: BUY, SELL 또는 WAIT. • 구체적인 가격 수준: Entry, Stop Loss, TP1 및 TP2. • 다중 시간대 개요: 패널의 여러 시간대 신호를 비교하세요. • 판단을 돕는 분석: 추세, 모멘텀, 거래량, 변동성, 지지와 저항, 시장 품질. • 다양한 레이아웃: Minimized, Compact, Standard 또는 Full. 신호와
Scalper Vault 는 성공적인 스캘핑에 필요한 모든 것을 제공하는 전문 스캘핑 시스템입니다. 이 표시기는 외환 및 바이너리 옵션 거래자가 사용할 수 있는 완전한 거래 시스템입니다. 권장 시간 프레임은 M5입니다. 시스템은 추세 방향으로 정확한 화살표 신호를 제공합니다. 또한 상단 및 하단 신호와 Gann 시장 수준을 제공합니다.  이 시스템은 사용하기가 매우 쉽습니다. 원하는 시장 지역의 화살표만 따라가면 됩니다. 엑시트는 가격이 적정 수준에 도달하거나 시장의 고점 또는 저점 신호가 나타날 때 수행됩니다.  표시기는 PUSH 알림을 포함한 모든 유형의 경고를 제공합니다. 인디케이터 구매 후 연락주세요. 내 개인 거래 권장 사항과 훌륭한 보너스 지표를 무료로 공유합니다! 나는 당신에게 행복하고 유익한 거래를 기원합니다!
Tokyo mt5 Indicator
Vasiliy Strukov
5 (9)
Tokyo Indicator는 추세 방향, 잠재적 거래 신호 및 시장 상황을 명확하고 시각적으로 보여줍니다. 색상으로 구분된 계단식 추세선은 강세 구간(파란색)과 약세 구간(자홍색)을 명확히 구별해 줍니다. 추세가 전환될 때 나타나는 방향성 화살표는 잠재적인 매수 및 매도 기회를 강조하여 보여줍니다. 통합 대시보드는 현재 신호, 시장 성향(bias), 모멘텀, 변동성, 신호 품질 등의 정보를 한눈에 파악할 수 있도록 구성되어 있습니다. 이를 통해 트레이더는 별도의 패널을 오갈 필요 없이 가격 움직임(price action)과 지표의 데이터를 동시에 분석할 수 있습니다. 깔끔한 차트 화면과 간결한 시장 개요를 제공하는 Tokyo Indicator는 체계적인 추세 분석과 거래 결정을 지원합니다. 모든 시간대와 다양한 자산(특히 금)에서 활용할 수 있습니다. 추세 방향, 잠재적 거래 신호 및 시장 상황을 명확하고 시각적으로 보여줍니다. 색상으로 구분된 계단식 추세선은 강세 구간(파란색)
RelicusRoad Pro MT5
Relicus LLC
4.96 (25)
거래를 더 이상 감으로 하지 마세요. 언제 진입할지, 어디서 청산할지, 시장이 어느 쪽으로 기울어 있는지를 한 차트에서 확인하세요. RelicusRoad Pro는 20개 가까운 도구를 인디케이터 하나에 담았고, 내 매매 방식에 맞는 도구만 켜서 쓰면 됩니다. 명확한 진입. 명확한 청산. 차트마다 확실한 계획. 이런 경험, 익숙하지 않으신가요? 매수하면 1분 뒤 가격이 반대로 돌아섭니다. 너무 일찍 청산하고, 그다음 움직임이 나 없이 이어지는 것을 지켜봅니다. 지표를 5개 띄우면 답도 5가지가 나옵니다. 손절(스톱로스)은 그냥 감입니다. 우리가 이걸 만든 이유 우리는 18년 동안 외환 거래를 해 왔습니다. RelicusRoad는 처음에 우리끼리 쓰려고, 전문 트레이더 모임을 위해 비공개로 만들었습니다. 이유는 개인적이었습니다. 같은 선을 손으로 계속 그리는 일에 지쳤고, 스스로 정한 규칙을 어기고, 차트에서 정말 중요한 한 가지를 놓치곤 했습니다. 우리에게 통한 것은 일관성입니다. 매
FiboSniper Pro
Van Minh Nguyen
5 (3)
FiboSniper Pro – Multi-Filter Fibonacci System with Auto SL/TP and Control Panel FiboSniper Pro는 동적 Fibonacci Envelopes와 여러 확인 필터를 결합하여 선별된 Buy 및 Sell 신호를 생성하는 기술적 지표입니다. Fibonacci 레벨은 Moving Average와 ATR을 기반으로 계산된 후 ADX, EMA, RSI, ATR, Volume, Time 및 Candle 구조를 통해 필터링됩니다. 이 지표는 ATR 기반의 자동 Stop Loss 및 Take Profit 레벨을 차트에 직접 표시하며, 빠른 설정 조정을 위한 인터랙티브 Control Panel을 제공합니다. 구매 후 권장 설정 파일과 자세한 사용 방법을 받으려면 저에게 문의해 주세요. Auto Trader X를 사용하여 FiboSniper Pro 신호를 자동화할 수 있습니다: [Auto Trader X] User Guide 및 Se
Market Structure Order Block Dashboard MT5는 시장 구조와 주요 가격 반응 구역을 차트에서 직접 읽고자 하는 트레이더를 위해 설계된 MT5 지표입니다. BOS, ChoCH, 오더 블록, Fair Value Gap (FVG), 유동성, Kill Zones, Volume Profile 그리고 빠른 분석을 위한 콤팩트한 대시보드를 결합합니다. 이 지표는 시장 구조, ICT 및 Smart Money 개념을 의사결정 프레임워크로 사용하는 트레이더를 대상으로 합니다. 추세 지속, 가능한 반전, 가격 불균형, 유동성 타겟 및 관심 구역을 보다 체계적으로 식별하는 데 도움을 줄 수 있습니다. 구매자를 위한 포함 리소스 구매 후 MQL5 개인 메시지로 요청하시면 완전한 PDF 사용 설명서와 파라미터 설정 팁을 제공해 드립니다. MQL5 개인 메시지를 통한 직접 기술 지원. 1.20 버전은 두 가지 주요 추가 기능을 제공합니다: Pending BOS / Pending
소개       Quantum Breakout PRO   , 브레이크아웃 존 거래 방식을 변화시키는 획기적인 MQL5 지표! 13년 이상의 거래 경험을 가진 숙련된 트레이더 팀이 개발한       퀀텀 브레이크아웃 PRO       혁신적이고 역동적인 브레이크아웃 존 전략으로 거래 여정을 새로운 차원으로 끌어올리도록 설계되었습니다. Quantum Breakout Indicator는 5개의 이익 목표 영역이 있는 브레이크아웃 영역의 신호 화살표와 브레이크아웃 상자를 기반으로 한 손절 제안을 제공합니다. 초보자 거래자와 전문 거래자 모두에게 적합합니다. Quantum EA 채널:       여기를 클릭하세요 중요한! 구매 후 설치 매뉴얼을 받으려면 개인 메시지를 보내주십시오. 추천: 기간: M15 통화쌍: GBPJPY, EURJPY, USDJPY,NZDUSD, XAUUSD 계정 유형: 스프레드가 매우 낮은 ECN, Raw 또는 Razor 브로커 시간: GMT +3 중개인 :
Trend Catcher ind mt5
Ramil Minniakhmetov
5 (18)
트렌드 캐처 인디케이터 트렌드 캐처 인디케이터는 개발자가 자체 개발한 맞춤형 적응형 트렌드 분석 지표들을 조합하여 시장 가격 움직임을 분석합니다. 단기적인 노이즈를 제거하고 근본적인 모멘텀 강도, 변동성 확대, 가격 구조 움직임에 집중하여 진정한 시장 방향을 파악합니다. 또한 이동 평균, RSI, 변동성 필터와 같은 맞춤형 지표들을 활용하여 가격을 평활화하고 트렌드를 필터링합니다. 실제 운영 모니터링 및 기타 제품은 다음 링크에서 확인하실 수 있습니다:   https://www.mql5.com/en/users/mechanic/seller 텔레그램에서는 EA나 설정 파일을 판매하지 않습니다. 사기이니 주의하세요. 모든 설정 파일은 블로그에서 무료로 제공됩니다. 중요! 구매 후 즉시 연락 주시면 사용 방법 및 보너스를 드립니다!
Quant Direction MT5
Georgios Kalomoiropoulos
Quant Direction 은 3D 시장 분석 도구입니다. 다양한 매개변수에 걸쳐 정확한 백분율 편차를 계산하면서 완벽하게 객관적인 알고리즘 기반 시장 분석을 제공합니다. 첨단 AI 기반 모델링 도구와 엄격한 테스트를 거쳐 개발된 이 알고리즘은 타의 추종을 불허하는 정확도로 시장을 분석합니다. 플랫폼에서 모든 통화쌍 또는 금융 상품을 분석할 수 있습니다. 단기 거래, 데이 트레이딩, 스윙 트레이딩 등 어떤 유형의 거래를 하든 Quant Direction은 최적의 선택입니다. 운영자가 되는 것의 진정한 이점 퀀트 디렉션의 진정한 장점은 감정, 눈의 피로, 과도한 분석을 완전히 배제한다는 점입니다. 더 이상 수십 개의 차트를 일일이 살펴보며 방향을 찾거나 자신의 판단에 끊임없이 의문을 품을 필요가 없습니다. 이 시스템은 8개의 시간 간격(5개월에서 수개월까지)을 밀리초 단위로 처리합니다. 특정 시점의 주요 시장 참여자를 정확하게 식별하여 항상 성공 확률이 가장 높은 방향으로 거래할
Volatility Master for MetaTrader is a real-time dashboard tool that scans up to  50 symbols  to identify high-volatility , trending markets instantly. With bullish/bearish signals, customizable alerts, and a user-friendly interface, it helps you avoid range-bound conditions and focus on high-probability trades. Clarity leads to confidence. Trade confidently and protect your capital effectively with this powerful dashboard. We don't offer free or bonus indicators in exchange of reviews from you.
Quantum TrendPulse
Bogdan Ion Puscasu
5 (26)
SuperTrend   ,   RSI   ,   Stochastic   의 힘을 하나의 포괄적인 지표로 결합하여 트레이딩 잠재력을 극대화하는 궁극의 트레이딩 도구   인 Quantum TrendPulse를   소개합니다. 정밀성과 효율성을 추구하는 트레이더를 위해 설계된 이 지표는 시장 추세, 모멘텀 변화, 최적의 진입 및 종료 지점을 자신 있게 식별하는 데 도움이 됩니다. 주요 특징: SuperTrend 통합:   주요 시장 추세를 쉽게 따라가고 수익성의 물결을 타세요. RSI 정밀도:   매수 과다 및 매도 과다 수준을 감지하여 시장 반전 시점을 파악하는 데 적합하며 SuperTrend 필터로 사용 가능 확률적 정확도:   변동성이 큰 시장에서 숨겨진 기회를 찾기 위해 확률적 진동   을 활용하고 SuperTrend의 필터로 사용 다중 시간대 분석:   M5부터 H1 또는 H4까지 다양한 시간대에 걸쳐 시장을 최신 상태로 유지하세요. 맞춤형 알림:   맞춤형 거래 조건이 충족되면
FX Trend MT5 NG
Daniel Stein
5 (6)
FX Trend NG: 차세대 멀티 마켓 트렌드 인텔리전스 개요 FX Trend NG 는 다중 시간 프레임 기반의 전문 트렌드 분석 및 시장 모니터링 도구입니다. 몇 초 만에 전체 시장 구조를 파악할 수 있도록 설계되었습니다. 여러 차트를 일일이 전환할 필요 없이, 어떤 종목이 추세에 있는지, 어디에서 모멘텀이 약화되고 있는지, 그리고 어떤 시간 프레임이 서로 정렬되어 있는지 즉시 확인할 수 있습니다. 출시 기념 특별 혜택 – FX Trend NG 를 $30 (6개월) 또는 $80 평생 라이선스 로 이용할 수 있습니다. 이미 Stein Investments 고객이신가요? -> 메시지를 보내 전용 고객 그룹에 참여하세요. 설정이나 사용 방법이 필요하신가요? -> Stein Investments 공식 페이지 를 방문하세요. 1. FX Trend NG가 특별한 이유 3단계 추세 로직 – 단순한 Buy / Sell이 아닙니다 • 대부분의 지표는 Buy 또는 Sell 두 가지 상태만 제
제작자의 제품 더 보기
SMC Market Structure MT5 PRO is a chart-based analysis indicator for MetaTrader 5 designed for traders who use Smart Money Concepts (SMC), Inner Circle Trader (ICT) concepts, market structure, liquidity analysis, and multi-timeframe price action. The indicator brings a comprehensive collection of SMC and ICT tools into a single chart, including Market Structure, Break of Structure (BOS), Change of Character (CHoCH), Order Blocks (OB), Fair Value Gaps (FVG), Inverse Fair Value Gaps (IFVG), Balanc
A volatility-contraction breakout EA built around a linear regression channel, with independent trend confirmation and a trading-session filter. Designed for GBPUSD on the H1 timeframe, trading the European/London session. Recommended Settings Symbol : GBPUSD Timeframe : 1H or 1 Hour HOW IT WORKS A linear regression channel is fitted to price over a configurable lookback period. The EA tracks the channel's bandwidth against its own recent range to distinguish between a market that is compressing
SMC Market Structure MT4 PRO is a chart-based analysis indicator for MetaTrader 4 designed for traders who use Smart Money Concepts (SMC), Inner Circle Trader (ICT) concepts, market structure, liquidity analysis, and multi-timeframe price action. MT5 version: SMC Market Structure MT5 PRO The indicator brings a comprehensive collection of SMC and ICT tools into a single chart, including Market Structure, Break of Structure (BOS), Change of Character (CHoCH), Order Blocks (OB), Fair Value Gaps (FV
An ICT / SMC indicator for MetaTrader 5. It waits for a liquidity sweep of PDH or PDL, then a market structure shift back inside the range, and plots the trade. Full documentation: Complete User Guide Chart Timeframe : 5 MIN / 15MIN Recommended Symbols : EURUSD, GBPUSD, AUDUSD, XAUUSD For GBPUSD , use the 15-minute timeframe . For all other symbols, use the 5-minute timeframe . The default settings are optimized for EURUSD on the 5-minute timeframe. For other symbols, you can download the corres
CISD Detector MTF marks Change in State of Delivery (CISD) levels on any symbol and timeframe, and shows the delivery state across eight timeframes in one panel. Overview In Smart Money Concepts (SMC) and ICT methodology, a CISD marks the moment price stops delivering in one direction and starts delivering in the other. It is often an early confirmation of a market structure shift (MSS) or change of character (CHoCH), and it usually appears before a classic break of structure (BOS). How it works
Discount Ends Soon — Next Price: $99 Session Range Breakout EA trades the opening range of a session and waits for price to come back before it commits. It does not enter on the break. When displacement takes price out of the range, the robot arms a pending limit order at the level and only takes the trade if price retests it. Euro Session Only You can find the .set files for the EURUSD / GBPJPY / USDJPY / US500  here   ---------------------------------------------------------------------------
Read the full documentation on the product blog: [ Complete User Guide ] How to Use it Chart Timeframe : 5 MIN Recommended Symbols : EURUSD, GBPUSD, NZDUSD, EURAUD The default settings are optimized for EURUSD on the 5-minute timeframe. For other symbols, you can download the corresponding .set files here . Marks the Asian session, waits for a liquidity sweep, and calls the entry the moment market structure confirms it. The SMC/ICT Asian Sweep Entry Model watches the Asian session range on your
Volume Divergence Pro shows whether volume confirms the trend and marks regular and hidden divergences on price and indicator. Volume Divergence Pro measures the direction of price with linear regression over a fast and a slow window, and checks whether trading volume is supporting that move or fading away from it. Swings in the indicator are compared with swings in price to find divergences, which are drawn both in the indicator window and directly on the candles. How it works The fast regressi
CISD - Change in State of Delivery indicator for MetaTrader 4. In Smart Money Concepts (SMC) and ICT methodology, a Change in State of Delivery (CISD) marks the moment price stops delivering in one direction and starts delivering in the other. It is often the first confirmation of a market structure shift (MSS) or change of character (CHoCH), and it usually appears before a classic break of structure (BOS) forms. This indicator detects CISD objectively on any symbol and timeframe, and shows the
SMT Divergence Multi Pair compares the swing highs and swing lows of the chart symbol with up to two correlated symbols and marks the places where they disagree. This is the Smart Money Technique (SMT) divergence used in ICT and Smart Money Concepts analysis: one market moves beyond a previous high or low while its correlated market does not confirm the move. How it works The indicator finds confirmed swing highs and swing lows on the chart symbol and compares each new swing with the previous on
SMT Divergence Multi Pair compares the swing highs and swing lows of the chart symbol with up to two correlated symbols and marks where they disagree. This is the Smart Money Technique (SMT) divergence used in ICT and Smart Money Concepts trading: one market sweeps a previous high or low while its correlated market fails to confirm the move. Discount Ends Soon — Next Price: $99 HOW IT WORKS The indicator finds confirmed swing highs and lows on the chart symbol and compares each new swing with th
Gold Smart Entry is a chart indicator for Gold (XAUUSD) based on Smart Money Concepts (SMC) and ICT ideas. It marks liquidity sweeps, confirms the reversal that follows, and highlights the entry zone at a Fair Value Gap (FVG) or Inverted Fair Value Gap (IFVG). For every setup it draws the suggested entry price, stop level and three target levels directly on the chart. The indicator does not open or manage trades. It is a visual analysis tool that shows where a setup forms and how it developed. I
HTF Candles PO3 SMC shows candles from a higher timeframe directly on your current chart, to the right of price. You can follow the forming 4H candle, or any other timeframe, while you trade on M5 or M15, without switching charts. The indicator is built for traders who use the Power of 3 concept (accumulation, manipulation and distribution) and Smart Money Concepts. Next to the candles it shows the levels that matter for this approach, so you can read the higher timeframe context at a glance. Wh
Symbol: EURUSD Timeframe: 30 minutes (M30) For other symbols or timeframes, adjust the settings to match the market. Volume Profile POC Breakout builds a volume profile from recent candles, finds the Point of Control (POC) and marks clean breakouts of that level. Each breakout is shown as a complete trade plan with entry, stop loss and three take profit levels, filtered by the higher timeframe trend and rated by a quality score. The indicator does not open trades. It is a visual and analysis to
VWAP Breakout Entry draws an anchored VWAP from market structure pivots and marks trade entries when price retests it after a breakout. Every signal comes with a stop loss and three take-profit levels, and the chart shows the full trade the way a charting platform would. Symbol : GBPUSD Timeframe : M30 / 30 Minutes Default settings are optimized for GBPUSD on M30 How it works The indicator detects swing highs and lows and anchors a VWAP to the latest structure leg. When price breaks structure a
필터:
리뷰 없음
리뷰 답변