Goku Candle Timer

𝗚𝗢𝗞𝗨 𝗖𝗔𝗡𝗗𝗟𝗘 𝗧𝗜𝗠𝗘𝗥 - 𝗣𝗔𝗡𝗘𝗟 𝗗𝗘 𝗖𝗨𝗘𝗡𝗧𝗔 𝗥𝗘𝗚𝗥𝗘𝗦𝗜𝗩𝗔 𝗣𝗔𝗥𝗔 𝗘𝗟 𝗖𝗜𝗘𝗥𝗥𝗘 𝗗𝗘 𝗩𝗘𝗟𝗔𝗦

𝗤𝘂𝗲́ 𝗲𝘀:
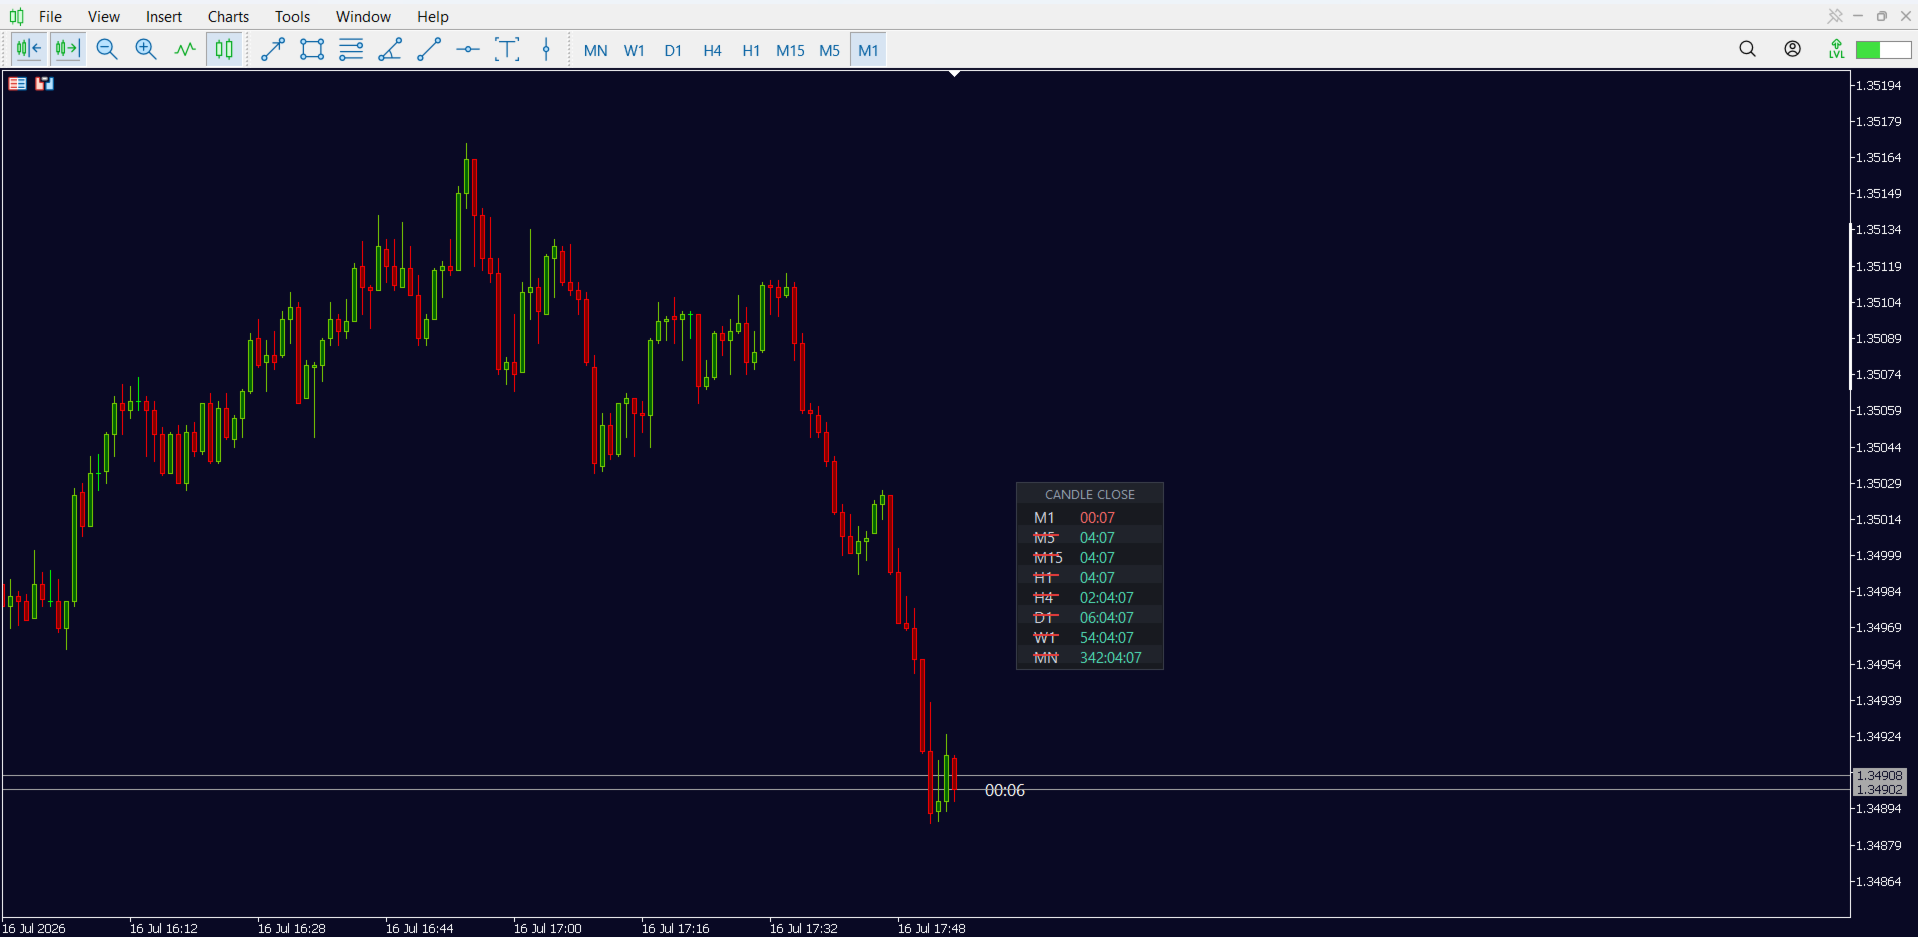
Un panel visual que muestra, en tiempo real, cuánto falta para que cada vela se cierre — en varios períodos al mismo tiempo, directo en tu gráfico. No más cálculos mentales ni cambios de temporalidad solo para saber cuándo se cierra la vela actual.

𝗙𝘂𝗻𝗰𝗶𝗼𝗻𝗲𝘀 𝗽𝗿𝗶𝗻𝗰𝗶𝗽𝗮𝗹𝗲𝘀

𝗖𝘂𝗲𝗻𝘁𝗮 𝗿𝗲𝗴𝗿𝗲𝘀𝗶𝘃𝗮 𝗺𝘂𝗹𝘁𝗶-𝗽𝗲𝗿𝗶́𝗼𝗱𝗼
Muestra el tiempo que falta para el cierre en hasta 21 períodos diferentes al mismo tiempo — desde M1 (1 minuto) hasta MN1 (mensual), incluyendo M2, M3, M4, M5, M6, M10, M12, M15, M20, M30, H1, H2, H3, H4, H6, H8, H12, D1 y W1. Tú eliges cuáles quieres mostrar, uno por uno.

𝗔𝗹𝗮𝗿𝗺𝗮 𝗽𝗮𝗿𝗮 𝗰𝗮𝗱𝗮 𝗽𝗲𝗿𝗶́𝗼𝗱𝗼
Cada período puede tener su propia alarma, activada o desactivada de forma independiente. Por ejemplo: alarma activada solo en M5 y H1, y desactivada en todos los demás — sin necesidad de abrir ningún menú. Solo haz clic directamente sobre el nombre del período dentro del panel: aparece una línea roja tachando el texto cuando la alarma de ese período está apagada, y desaparece cuando está encendida. Simple, visual, y la configuración se guarda automáticamente (se mantiene guardada incluso después de reiniciar la computadora).

𝗛𝗼𝗿𝗮𝗿𝗶𝗼 𝘆 𝗮𝘃𝗶𝘀𝗼 𝗱𝗲 𝗹𝗮 𝗮𝗹𝗮𝗿𝗺𝗮
Cuando la alarma se activa, tú eliges con cuántos segundos de anticipación avisa, y cómo avisa — puede ser con sonido (elige de una lista lista, o usa tu propio sonido personalizado), un aviso en pantalla (pop-up) y/o una notificación push en tu celular.

𝗣𝗮𝗻𝗲𝗹 𝟭𝟬𝟬% 𝗽𝗲𝗿𝘀𝗼𝗻𝗮𝗹𝗶𝘇𝗮𝗯𝗹𝗲
Posición en la pantalla: elige la esquina de anclaje y las coordenadas X/Y exactas.
Arrástralo con el mouse para moverlo donde quieras, en cualquier momento — el indicador recuerda la posición elegida, incluso después de cerrar y abrir MetaTrader de nuevo.
Tamaño: ancho del panel, altura de cada línea y altura del encabezado, todo ajustable.
Colores: fondo del panel, fondo de las líneas, borde, título, texto, color de la cuenta regresiva, color de aviso (cuando está por cerrar) y color de la marca de "alarma apagada" — cada uno se puede configurar por separado.
Fuente: elige entre varias fuentes listas en una lista (Segoe UI, Arial, Tahoma, Verdana, Calibri, Consolas, Courier New).

𝗥𝗲𝗹𝗼𝗷 𝗱𝗲𝗹 𝗽𝗿𝗲𝗰𝗶𝗼 𝗮𝗰𝘁𝘂𝗮𝗹
Un mini contador extra, separado del panel principal, que se mantiene justo en la línea del precio actual — sube y baja junto con él, en tiempo real, sin trabarse ni atrasarse aunque desplaces o hagas zoom en el gráfico. Siempre muestra la cuenta regresiva del período que está activo en el gráfico, y cambia solo cuando cambias de temporalidad. Tú controlas el color, el tamaño de la letra y la distancia respecto al precio.

𝗕𝗼𝘁𝗼́𝗻 𝗱𝗲 𝗺𝗼𝘀𝘁𝗿𝗮𝗿/𝗼𝗰𝘂𝗹𝘁𝗮𝗿
De forma opcional, activa un botón en pantalla que abre y cierra todo el panel con un clic — útil si usas varios indicadores y quieres liberar espacio en el gráfico cuando no lo estés usando. El botón también es totalmente personalizable: posición, tamaño, color de fondo, color de borde y color del texto.

𝗟𝗶𝘃𝗶𝗮𝗻𝗼 𝘆 𝗼𝗽𝘁𝗶𝗺𝗶𝘇𝗮𝗱𝗼
Hecho pensando en el rendimiento: el indicador solo actualiza la pantalla cuando algo realmente cambia (evitando redibujados innecesarios), reacciona al instante cuando cambias de temporalidad en el gráfico, y tiene un sistema de recuperación automática por si algún elemento visual desaparece por un momento — todo esto sin sobrecargar la memoria ni trabar la terminal, incluso en mercados con muchos movimientos por segundo.

██████████████████████████████████████████
𝗚𝗢𝗞𝗨 𝗖𝗔𝗡𝗗𝗟𝗘 𝗧𝗜𝗠𝗘𝗥 - 𝗖𝗢𝗡𝗙𝗜𝗚𝗨𝗥𝗔𝗖𝗜𝗢𝗡
██████████████████████████████████████████

██████████████████████████████████████████
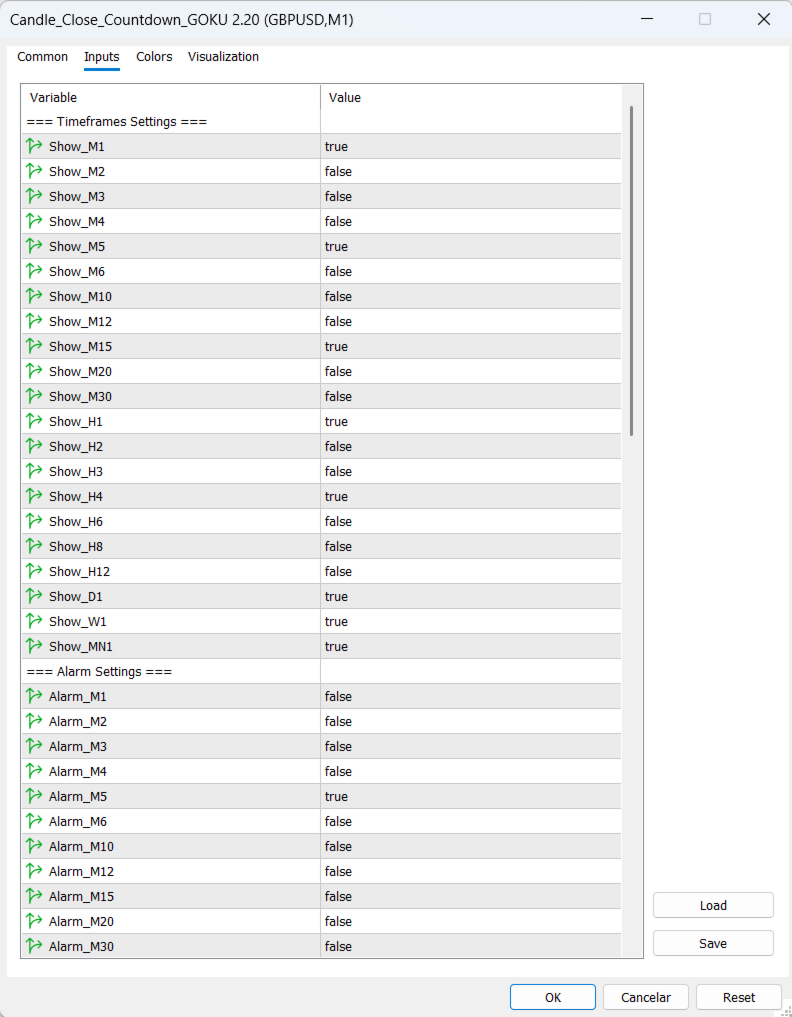
𝗧𝗜𝗠𝗘𝗙𝗥𝗔𝗠𝗘𝗦 𝗦𝗘𝗧𝗧𝗜𝗡𝗚𝗦
██████████████████████████████████████████

𝗦𝗵𝗼𝘄_𝗠𝟭 𝗮 𝗦𝗵𝗼𝘄_𝗠𝗡𝟭
Elige qué períodos de tiempo (velas) aparecen en la lista del panel. Por ejemplo, si activas Show_M5, aparece una línea con la cuenta regresiva del gráfico de 5 minutos en el panel. Si lo desactivas, esa línea simplemente no aparece — así solo ves los períodos que realmente usas.

██████████████████████████████████████████
𝗔𝗟𝗔𝗥𝗠 𝗦𝗘𝗧𝗧𝗜𝗡𝗚𝗦
██████████████████████████████████████████

𝗔𝗹𝗮𝗿𝗺_𝗠𝟭 𝗮 𝗔𝗹𝗮𝗿𝗺_𝗠𝗡𝟭
Activa o desactiva la alarma para ese período en concreto. Cada período tiene su propio interruptor — por ejemplo, puedes querer que te avise solo cuando se cierre la vela de 5 minutos, y dejar todos los demás períodos en silencio.

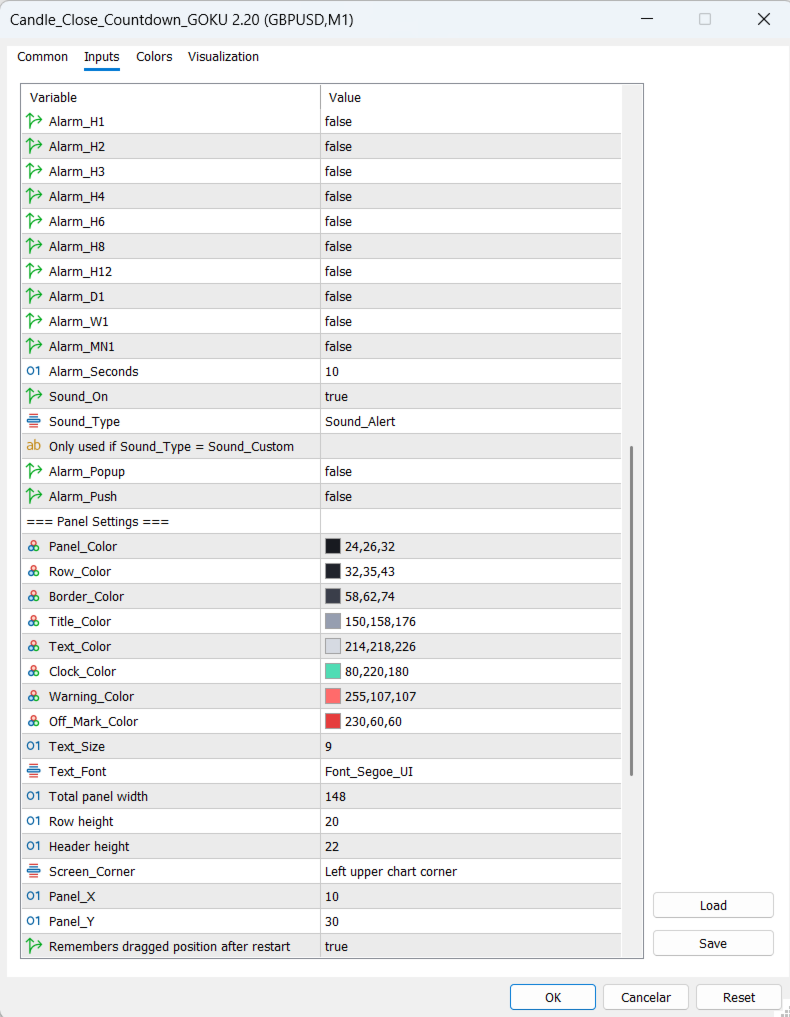
𝗔𝗹𝗮𝗿𝗺_𝗦𝗲𝗰𝗼𝗻𝗱𝘀
Con cuántos segundos de anticipación debe sonar la alarma, antes de que la vela se cierre de verdad. Si pones 10, el aviso ocurre 10 segundos antes del cierre — dándote tiempo para reaccionar antes de que la vela se cierre.

𝗦𝗼𝘂𝗻𝗱_𝗢𝗻
Activa o desactiva el sonido de la alarma. Si está desactivado, la alarma igual puede avisarte de otras formas (aviso en pantalla o notificación al celular), solo que no sonará.

𝗦𝗼𝘂𝗻𝗱_𝗧𝘆𝗽𝗲
Qué sonido se reproduce cuando la alarma se activa. Eliges de una lista lista con los sonidos que ya existen en MetaTrader, sin necesidad de escribir ningún nombre de archivo.

𝗦𝗼𝘂𝗻𝗱_𝗙𝗶𝗹𝗲_𝗡𝗮𝗺𝗲
Solo se usa si eliges la opción "Custom" en el campo de arriba — aquí escribes el nombre de tu propio sonido, en caso de que quieras usar un archivo de audio personalizado en vez de los sonidos por defecto de MetaTrader.

𝗔𝗹𝗮𝗿𝗺_𝗣𝗼𝗽𝘂𝗽
Activa o desactiva un aviso que aparece en la propia pantalla de la computadora (una ventana de alerta) justo cuando la vela está por cerrarse.

𝗔𝗹𝗮𝗿𝗺_𝗣𝘂𝘀𝗵
Activa o desactiva el envío de una notificación a la aplicación de MetaTrader en tu celular, avisando que la vela se está cerrando — útil para cuando no estás frente a la computadora.

██████████████████████████████████████████
𝗣𝗔𝗡𝗘𝗟 𝗦𝗘𝗧𝗧𝗜𝗡𝗚𝗦
██████████████████████████████████████████

𝗣𝗮𝗻𝗲𝗹_𝗖𝗼𝗹𝗼𝗿
El color de fondo de todo el panel — la "caja" donde están los períodos y las cuentas regresivas.

𝗥𝗼𝘄_𝗖𝗼𝗹𝗼𝗿
El color de fondo usado en las líneas alternadas, creando un efecto "rayado" que facilita distinguir una línea de otra.

𝗕𝗼𝗿𝗱𝗲𝗿_𝗖𝗼𝗹𝗼𝗿
El color de la línea fina que rodea todo el panel.

𝗧𝗶𝘁𝗹𝗲_𝗖𝗼𝗹𝗼𝗿
El color del texto del título, en la parte superior del panel.

𝗧𝗲𝘅𝘁_𝗖𝗼𝗹𝗼𝗿
El color del texto que muestra el nombre de cada período (M1, M5, H1...).

𝗖𝗹𝗼𝗰𝗸_𝗖𝗼𝗹𝗼𝗿
El color de los números de la cuenta regresiva, en condiciones normales.

𝗪𝗮𝗿𝗻𝗶𝗻𝗴_𝗖𝗼𝗹𝗼𝗿
El color que toma la cuenta regresiva cuando está muy cerca de cerrarse la vela — una forma visual de llamar tu atención sin necesidad de sonido.

𝗢𝗳𝗳_𝗠𝗮𝗿𝗸_𝗖𝗼𝗹𝗼𝗿
El color de la línea roja que tacha el nombre del período cuando su alarma está apagada.

𝗧𝗲𝘅𝘁_𝗦𝗶𝘇𝗲
El tamaño de la letra usada en todo el panel.

𝗧𝗲𝘅𝘁_𝗙𝗼𝗻𝘁
La fuente (tipo de letra) usada en el panel — la eliges de una lista lista, sin necesidad de escribir el nombre.

𝗣𝗮𝗻𝗲𝗹_𝗪𝗶𝗱𝘁𝗵
El ancho del panel en la pantalla — cuánto espacio ocupa en horizontal.

𝗥𝗼𝘄_𝗛𝗲𝗶𝗴𝗵𝘁
La altura de cada línea dentro del panel — controla qué tan espaciado o compacto se ve.

𝗧𝗶𝘁𝗹𝗲_𝗛𝗲𝗶𝗴𝗵𝘁
La altura solo de la barra del título, en la parte superior del panel.

𝗦𝗰𝗿𝗲𝗲𝗻_𝗖𝗼𝗿𝗻𝗲𝗿
En qué esquina de la pantalla se ancla el panel como referencia (superior izquierda, superior derecha, etc.) — la posición X e Y se cuentan desde esa esquina.

𝗣𝗮𝗻𝗲𝗹_𝗫
La distancia del panel hasta el borde lateral del gráfico, desde la esquina elegida arriba.

𝗣𝗮𝗻𝗲𝗹_𝗬
La distancia del panel hasta el borde superior o inferior del gráfico, desde la esquina elegida arriba.

𝗞𝗲𝗲𝗽_𝗣𝗼𝘀𝗶𝘁𝗶𝗼𝗻
Si está activado, cuando arrastras el panel a otro lugar de la pantalla con el mouse, esa nueva posición se guarda y se recuerda siempre — incluso después de cerrar y abrir MetaTrader de nuevo. Si está desactivado, el panel siempre vuelve a la posición definida en Panel_X y Panel_Y.

██████████████████████████████████████████
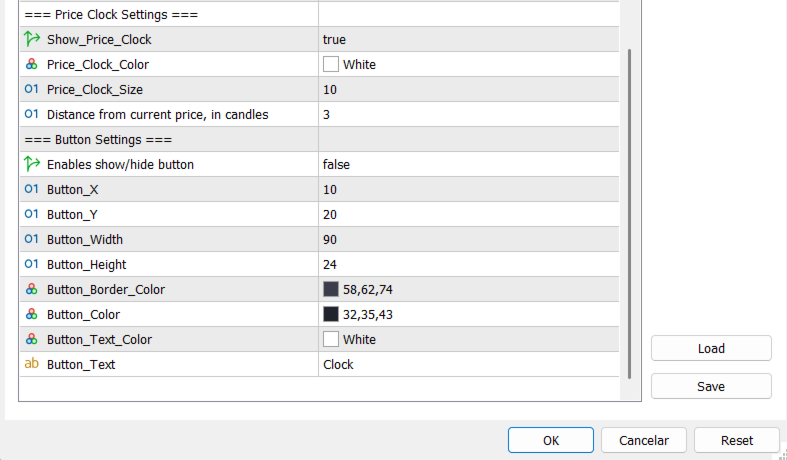
𝗣𝗥𝗜𝗖𝗘 𝗖𝗟𝗢𝗖𝗞 𝗦𝗘𝗧𝗧𝗜𝗡𝗚𝗦
██████████████████████████████████████████

𝗦𝗵𝗼𝘄_𝗣𝗿𝗶𝗰𝗲_𝗖𝗹𝗼𝗰𝗸
Activa o desactiva un mini contador extra que se mantiene justo a la altura del precio actual en el gráfico, mostrando la cuenta regresiva del período que está activo en ese momento.

𝗣𝗿𝗶𝗰𝗲_𝗖𝗹𝗼𝗰𝗸_𝗖𝗼𝗹𝗼𝗿
El color de ese mini contador.

𝗣𝗿𝗶𝗰𝗲_𝗖𝗹𝗼𝗰𝗸_𝗦𝗶𝘇𝗲
El tamaño de la letra de ese mini contador.

𝗣𝗿𝗶𝗰𝗲_𝗖𝗹𝗼𝗰𝗸_𝗗𝗶𝘀𝘁𝗮𝗻𝗰𝗲
Qué tan lejos queda ese contador del precio actual, medido en número de velas — mientras más alto el número, más alejado queda hacia la derecha.

██████████████████████████████████████████
𝗕𝗨𝗧𝗧𝗢𝗡 𝗦𝗘𝗧𝗧𝗜𝗡𝗚𝗦
██████████████████████████████████████████

𝗦𝗵𝗼𝘄_𝗕𝘂𝘁𝘁𝗼𝗻
Activa o desactiva un botón en pantalla que sirve para mostrar u ocultar todo el panel con un clic — útil cuando quieres liberar espacio en el gráfico por un momento sin tener que desactivar el indicador.

𝗕𝘂𝘁𝘁𝗼𝗻_𝗫
La posición horizontal del botón en la pantalla.

𝗕𝘂𝘁𝘁𝗼𝗻_𝗬
La posición vertical del botón en la pantalla.

𝗕𝘂𝘁𝘁𝗼𝗻_𝗪𝗶𝗱𝘁𝗵
El ancho del botón.

𝗕𝘂𝘁𝘁𝗼𝗻_𝗛𝗲𝗶𝗴𝗵𝘁
La altura del botón.

𝗕𝘂𝘁𝘁𝗼𝗻_𝗕𝗼𝗿𝗱𝗲𝗿_𝗖𝗼𝗹𝗼𝗿
El color del borde del botón.

𝗕𝘂𝘁𝘁𝗼𝗻_𝗖𝗼𝗹𝗼𝗿
El color de fondo del botón.

𝗕𝘂𝘁𝘁𝗼𝗻_𝗧𝗲𝘅𝘁_𝗖𝗼𝗹𝗼𝗿
El color del texto escrito dentro del botón.

𝗕𝘂𝘁𝘁𝗼𝗻_𝗧𝗲𝘅𝘁
El texto que aparece escrito dentro del botón — puedes escribir lo que quieras (por ejemplo, "Clock", "Mostrar", etc.).
추천 제품
XCalper HiLo Activator
Aecio de Feo Flora Neto
HiLo Activator v1.02 by xCalper The HiLo Activator is similar to moving average of previous highs and lows. It is a trend-following indicator used to display market’s direction of movement. The indicator is responsible for entry signals and also helps determine stop-loss levels. The HiLo Activator was first introduced by Robert Krausz in the Feb. 1998 issue of Stocks & Commodities Magazine.
Multi Timeframe Trend Sync
Jamille De Jesus Velasco
# Multi-Timeframe Trend Sync Pro (MTTS Pro) ## Synchronize Multiple Timeframes and Trade with Trend Confluence **MTTS Pro** is an advanced technical indicator developed for traders seeking precision in multi-timeframe analysis. By consolidating information from multiple timeframes simultaneously, the indicator identifies points of high confluence where multiple timeframes confirm the same market direction. --- ## MAIN FEATURES ### **Simultaneous Multi-Timeframe Analysis** - Monitor up t
Quantum Pulse Force
Joas Da Silva Veiga
추세 지표, 시장 흐름, 모멘텀 지표, 가격 행동, 외환 지표, 매수 매도 신호, 추세 반전, 변동성 지표, 기술 분석, MT5 지표, 스캘핑, 시장 강도, 거래 신호, 알고리즘 거래, 가격 채널 Quantum Pulse Force는 가격 흐름의 가속도를 측정하고, 통계적 축적 구간을 식별하며, 높은 확률의 수렴 신호를 생성하도록 설계된 MetaTrader 5용 기술적 지표입니다. 이 지표는 여러 정량적 분석 기법을 결합하여 시장 움직임에 대한 통합적이고 객관적인 시각을 제공합니다. 시각적 구성 요소 지표는 차트에 다양한 그래픽 요소를 표시합니다: 색상 캔들 (흐름 및 강도 기반) 양수 및 음수 흐름 히스토그램 상단 및 하단 채널 라인 음영 처리된 구간 영역 신호 강도 라인 Z-Score 라인 매수 및 매도 화살표 차트 내 정보 패널 흐름 퍼센트 로직 핵심 계산은 두 이동평균 간 차이의 백분율 변화에 기반합니다. 해석: 양수 값은 상승 가속도를 의미 음수 값은 하락 가속도를 의미
Market Sessions + Pro Sentiment VP (Full Theme Sync Edition) The All-in-One Institutional Workspace for MetaTrader. Elevate your trading environment with a professional-grade toolkit designed for high-precision day trading. This isn't just an indicator; it’s a total chart transformation. The   Market Sessions + Pro Sentiment VP   replaces cluttered, manual setups with an automated, institutional-style dashboard. Key Features: Automatic Theme Sync:   Instantly transforms your MetaTrader interfac
Liquidity HeatMap Profile
Israr Hussain Shah
5 (1)
Here   our more valuable tools SMC Trend Trading   ,  Easy SMC Trading  ,  Institutional SMC Architect Volume Analysis Tools  ,  Volume flow Profile  ,  Market volume profile  , FVG with Volume  , Liquidity Heatmap Profile  ,  Volume Spread Analysis 2. Key Features Dynamic Filtering : The core feature. As soon as the current price crosses a historical liquidity level, that level disappears. This reduces chart clutter and prevents you from trading off "dead" support/resistance. Liquidity Heatma
ArroX
Zahed Khodarahmi
ArroX Indicator Description ArroX is a technical analysis indicator designed for MetaTrader 5 platform. This indicator analyzes price movements and market trends to provide trading signals. Key Features: - Displays buy and sell arrows on the chart - Includes trend filtering capabilities - Provides multiple take profit levels - Shows market analysis information panel - Supports different signal sensitivity modes - Uses Bollinger Bands and moving averages for analysis - Includes stop loss calc
CvdDeltaVolumes
Parasbhai N Patel
Delta + CVD & CVD Candles Order-flow indicator combining Delta (Ask–Bid), Cumulative Volume Delta (CVD), and a unique CVD-based synthetic candle system. Shows buy/sell pressure, volume aggressiveness, and momentum shifts with optional Delta histogram, CVD line, and CVD+Delta combined candles. Useful for scalping, intraday trading, divergence detection, and understanding buyer/seller dominance. Overview The Delta + CVD & CVD Candles Indicator combines multiple order-flow tools into one clean
Volume Profile DD 1B
OBARE PAUL OTIENO
중요 공지 – 라이선스 및 활성화 필요 활성화 지침: 구매를 완료한 후 즉시 저희에게 연락하여 라이선스 키, 비밀번호 또는 활성화 세부 정보를 받으십시오. 이들이 없으면 소프트웨어가 작동하지 않습니다. 저희는 원활한 활성화 과정을 보장하고 질문에 대해 도움을 드리기 위해 여기 있습니다. 다국어 사용자 지정 거래 경험을 향상시키기 위해 소프트웨어를 여러 언어로 완벽하게 사용자 지정할 수 있습니다. 저희 팀은 다음 언어로 번역을 제공할 수 있습니다: 중국어 | 프랑스어 | 포르투갈어 | 스페인어 | 러시아어 일본어 | 독일어 | 한국어 | 이탈리아어 | 터키어 선호하는 언어를 알려주시면, 사용자 친화적인 경험을 보장하기 위해 인디케이터를 맞춤 설정하겠습니다. 볼륨 프로필 – 고급 시장 분석 도구 볼륨 프로필은 거래자들에게 시장 역학에 대한 깊은 통찰을 제공하도록 설계된 정교한 분석 도구입니다. 시간이 지남에
Adjustable Consecutive Fractals  looks for 2 or more fractals in one direction and sends out a on screen alert, sound alert and push notification, for strong reversal points . Adjustable Consecutive Fractals, shows the fractals on chart along with a color changing text for buy and sell signals when one or more fractals appear on one side of price. Adjustable Consecutive Fractals is based Bill Williams Fractals . The standard Bill Williams fractals are set at a non adjustable 5 bars, BUT withe th
Moving Ratio
Ricardo Rodrigues Lucca
"Moving Ratio Candle" is used to check the distance of a candle to a theoretical pressure point. Furthermore, we have two points of interest, the first for the mean and the second for the median. This indicator uses the shape of bars and the line that crosses the bar from left to right is based on the calculation of the closing price for both sides. The rest follows a more standard calculation. The same could be done as a line, but I want to know the behavior of this indicator in relation to the
FREE
Volume flow Profile
Israr Hussain Shah
Master Edition은 거래량과 자금 흐름의 관점을 통해 시장 구조를 시각화하도록 설계된 전문가급 분석 도구입니다. 표준 거래량 지표와 달리, 이 도구는 차트에 일일 거래량 프로필을 직접 표시하여 가격 발견이 발생한 위치와 "스마트 머니"가 위치한 곳을 정확하게 볼 수 있게 합니다. 이 Master Edition은 명확성과 속도를 위해 설계되었으며, 로드 시 차트 레이아웃을 즉시 아름답게 만드는 독특한 자동 테마 동기화 시스템을 특징으로 합니다. 주요 기능: 진정한 자금 흐름 계산: 표준 틱 거래량을 넘어섭니다. "Use Money Flow"를 활성화하면 거래량이 가격에 따라 가중치가 부여되어 특정 가격 수준에서의 실제 자본 투입을 드러냅니다. 가치 영역(VA) 시각화: 가치 영역(기본값: 거래량의 70%)을 자동으로 계산합니다. VA Fill: 통제 구역을 즉시 식별하기 위해 가치 영역 배경을 음영 처리합니다. 주요 수준: 통제점(POC), 가치 영역 고점(VAH), 가치 영
ICT Yoshi Pro
Le Quang Thanh
Market Structure, Liquidity and Price Action Analysis for MetaTrader 5 A chart can contain plenty of information and still leave a trader without a clear decision. A BOS label may appear, liquidity may be nearby, and an order block may remain active, yet the real challenge is understanding how those elements relate to one another. ICT Yoshi Pro organizes that process into a cleaner, more disciplined MetaTrader 5 workflow. What ICT Yoshi Pro Does ICT Yoshi Pro is a manual decision-support indicat
Expert VWAP TripleMA
Michael Amorim Vieira
Expert VWAP TripleMA is a visual indicator developed for traders who want to concentrate essential readings of average price, trend, and operational confluence into a single tool. It combines a daily VWAP, VWAP standard deviation bands, and up to 3 independent moving averages, all fully configurable by the user. Its purpose is to reduce dependence on multiple external indicators and provide a cleaner, more objective, and better organized view directly on the MetaTrader 5 chart. The indicator was
Setup Double 7s
Luigi Nunes Labigalini
Entry and exit signals from the Double 7's Strategy by Larry Connors in his book "Short Term Trading Strategies That Work". Larry claims this strategy predicted the market's direction over 80% of the time since 1995. Picking up the gains and being exposed in the market less than 25% of the time. Good for swing trading on Daily charts of SPY, Nasdaq, China's FXI, Brazil's EWZ and the majority of the equity ETFs and World Indices. How does it work? The indicator activates the buy signal when we
Boom Crash SMC
Israr Hussain Shah
Here   our more valuable tools SMC Trend Trading   ,  Easy SMC Trading  ,  Institutional SMC Architect Volume Analysis Tools  ,  Volume flow Profile  ,  Market volume profile  , FVG with Volume  , Liquidity Heatmap Profile  ,  Volume Spread Analysis Deriv boom and crash index spike killer system you can use it only on m5 timeframe  follow the structure and get signal with alert on phone open trade set sl tp and enjoy easy analysis and trading made simple 
Breakout Boxes with Volume Pressure This indicator automates the identification of key consolidation zones (Supply and Demand) based on Market Pivots and Volatility (ATR). Unlike standard support/resistance tools, this indicator provides a unique   Volume Pressure Analysis   inside every box, giving you insight into the battle between Buyers and Sellers before a breakout occurs. Key Features Automated Supply & Demand Zones:   Automatically detects significant Pivot Highs and Lows to draw dyna
표시기는 현재 시세를 작성하여 과거 시세와 비교할 수 있으며 이를 바탕으로 가격 변동을 예측합니다. 표시기에는 원하는 날짜로 빠르게 이동할 수 있는 텍스트 필드가 있습니다. 옵션: 기호 - 표시기가 표시할 기호 선택. SymbolPeriod - 지표가 데이터를 가져올 기간 선택. IndicatorColor - 표시기 색상. HorisontalShift - 지시자가 그린 따옴표를 지정된 막대 수만큼 이동합니다. Inverse - true는 인용 부호를 반대로, false - 원래 보기를 반전합니다. ChartVerticalShiftStep - 차트를 수직으로 이동합니다(키보드의 위/아래 화살표). 다음은 날짜를 입력할 수 있는 텍스트 필드의 설정으로, '엔터'를 누르면 즉시 이동할 수 있습니다.
TradeAQ
Guo Sheng Zhao
LuoMo Volume & Price Structure 8.98 A multi-function chart indicator for   MetaTrader 4 and MetaTrader 5 , designed to display key volume, volatility, sentiment, and price-structure information directly on the main chart. Main Features Volume and price-based Support & Resistance Volume spike and exhaustion signals ATR volatility expansion alerts Volume Profile with HVN and LVN Bullish and bearish sentiment distribution Developing or fixed POC VAH and VAL levels Supply and Demand zones Volume-wei
Blahtech Market Profile MT5
Blahtech Limited
5 (10)
Was: $249  Now: $99   Market Profile defines a number of day types that can help the trader to determine market behaviour. A key feature is the Value Area, representing the range of price action where 70% of trading took place. Understanding the Value Area can give traders valuable insight into market direction and establish the higher odds trade. It is an excellent addition to any system you may be using. Inspired by Jim Dalton’s book “Mind Over Markets”, this indicator is designed to suit the
Volume profile CVD Frato
Francisco Felipe Alves Da Silva Rocha
5 (2)
Frato Volume Profile Pro v7.5 Frato Academy 개발 이 지표는 MetaTrader 5용 가격-거래량 프로필을 표시합니다. 설정 가능한 기간 동안 가격 레벨별 거래량 분포를 계산하고 결과를 메인 차트에 직접 표시합니다. 주요 기능: 색상 그라데이션을 사용한 거래량 프로필 이 지표는 가격 범위를 레벨로 나누고 각 레벨에 해당하는 거래량을 할당합니다. 각 레벨의 색상은 거래량에 따라 연속적인 그라데이션으로 변합니다. 낮은 거래량 레벨은 차가운 색조(진한 파란색)를, 높은 거래량 레벨은 따뜻한 색조(노란색)를 나타냅니다. 최고 거래량 레벨인 POC(Point of Control)는 시각적으로 강조 표시됩니다. 참조선: POC, VAH, VAL 이 지표는 자동으로 세 개의 수평선을 그립니다. - POC(Point of Control): 최고 거래량 레벨 - VAH(Value Area High): 가치 영역의 상한선 - VAL(Value Area Low
FREE
KS 피보나치 추세선 가격 알림 통합 도구 이 도구는 MetaTrader 5(MT5)용 다기능 알림 지표로, 세 가지 유형의 작도 도구를 하나의 편리한 패키지로 통합했습니다. 주요 기능 3-in-1 작도 도구 (모두 가격 터치 시 알림 기능 포함): 수평 가격선 (전통적인 지지/저항 알림) 추세선 (드래그 및 기울기 조절 가능) 피보나치 되돌림/확장 도구 (사용자 지정 레벨 지원) 가격이 선이나 레벨에 닿을 때 스마트 알림 제공: 사운드 알림 (MT5 기본음 또는 사용자 지정 .wav 파일) 팝업 알림 창 모바일 푸시 알림 시각적 피드백 (알림 발생 후 선/레벨 색상이 회색으로 변경) 핵심 기능 모든 도구를 생성하고 관리할 수 있는 통합 제어 패널 클릭 한 번으로 생성 가능한 버튼: + 새 알림선, + 새 추세선, + 새 피보나치 완전한 드래그 이동 지원 (표준 MT5 기능) 패널을 통한 사용자 지정 기본 설정: 색상, 스타일, 선 두께 피보나치 레벨
MR Volume POC Levels 5
Sergey Khramchenkov
The most important price level in any "Volume profile" is the "Point of Control" . This is the price level with the highest trading volume. It is primarily the level where large players initiate their positions, making it the accumulation/distribution level for the "Smart money" . The idea of the indicator arose after the "MR Volume Profile 5" indicator was made. When creating the "MR Volume Profile 5" indicator, we spent a lot of time comparing the volumes with those from the volume profile in
Description The indicator uses market profile theory to show the most relevant trading zones, on a daily basis. The zones to be shown are LVN (low volume nodes) and POC (point of control). An LVN zone is one which represents price areas with the least time or volume throughout the day. Typically, these areas indicate a supply or demand initiative, and in the future, they can turn into important breakout or retracement zones. A POC zone is one which represents price areas with the most time or vo
Multiple TimeFrame MACD Confluency Tool
Kelvin Souza Da Costa Oliveira
Multiple Timeframe MACD indicator. This indicator was built for making multiple timeframe analysis possible in MT5 using MACD Indicator. MACD Indicator traditionally shows two lines and one histogram. MACD Line(Yellow) is calculated by subtracting 12period EMA(fast) from 26period EMA (slow). Signal Line(Blue) is created by a 9period EMA from MACD Line. Histogram is just the difference between MACD and Signal lines. Histogram is colored based on the difference between its value and the previous h
TrendView Zero
Rafael Grecco
TrendView Zero — Zero Setup. Zero Complexity. Maximum Clarity. Over time, we received valuable feedback from traders who tested TrendView Ultimate, our most advanced indicator. Many loved its power and depth, but also shared a common challenge: “It’s incredibly powerful, but it gives SO much information that I don’t always know what to configure.” This inspired the creation of TrendView Zero, a fully automated, streamlined version that keeps only the information that matters most. It provide
Forex Volume MT5
KEENBASE SOFTWARE SOLUTIONS
KT Forex Volume은 통화쌍의 매수 및 매도 거래량을 컬러 히스토그램 형태로 표시합니다. 거래량은 자산에 대한 매수 및 매도 거래로 구성됩니다. FX 시장에서: 매수량이 매도량보다 많으면 해당 통화쌍의 가격은 상승하는 경향이 있습니다. 매도량이 매수량보다 많으면 해당 통화쌍의 가격은 하락하는 경향이 있습니다. 주요 기능 틱 볼륨 데이터를 활용하여 나쁜 거래를 피할 수 있습니다. 시장 내 큰 자금을 움직이는 플레이어의 방향에 따라 거래할 수 있도록 도와줍니다. Metatrader의 모든 알림 기능이 포함되어 있습니다. 틱 볼륨 활용하기 기타 시장과 달리, 현물 외환 시장은 중앙 집중식이 아니기 때문에 개인 트레이더가 실제 볼륨 데이터를 얻는 것은 매우 어렵습니다. 2011년 베테랑 외환 트레이더 Caspar Marney가 발표한 연구에서는 틱 볼륨과 실제 거래량 사이에 높은 정확도와 상관관계가 있다고 결론지었습니다. 히스토그램 계산 공식 KT Forex Volume 지표
Balance Aggression
Edson Cavalca Junior
The indicator measures the balance of aggression. The formula is as follows:   Aggression  = Purchase Volume - Sales Volume. Note : It is rec ommended to use the default configuration and VPS values. It does not work in Forex. Meet Our Products     Parameters : Numbers of days prior to the current one for calculation; Volume Divider e; Enables calculation of the current candle; Histogram Line style and; Size; Line Line style and; Size;  Follow us on our website to check the next news.
TradersParadiseView: Institutional Liquidity & Trend Logic TradersParadiseView is a professional-grade momentum and supply/demand indicator designed to identify high-probability "Smart Money" entries. Unlike standard lagging indicators, this tool focuses on Institutional Trap Zones and Market Volatility Confluence to provide precise entries with minimal drawdown. Developed for the modern trader, it translates complex price action into simple, actionable visual zones and signals. How it Works Tra
Deriv Boom and crash
Israr Hussain Shah
Here   our more valuable tools SMC Trend Trading   ,  Easy SMC Trading  ,  Institutional SMC Architect Volume Analysis Tools  ,  Volume flow Profile  ,  Market volume profile  , FVG with Volume  , Liquidity Heatmap Profile  ,  Volume Spread Analysis Boom: Take SELL signals only (price spikes up then crashes) Crash: Take BUY signals only (price drops then spikes up) SL goes beyond the line as labeled Interactive Market Watch Panel : A left-side sidebar showing real-time strength indicators (po
Professional Support and Resistance Indicator This indicator was developed as a market context study and analysis tool , designed to help identify potentially relevant areas on the chart through the combination of price action, volume, and higher-timeframe market structure . The indicator displays two layers of horizontal dashed lines , positioned at areas considered relevant for analysis. This allows traders to observe different support and resistance zones and evaluate their relationship with
이 제품의 구매자들이 또한 구매함
이 제품은 2026년 시장에 맞게 업데이트되었으며 최신 MT5 빌드에 최적화되었습니다. 가격 업데이트 안내: Smart Trend Trading System은 현재 $99 에 제공됩니다. 다음 30회 구매 후 가격은 $199 로 인상됩니다. 특별 혜택: Smart Trend Trading System 구매 후 저에게 개인 메시지를 보내시면 Smart Universal EA를 무료 로 받을 수 있으며, Smart Trend 신호를 자동 거래로 전환할 수 있습니다. Smart Trend Trading System은 리페인트 없음, 재그리기 없음, 지연 없음의 완전한 트레이딩 시스템으로, 더 깨끗한 신호, 더 나은 추세 방향, 그리고 더 체계적인 시장 거래 방식을 원하는 트레이더를 위해 제작되었습니다.   [User Manual]   ,  [PDF]  ,   [Installation manual]   and  [Online course] 이 시스템은 추세 감지, 반전 구간, Smart
Trend Sniper X
Sarvarbek Abduvoxobov
5 (12)
Trend Sniper X 는 MetaTrader 5용 멀티 타임프레임 추세 추종 지표로, 트레이더가 추세 방향과 잠재적 반전 지점을 명확하고 정확하게 식별하도록 돕습니다. 가격 정보: 현재 가격은 프로모션 가격이며, 향후 업데이트 및 새로운 기능 출시 시 변경될 수 있습니다. Code2Profit 채널 멀티 타임프레임 분석으로 시장을 마스터하세요! Trend Sniper X로 승률을 극대화하는 방법: 핵심 규칙 및 세션 팁 기술 사양 플랫폼 MetaTrader 5 지표 유형 멀티 타임프레임 추세 지표 운용 타임프레임 모든 차트 타임프레임 지원, 독립적으로 선택 가능한 상위 타임프레임(M1–MN1) 주요 상품 외환, 금(XAUUSD) 및 기타 CFD 권장 계좌 모든 계좌 유형 시각화 색상별 추세 캔들(매수/매도/약세/변경) + 매수/매도 화살표 추가 모듈 세션 시장 박스(시드니, 도쿄, 런던, 뉴욕) 주요 기능 멀티 타임프레임 추세 분석: 상위 타임프레임의 추세 방향을 현재 차트에
Neuro Poseidon MT5
Daria Rezueva
4.85 (54)
Neuro Poseidon is a new indicator by Daria Rezueva. It combines precise trading signals with adaptive TP/SL levels - creating best possible trades as a result! Message me and get  Neuro Poseidon Assistant  as a gift to automize your trading process! What makes it stand out? 1. Proven profitability on all assets and timeframes 2. Only confirmed BUY and SELL signals present on the chart 3. Adaptive TP & SL levels generated by the software for each trade 4. Easy to understand - suitable for al
SuperScalp Pro
Van Minh Nguyen
4.63 (32)
SuperScalp Pro – 전문 멀티 레이어 컨플루언스 스캘핑 시스템 SuperScalp Pro 는 다중 컨플루언스를 기반으로 한 전문 스캘핑 시스템으로, 트레이더가 더 높은 확률의 매매 기회를 식별할 수 있도록 설계되었습니다. 명확한 진입 신호 확인, ATR 기반 손절(Stop Loss) 및 목표가(Take Profit), 그리고 XAUUSD, BTCUSD 및 주요 외환 통화쌍에 대한 유연한 신호 필터링 기능을 제공합니다. SuperScalp Pro Auto Trader EA를 통해 자동 매매를 지원합니다:   [Auto Trader] SuperScalp Pro 트레이딩 로직을 기반으로 한 자동 Gold 스캘핑 EA: [SuperScalp Gold] 제품 업데이트, 뉴스 및 공지사항을 확인하려면 SuperScalp Pro 공식 MQL5 채널을 팔로우하세요: [Official Channel] SuperScalp Pro 는 Supertrend, VWAP, EMA, RSI, A
Welcome to ENTRY IN THE ZONE AND SMC MULTI TIMEFRAME Entry In The Zone and SMC Multi Timeframe is a real-time market analysis tool based on Smart Money Concepts (SMC), designed to analyze market structure, price direction, and key trading zones. It supports both Single-Timeframe Analysis and Multi-Timeframe Analysis, providing a clearer view of the overall market structure across multiple timeframes, with real-time BUY / SELL signals that do not repaint. It is designed to help filter trading opp
GoldenX Entry MT5
Kareem Abbas
5 (16)
GoldenX Entry는 MT5용 인디케이터로, 적응형 Smart Entry Trend 알고리즘, 신호 스코어링 시스템, 시장 레짐 감지 기능, 그리고 변동성 필터를 포함합니다. 각 신호에는 계산된 진입 레벨, 3개의 익절(TP1, TP2, TP3) 레벨, 그리고 손절(Stop-Loss) 레벨이 포함됩니다. 이 인디케이터는 다양한 시장 환경에 적응하도록 설계된 다중 분석 레이어 구조 위에 구축되어 있으며, 내장 최적화기와 통계 추적 시스템을 결합합니다. 또한 Risk-to-Reward(RR) 지표와 과거 거래 행동 기반의 정량 분석을 제공합니다. 시작은 간단합니다 — 선택한 타임프레임에서 최적화기를 실행한 뒤 차트에서 바로 인디케이터를 사용하면 됩니다. 핵심 기능 GoldenX Entry는 하나의 차트에서 신호 엔진, 트레이드 관리 기능, 그리고 과거 통계 추적을 통합합니다: - 내장 최적화기: 최적화기는 차트에서 원클릭으로 실행됩니다. 200개의 파라미터 조합을 두 단계 탐색
SMC Intraday Formula
Kareem Abbas
5 (22)
먼저 솔직하게 말하겠습니다. 어떤 인디케이터도 단독으로 당신을 수익성 있게 만들어주지 않습니다. 누군가 그렇게 말한다면, 그는 당신에게 꿈을 파는 것입니다. 완벽한 매수/매도 화살표를 보여주는 모든 인디케이터는 완벽하게 보이도록 만들 수 있습니다 — 단지 올바른 과거 구간을 확대하고 승리한 거래만 캡처하면 됩니다. 우리는 그렇게 하지 않습니다.  SMC Intraday Formula는 도구입니다. 시장 구조를 읽고, 가장 높은 확률의 가격 구간을 표시하며, 현재 스마트 머니의 흐름이 어떻게 보이는지 아주 단순한 언어로 보여줍니다. 최종 결정은 여전히 당신이 합니다. 실행도 당신이 합니다. 하지만 이제는 희망이 아니라 정확성으로 거래하게 됩니다. 우리는 이 인디케이터를 지난 약 3년 동안 골드(XAUUSD) 및 주요 외환 통화쌍의 데이 트레이딩 스캘핑에 사용해 왔습니다. M1, M5, M15, M30에서 우리의 핵심 도구입니다. 이 도구는 미래를 예측하려 하지 않습니다 — 지금 형성
Zoryk Gold
Reda El Koutbane
5 (7)
ZORYK — MetaTrader 5용 XAUUSD 전문 신호 및 트레이드 플래닝 시스템 이런 경험이 있을 것입니다. 골드를 분석하고 진입을 기다린 뒤 마침내 포지션을 열었지만 가격이 곧바로 반대 방향으로 움직입니다. 너무 일찍 청산하거나 Stop Loss를 옮기거나 몇 초 동안 망설입니다. 그 후 시장은 내가 없이도 처음 예상했던 목표까지 정확히 움직입니다. 문제는 항상 방향이 아니었습니다. 진짜 문제는 불확실성이었습니다. 정확한 진입 위치를 몰랐습니다. 어느 지점에서 원래의 트레이드 아이디어가 무효가 되는지 몰랐습니다. 가까운 수익을 확보해야 할지 더 큰 움직임을 기다려야 할지 판단하기 어려웠습니다. 현재 setup이 정말 강한지 아니면 단지 새로운 거래를 억지로 찾고 있는지도 확신하기 어려웠습니다. 골드는 매우 빠르게 움직입니다. 명확한 계획이 없다면 좋은 분석도 몇 초 만에 나쁜 결정으로 바뀔 수 있습니다. ZORYK는 이 문제를 해결하기 위해 개발되었습니다.
Divergence Bomber
Ihor Otkydach
4.89 (94)
가끔은 제가 직접 이 시스템을 이용해 거래를 하곤 합니다. 실계좌에서 제가 직접 수행하는 BOMBER 트레이딩을 확인해 보세요 - LIVE SIGNAL 이 지표를 구매하신 분께는 다음과 같은 혜택이 무료로 제공됩니다: 각 거래를 자동으로 관리하고, 손절/익절 수준을 설정하며, 전략 규칙에 따라 거래를 종료하는 전용 도우미 툴 "Bomber Utility" 다양한 자산에 맞게 지표를 설정할 수 있는 셋업 파일(Set Files) "최소 위험", "균형 잡힌 위험", "관망 전략" 모드로 설정 가능한 Bomber Utility의 셋업 파일 이 전략을 빠르게 설치, 설정, 시작할 수 있도록 돕는 단계별 영상 매뉴얼 주의: 위의 모든 보너스를 받기 위해서는 MQL5 개인 메시지 시스템을 통해 판매자에게 연락해 주세요. 독창적인 커스텀 지표인 “Divergence Bomber(다이버전스 봄버)”를 소개합니다. 이 지표는 MACD 다이버전스(괴리) 전략을 기반으로 한 올인원(All-in-On
Atomic Analyst MT5
Issam Kassas
4.44 (54)
이 제품은 2026년 시장에 맞게 업데이트되었으며 최신 MT5 빌드에 최적화되었습니다. 가격 업데이트 안내: Atomic Analyst는 현재 $99 에 제공됩니다. 다음 30회 구매 후 가격은 $199 로 인상됩니다. 특별 혜택: Atomic Analyst 구매 후 저에게 개인 메시지를 보내시면 Smart Universal EA를 무료 로 받을 수 있으며, Atomic Analyst 신호를 자동 거래로 전환할 수 있습니다. Atomic Analyst는 리페인트 없음, 재그리기 없음, 지연 없음의 Price Action 거래 인디케이터로, 수동 거래, 신호 명확성, EA 자동화를 위해 설계되었습니다. User manual: settings, inputs and strategy.   &   User Manual PDF . 가격 움직임, 강도, 모멘텀, 다중 시간대 방향 및 고급 필터를 분석하여 트레이더가 노이즈를 줄이고 약한 세팅을 피하며 더 체계적인 거래 결정을 내릴 수 있도록
Superhero
Ihor Otkydach
5 (2)
SUPERHERO 지표는 “올인원” 방식으로 설계된 다중 통화 거래 시스템입니다. 이 지표는 시장을 독자적으로 분석하여 포지션을 개설하고 청산할 시점에 대한 신호를 제공합니다. 손절매(Stop Loss) 및 익절(Take Profit) 주문을 활용하며, 위험 대비 수익 비율(R:R)은 1:1입니다. 가끔 저는 이 시스템의 신호를 바탕으로 직접 거래를 하는데, 그 결과는 다음과 같습니다— 실시간 신호 이 시스템은 스마트폰으로 푸시 알림을 전송할 수 있으므로, PC에 묶여 있을 필요 없이 “이동 중에도” 매매를 할 수 있습니다. 이는 자체 거래 전문 회사에 안성맞춤입니다. 모든 고객님께 드리는 특별 혜택: 이 지표를 구매하시는 모든 분께는 제가 특별히 준비한 유틸리티를 선물로 드릴 예정이며, 이 유틸리티는 다음과 같은 기능을 제공합니다: 손절매 및 익절 주문을 자동으로 설정합니다 가격이 목표 수준에 도달하면 자동으로 포지션을 청산합니다 미결제 주문 거래를 지원합니다 평균화 거래 모드를
Entry Points Pro for MT5
Yury Orlov
4.51 (150)
전설이 돌아왔습니다: Entry Points Pro 10. MQL5 마켓 Top-3 자리를 3년간 지켜온 전설적인 지표의 재출시입니다. 수백 개의 호평 리뷰(두 버전 합산 589개), 매일 이 지표로 거래하는 수천 명의 트레이더, 31,000회 이상의 데모 다운로드   MT4+MT5 . 지난 5년간 여러분이 남긴 리뷰를 하나도 빠짐없이 읽었고, 약속 대신 그 답을 버전 10에 담았습니다. 1999년부터 시장에서 활동하며 정직함과 자신의 평판, 그리고 고객을 소중히 여기는 개발자가 만들었습니다. Entry Points Pro의 진입 시그널은 절대 리페인팅되지 않습니다. 그리고 이번에는 개발자의 말뿐이 아니라 검증 가능한 사실입니다: 확정 시그널은 캔들 종가에서만 표시되며, 자동화 테스트에서 리페인팅 0건 이 확인되었습니다(EURUSD, XAUUSD, BTCUSD에서 2,486,568회의 불변조건 검사 — 위반 0건). 검증 방법은 공개되어 있으니 전략 테스터에서 직접 재현해 보실 수
Gann Made Easy MT5
Oleg Rodin
5 (9)
Gann Made Easy 는 mr.의 이론을 사용하여 최고의 거래 원칙을 기반으로 하는 전문적이고 사용하기 쉬운 Forex 거래 시스템입니다. W.D. 간. 이 표시기는 Stop Loss 및 Take Profit Levels를 포함하여 정확한 BUY 및 SELL 신호를 제공합니다. PUSH 알림을 사용하여 이동 중에도 거래할 수 있습니다. 구매 후 거래 방법 안내 및 유용한 추가 지표를 무료로 받으시려면 저에게 연락주세요! 아마도 Gann 거래 방법에 대해 이미 여러 번 들었을 것입니다. 일반적으로 Gann의 이론은 초보자 거래자뿐만 아니라 이미 거래 경험이 있는 사람들에게도 매우 복잡한 것입니다. Gann의 거래 방식은 이론적으로 적용하기 쉽지 않기 때문입니다. 나는 그 지식을 연마하고 Forex 지표에 최고의 원칙을 적용하기 위해 몇 년을 보냈습니다. 표시기는 적용하기가 매우 쉽습니다. 차트에 첨부하고 간단한 거래 권장 사항을 따르기만 하면 됩니다. 지표는 지속적으로 시장 분석
FiboSniper Pro
Van Minh Nguyen
5 (2)
FiboSniper Pro – 전문 멀티 필터 Fibonacci Grid 트레이딩 시스템 FiboSniper Pro는 Fibonacci Envelopes와 ADX, EMA, RSI, ATR 및 시간 필터를 포함한 여러 단계의 시장 확인 조건을 결합한 고급 기술적 트레이딩 지표 시스템입니다. 가격 구조, 추세, 모멘텀 및 변동성 분석을 종합하여 보다 선별적이고 높은 품질의 진입 기회를 식별할 수 있도록 지원하며, 체계적인 거래 관리를 위해 ATR 기반의 Stop Loss 및 Take Profit 수준을 자동으로 제공합니다. 구매 후 Auto Trader X를 사용하여 FiboSniper Pro 신호를 자동으로 거래하는 방법에 대한 안내가 필요하시면 저에게 문의해 주세요. Auto Trader X를 사용하여 FiboSniper Pro 거래 신호를 자동화하세요:  [Auto Trader X] 사용자 가이드 및 권장 설정 파일 보기: [Click here] 업데이트 및 뉴스를 확인하려면 F
M1 Sniper MT5
Oleg Rodin
5 (6)
M1 SNIPER 는 사용하기 쉬운 거래 지표 시스템입니다. M1 시간대에 맞춰 설계된 화살표 지표입니다. 이 지표는 M1 시간대 스캘핑을 위한 단독 시스템으로 사용할 수 있으며, 기존 거래 시스템의 일부로도 사용할 수 있습니다. 이 거래 시스템은 M1 시간대 거래용으로 특별히 설계되었지만, 다른 시간대에도 사용할 수 있습니다. 원래는 XAUUSD와 BTCUSD 거래를 위해 이 방법을 설계했지만, 다른 시장 거래에도 유용하다는 것을 알게 되었습니다. 이 지표의 신호는 추세 방향과 반대로 거래될 수 있습니다. 저는 지표의 신호를 활용하여 양방향으로 거래할 수 있도록 돕는 특별한 거래 기법을 알려드립니다. 이 방법은 특별한 동적 지지선과 저항선 가격 영역을 활용하는 것을 기반으로 합니다. 구매하시면 M1 SNIPER 화살표 지표를 바로 다운로드하실 수 있습니다. 또한, 아래 스크린샷에 표시된 Apollo Dynamic SR 지표는 M1 SNIPER 도구를 사용하는 모든 사용자에게 무료로
Unix Scalper
Issam Kassas
UNIX Scalper — Gold Scalping Indicator for MetaTrader 5 UNIX Scalper is a focused Gold scalping indicator designed primarily for XAUUSD on M1, M2, M3, M5, M10 and M15. It gives the trader a clear BUY, SELL or WAIT decision together with the complete trade plan: Entry, Stop Loss, TP1 and TP2 . PRICE UPDATE NOTICE: Currently available for $199. The price will   increase to $399   after the next   30 purchases . The concept is simple: wait for the signal, follow the levels, move the Stop Loss to
UZFX {SSS} 스캘핑 스마트 시그널 v4.0 MT5는 급변하는 시장에서 정확한 실시간 시그널을 필요로 하는 스캘퍼, 데이 트레이더, 스윙 트레이더를 위해 설계된 리페인팅이 없는 고성능 트레이딩 지표입니다. (UZFX-LABS)에서 개발한 이 지표는 가격 움직임 분석, 추세 확인 및 스마트 필터링을 결합하여 모든 통화 쌍과 시간대에서 높은 확률의 매수 및 매도 신호, 경고 신호, 추세 지속 기회를 생성합니다. 거래에 대한 의구심을 떨쳐버리고, 명확성, 정밀성, 그리고 규율 있는 시장 실행을 원하는 트레이더를 위해 설계된 체계적인 신호 시스템을 따르기 시작하세요. 제 추천* 최적의 시간대: 15분 이상. {H1}이 제가 가장 선호하는 시간대입니다. 그리고 그 결과는 정말 놀라울 정도입니다...!! 주요 기능 업데이트 • 자동 매수 및 매도 신호 감지 • 고급 반전 인식 로직 • 잠재적인 시장 반전 전 조기 경고 신호 • 추세 지속 확인 신호 • 진입, 손절, TP1, TP2,
Axiom Matrix
Issam Kassas
5 (6)
AXIOM MATRIX MT5 출시 가격: $99 Axiom Matrix는 출시 가격 $99에 제공됩니다. 첫 30회 구매 이후 가격은 $199로 인상됩니다. 구매 후, 안내 사항을 받고 독점 선물 보너스를 받기 위해 저에게 직접 DM을 보내주세요. Axiom Matrix는 MetaTrader 5용 전문 멀티 심볼, 멀티 타임프레임 시장 스캐너이자 의사결정 대시보드입니다. Axiom Matrix는 사용자의 Market Watch를 스캔하고, 여러 타임프레임을 분석하며, 여러 근거 엔진을 읽고, 가장 강한 기회를 비교하여 하나의 깔끔한 매트릭스 대시보드 안에서 최적의 BUY, SELL, WAIT 또는 차단 상태를 보여줍니다. 저는 무거운 시장 스캔 작업을 대신 처리해 줄 수 있는 하나의 도구가 필요했기 때문에 Axiom Matrix를 만들었습니다. 저는 RSI만 따로 확인하고 싶지 않았습니다. 그다음 MACD만 따로 확인하고. 그다음 이동평균. 그다음 거래량. 그다음 변동성. 그다음
Gem SIGNAL
Shengzu Zhong
5 (1)
GEM Signal Pro GEM Signal Pro는 MetaTrader 5용 추세추종형 지표로, 차트에서 더 명확한 신호, 더 구조적인 트레이드 설정, 그리고 더 실용적인 리스크 관리를 원하는 트레이더를 위해 설계되었습니다. 단순한 화살표만 표시하는 것이 아니라, GEM Signal Pro는 전체 트레이드 아이디어를 더 깔끔하고 읽기 쉬운 방식으로 보여줍니다. 조건이 확인되면 진입가, 손절가, 목표가를 차트에 표시하여 트레이더가 설정을 더 효율적으로 검토할 수 있도록 도와줍니다. 작동 방식 이 지표는 먼저 내부 로직에 따라 유효한 초기 신호를 식별합니다. 확인 조건이 충족되면, GEM Signal Pro는 차트에 전체 설정을 표시합니다. 이를 통해 트레이더는 거래 구조를 더 명확하게 보고, 수동 분석 작업을 줄일 수 있습니다. 차트에 표시되는 거래 레벨 확인된 신호에 대해, GEM Signal Pro는 다음을 표시할 수 있습니다. 진입가 손절가 목표가 1 목표가 2 목표가 3 손
Trend Catcher ind mt5
Ramil Minniakhmetov
5 (18)
트렌드 캐처 인디케이터 트렌드 캐처 인디케이터는 개발자가 자체 개발한 맞춤형 적응형 트렌드 분석 지표들을 조합하여 시장 가격 움직임을 분석합니다. 단기적인 노이즈를 제거하고 근본적인 모멘텀 강도, 변동성 확대, 가격 구조 움직임에 집중하여 진정한 시장 방향을 파악합니다. 또한 이동 평균, RSI, 변동성 필터와 같은 맞춤형 지표들을 활용하여 가격을 평활화하고 트렌드를 필터링합니다. 실제 운영 모니터링 및 기타 제품은 다음 링크에서 확인하실 수 있습니다:   https://www.mql5.com/en/users/mechanic/seller 텔레그램에서는 EA나 설정 파일을 판매하지 않습니다. 사기이니 주의하세요. 모든 설정 파일은 블로그에서 무료로 제공됩니다. 중요! 구매 후 즉시 연락 주시면 사용 방법 및 보너스를 드립니다!
Advanced Supply Demand MT5
Bernhard Schweigert
4.53 (15)
현재 33% 할인! 초보자나 전문 트레이더를 위한 최고의 솔루션! 이 보조지표는 우리가 다수의 독창적 기능과 새로운 공식을 통합한 독특하고 고품질이며 저렴한 거래 도구입니다. 이 업데이트를 통해 이중 시간대를 표시할 수 있습니다. 더 높은 TF를 표시할 수 있을 뿐만 아니라 차트 TF와 더 높은 TF 모두를 표시할 수 있습니다: 중첩 영역 표시. 모든 Supply Demand 트레이더들이 좋아할 것입니다. :) 중요한 정보 공개 Advanced Supply Demand의 잠재력을 극대화하려면 다음을 방문하십시오. https://www.mql5.com/ko/blogs/post/720245   진입 또는 목표의 명확한 트리거 포인트를 정확히 찾아냄으로 해서 거래가 어떻게 개선될지 상상해 보십시오. 새로운 알고리즘을 기반으로 매수자와 매도자 간의 잠재적인 불균형을 훨씬 더 쉽게 분간할 수 있습니다. 왜냐하면 가장 강한 공급영역과 가장 강한 수요 영역과 과거에 어떻게 진행 되었는지를(이전
Crystal Heikin Ashi Signals
Muhammad Jawad Shabir
5 (4)
Crystal Heikin Ashi Signals - Professional Trend & Signal Detection Indicator Advanced Heikin Ashi Visualization with Intelligent Signal System for Manual & Automated Trading Final Price: $149 ---------> Price goes up $10 after every 10 sales . Limited slots available — act fast . Overview Crystal Heikin Ashi Signals is a professional-grade MetaTrader 5 indicator that combines pure Heikin Ashi candle visualization with an advanced momentum-shift detection system. Designed for both manual traders
KURAMA GOLD SIGNAL PRO (MT5) — 7중 필터 · 자동 TP/SL · 품질 점수 · 시그널 기록 저장 | XAUUSD 완전 트레이딩 시스템 실시간 리페인트 없음. 시그널이 나타나는 순간 화살표, 진입, TP, SL이 그 자리에 고정되어 이후 절대 움직이지 않습니다. 여러분이 거래하는 것은 바로 이 실시간 시그널입니다. 그리고 v7.20에서는 실제로 발신된 모든 시그널이 자동 저장되어 재시작 후에도 정확히 복원됩니다. 구매자 전용 보너스 평생 라이선스를 구매하시면 AI Zone Radar($59 상당) + 완전 PDF 매뉴얼을 무료로 드립니다. 제품 가격에 더해 $59 상당의 보너스가 따라옵니다. 구매 후 MQL5로 메시지를 보내주세요. AI Zone Radar: https://www.mql5.com/en/market/product/175834 골드 트레이더 커뮤니티에서 실제로 사용되며 정확성과
Power Candles MT5
Daniel Stein
5 (10)
Power Candles V3 - 자체 최적화 강도 지표 파워 캔들 V3는 적용된 모든 차트에서 통화 및 상품의 강세를 실행 가능한 거래 계획으로 전환합니다. 단순히 캔들에 색상을 입히는 대신, 백그라운드에서 실시간 자동 최적화를 수행하여 현재 보고 있는 종목에 대한 최적의 손절매, 익절 및 신호 임계값을 제공합니다. 한 번의 클릭으로 실시간 거래에 적용할 수 있으며, 진입점, 손절매 및 익절 선이 정확한 가격에 맞춰 차트에 표시되고, 방향과 함께 알림이 발령됩니다. 이 도구는 Stein Investments 에코시스템의 일부입니다. 18개 이상의 도구와 함께 당신의 1대1 AI 트레이딩 멘토 Max.  항상 대기 중, 모든 인디케이터를 깊이 있게 이해, 무언가를 차근차근 생각해보고 싶은 순간에 도움을 줍니다.  https://stein.investments 에서 만나보세요 매 종가 바마다 3,000회 이상의 트레이딩 시뮬레이션. 9가지 강도 상태. 2가지 전략을 병렬로 테스트.
Smc Pro ToolKit
Talal N Z Aljarusha
5 (10)
SMC PRO TOOLKIT — SMART MONEY ANALYSIS & STRUCTURED TRADE PLANNING SMC Pro ToolKit is a professional Smart Money Concepts analysis workspace for MetaTrader 5. It combines market structure, multi-timeframe analysis, institutional price zones, setup evaluation, confirmation tools, volume context, alerts, and risk planning inside one organized chart environment. One workspace. Multiple layers of confirmation. One structured trading plan. OPEN COMPLETE USER GUIDE MULTI-CONDITION SETUP ENGINE At
SR Liquidity MT5
Oleg Rodin
5 (2)
SR Liquidity 는 시장 유동성이 집중되고 가격이 가장 강력하게 반응하는 숨겨진 구간을 포착하도록 설계된 트레이딩 지표입니다. 이러한 특수 유동성 구간은 강력한 지지 및 저항선 역할을 하며, 시장 반전 가능성이 가장 높은 지점을 명확하게 보여주는 지도가 되어 줍니다. SR Liquidity는 일반적인 지지 및 저항선을 단순히 그리는 대신, 실제 가격 움직임을 분석하여 매수 및 매도 압력이 집중되는 구간을 포착합니다. 이러한 구간은 실질적인 시장의 흐름을 주도하는 유동성 풀(liquidity pools)에 해당합니다. 이 지표는 해당 구간을 차트에 직접 시각화하여, 가격 반응이 실제로 나타나기 전에 이를 미리 예측할 수 있도록 돕습니다. 즉, 가격 추세가 전환될 가능성을 사전에 파악하게 해주는 것입니다. 결과적으로 이 지표는 가공되지 않은 가격 움직임(price action)을 시장의 핵심 가격대, 다시 말해 추세 전환점이 될 수 있는 지점들을 보여주는 명확하고 실용적인 로드맵
SkyHammer Signal Pro
Shengzu Zhong
5 (4)
SkyHammer Signal Pro Entry, SL, TP 레벨이 고정되는 전문 No-Repaint 추세 신호 인디케이터 SkyHammer Signal Pro는 명확하고 고정되며 검증 가능한 신호를 원하는 트레이더를 위해 설계된 구조적인 추세 및 모멘텀 신호 인디케이터입니다. 특히 M1 및 M5 같은 낮은 시간대에서 가장 효과적으로 작동합니다. 이 인디케이터는 시장의 고점이나 저점을 예측하려고 하지 않습니다. 대신 신호를 생성하기 전에 확인된 시장 구조, 추세 방향, 모멘텀 강도, 건강한 변동성, 그리고 목표까지의 충분한 공간을 기다립니다. 주요 기능 고정 신호 메커니즘 신호가 확인되면 화살표, Entry, Stop Loss, TP1, TP2 레벨이 차트에 영구적으로 고정됩니다. 이후 캔들 움직임 때문에 신호가 사라지거나, 이동하거나, 변경되지 않습니다. 이를 통해 트레이더는 각 신호를 명확하게 검토할 수 있으며, 실시간 시장에서 신호가 사라지는 일반적인 문제를 피할 수 있습니다
Ace Trend
Mikhail Sergeev
5 (3)
우리는 당신에게 트렌드 거래의 세계에서 게임의 규칙을 변경하는 혁신적인 지표를 제시한다. 이 표시기는 성능을 재고하고 거래 경험을 전례없는 높이로 높이도록 설계되었습니다. 우리의 표시기는 경쟁 업체와 차별화 된 고급 기능의 고유 한 조합을 자랑합니다. "실제 가격 요인"의 첨단 기술은 가장 어렵고 휘발성 시장 상황에서도 탁월한 안정성을 보장합니다. 불안정한 패턴,깨진 지표 및 의식적이고 통제 된 거래에 작별 인사를하십시오. 표시기는 단지 아름다운 그림이 아닙니다! 지표는 거래자의 편으로 확률을 이동시켜 이익을 얻어야 합니다. 표시 신호(완전 자동 모드)에 따라 거래 결과에 익숙해: https://www.mql5.com/ko/signals/2339244 표시기는 형성된 막대에 다시 그리지 않습니다. 막대가 형성된 경우 표시기 판독 값은 변경되지 않습니다. 이 표시기는 모든 시간대에 작동합니다. 표준은 시간대입니다. 귀하의 의견은 매우 중요합니다! 당신은 어떤 질문,제안이,또는 당신의
Crystal Quantum Pro
Muhammad Jawad Shabir
5 (3)
CRYSTAL QUANTUM PRO Institutional Signal & Trade Intelligence for MetaTrader 5 Final Price: 199 USD ----> Price goes up 10 USD after every 10 sales. Limited launch slots available, act fast. Most indicators give you an arrow and leave you alone. A naked arrow is a gamble. Winning consistently requires CONFLUENCE , a clear STOP and TARGET , and honest PROOF that the system works. Crystal Quantum Pro delivers all three in one clean, no-repaint package. Crystal Quantum Pro is a complete decision sy
Reversion King Indicator
Eugen-alexandru Zibileanu
5 (6)
새로운 왕의 등장 - 인디케이터 + 주문 관리 표시(TP1 + TP2 + TP3) + 선택형 텔레그램 시그널 전송 기능 포함 (무료) (완전한 트레이딩 및 시그널 시스템) 골드를 위한 최고의 EA: Gold Slayer 이 인디케이터는 고급 전략, 사용자 지정 가능한 주문 관리 시스템, 그리고 엔벨로프 확장을 결합한 평균 회귀(mean reversion) 시스템을 포함하고 있습니다. 또한 RSI와 같은 여러 지능형 확인 필터를 통해 높은 확률의 반전 진입 구간을 포착하여 BUY 및 SELL 시그널을 제공합니다. 단순히 거래 방법만 배우는 것이 아니라, 여러 포지션을 효과적으로 관리하고 이전에 수익 중인 오픈 포지션으로 손실 거래를 커버하는 방법까지 익힐 수 있습니다. M5 전용으로 설계 및 최적화되었으며, 유동성이 풍부해 시그널이 더 깔끔하고 신뢰도 높은 BTCUSD와 XAUUSD에서 뛰어난 성능을 발휘합니다. 이 인디케이터는 ATR 기반으로 자동 계산된 진입가, 손절가, 익절가와
필터:
리뷰 없음
리뷰 답변