
Multi Timeframe Volatility Dashboard
- 지표
-
Mikita Kupchyk
 Практикующий алгоритмическую торговлю трейдер.
 - 버전: 1.1
- 업데이트됨: 17 7월 2026
Multi Timeframe Volatility Dashboard
Free indicator for multi-timeframe volatility analysis
Description
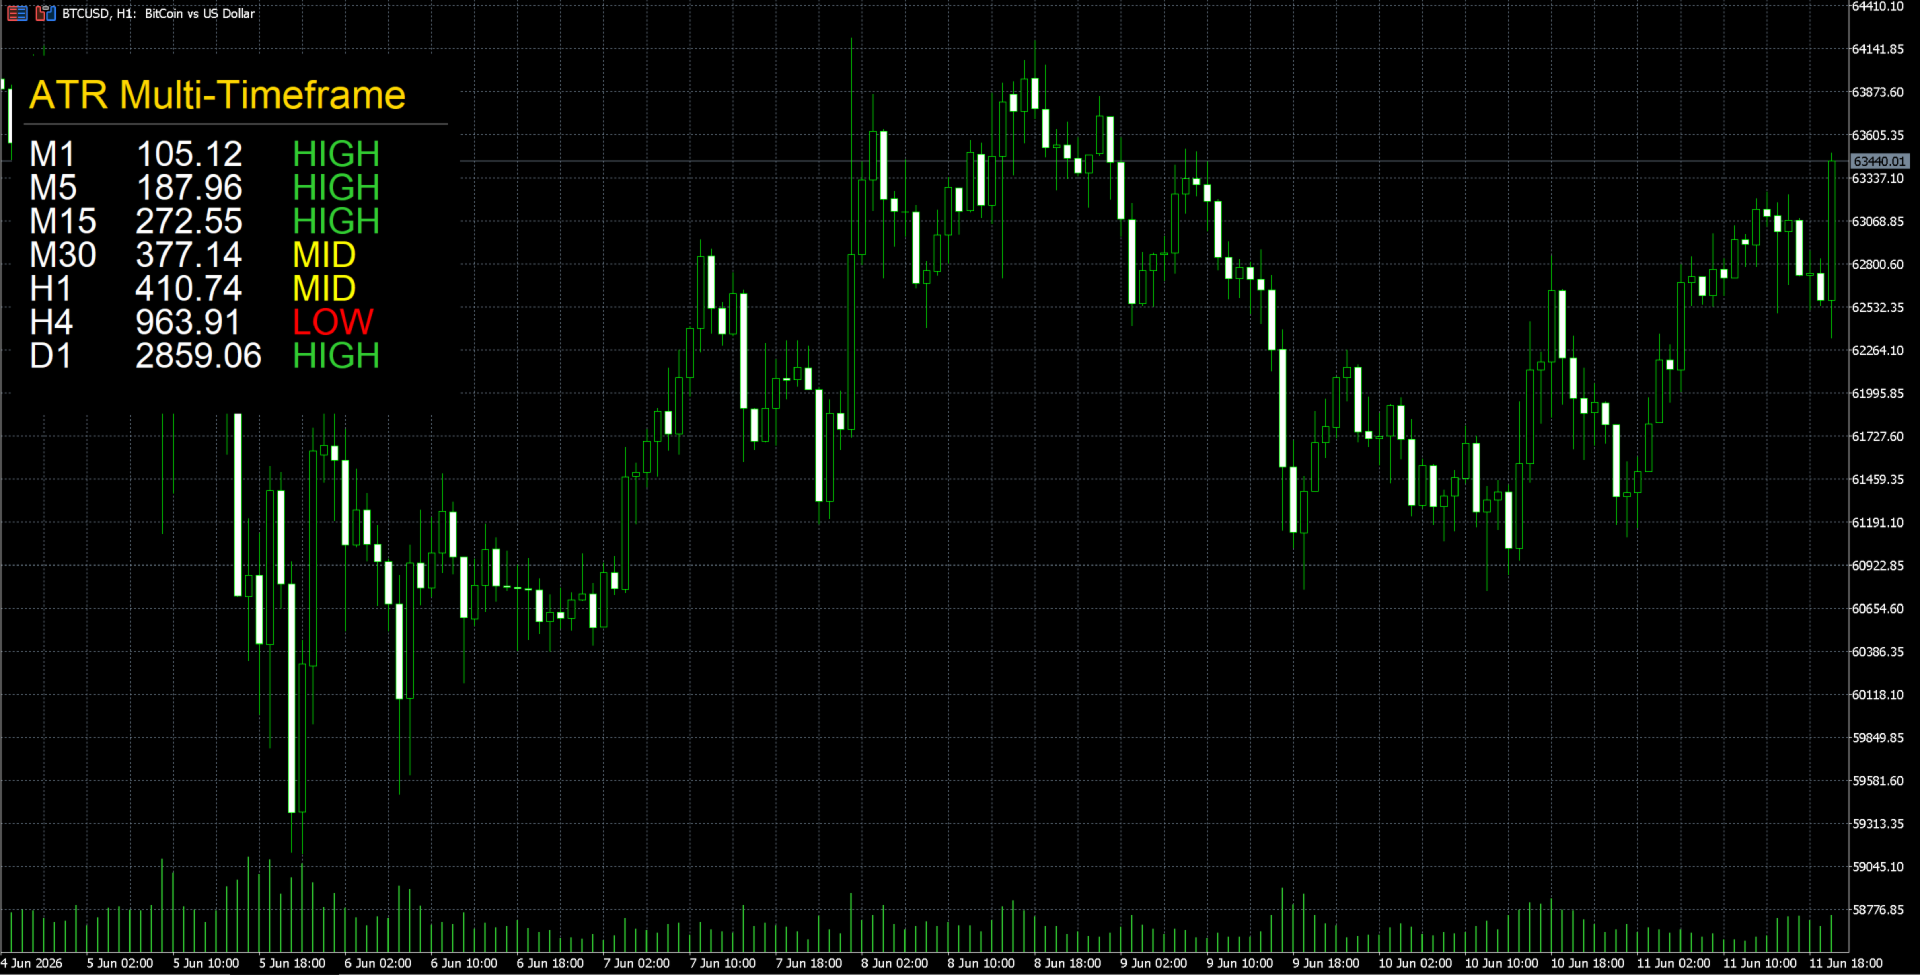
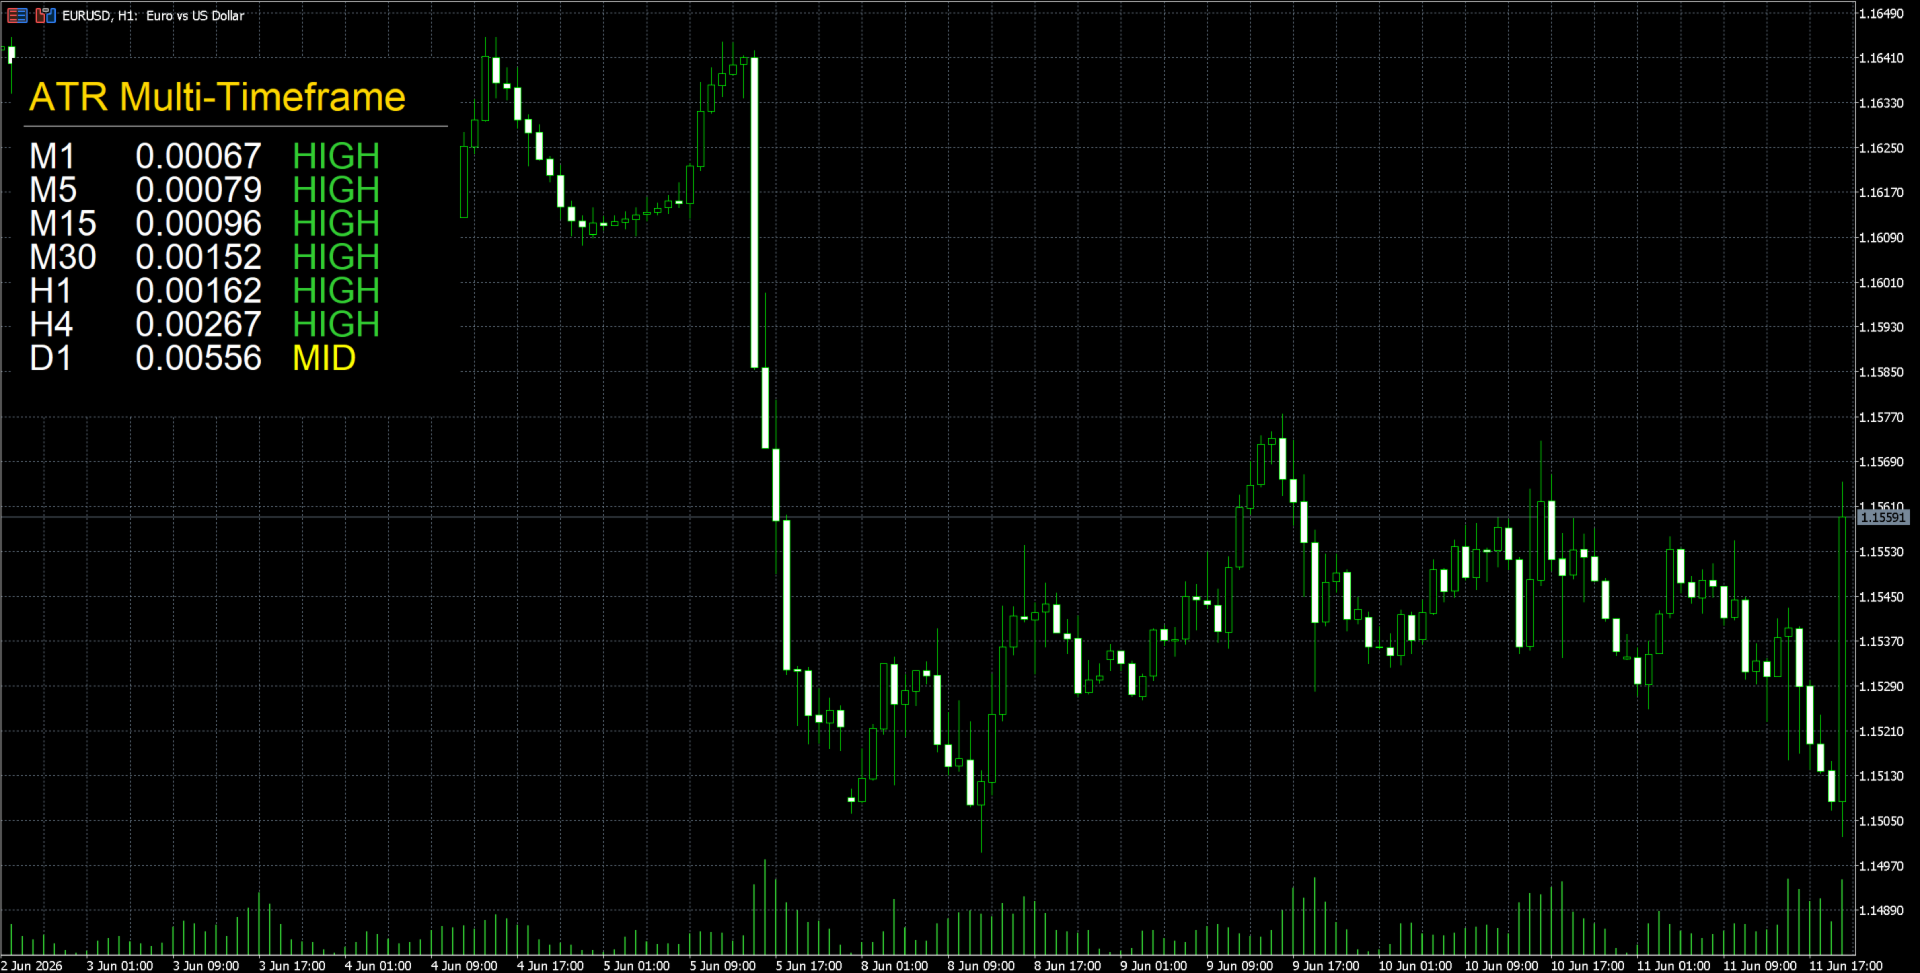
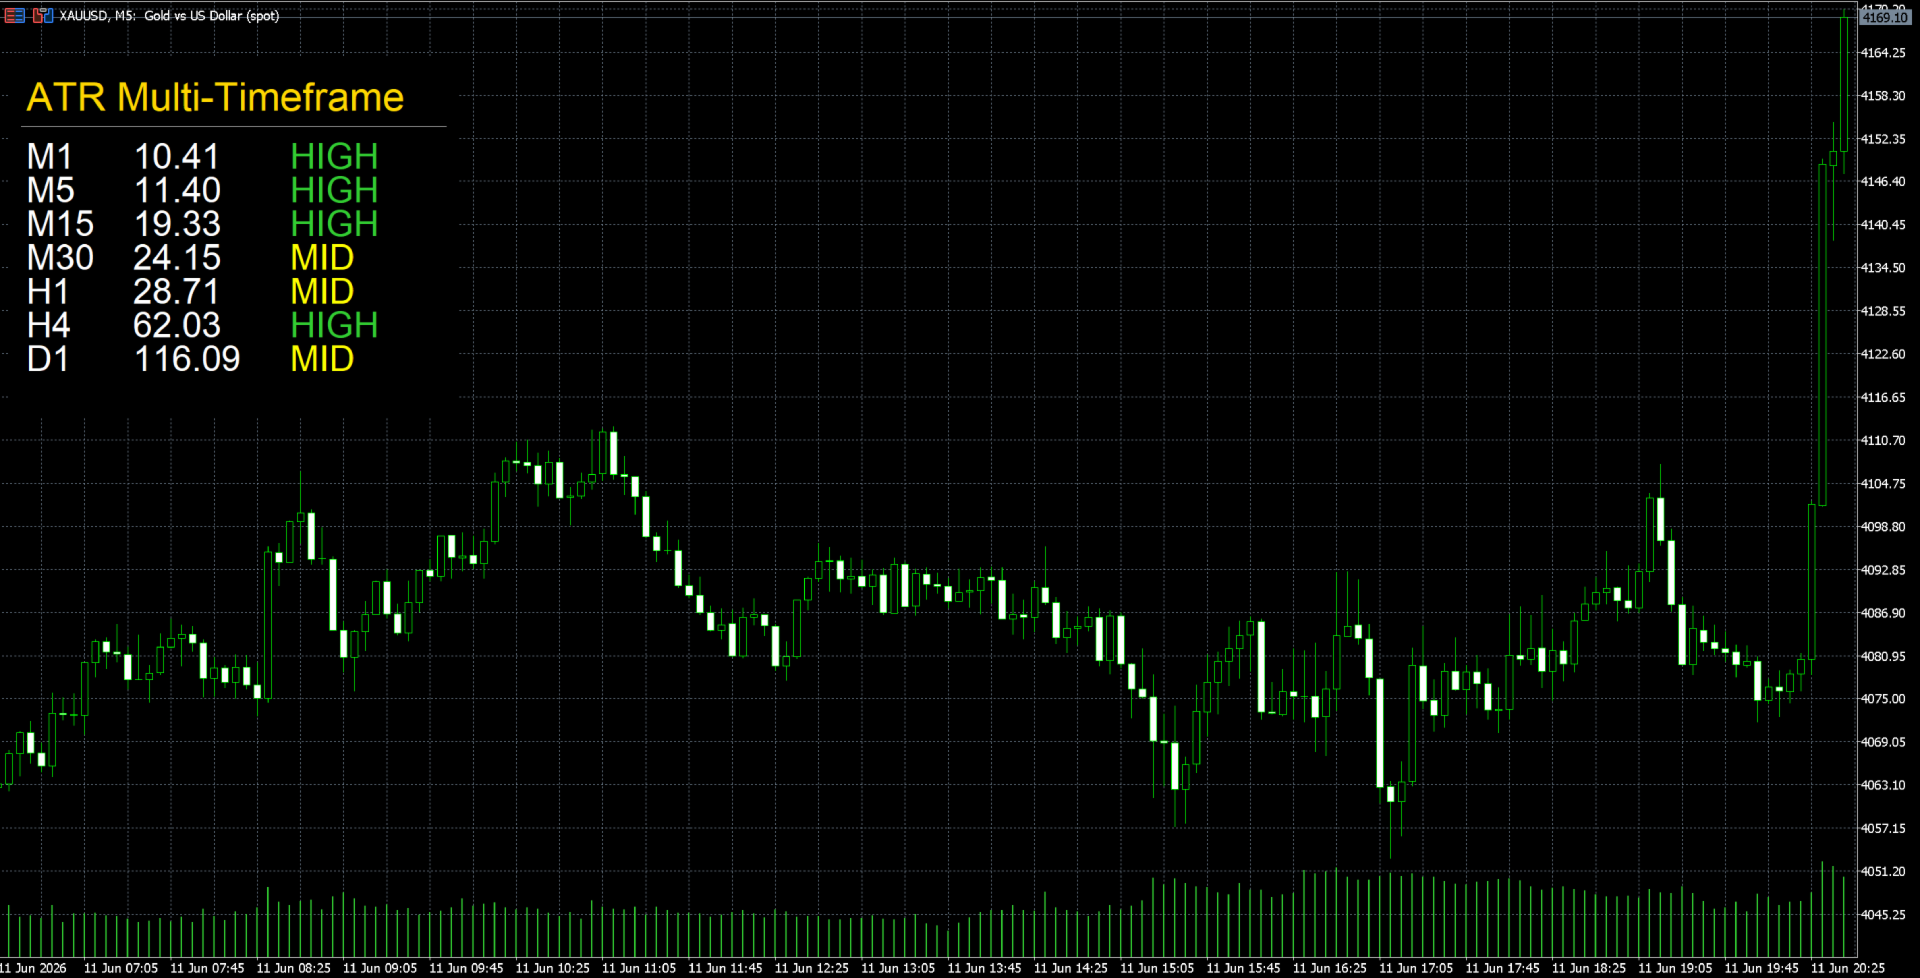
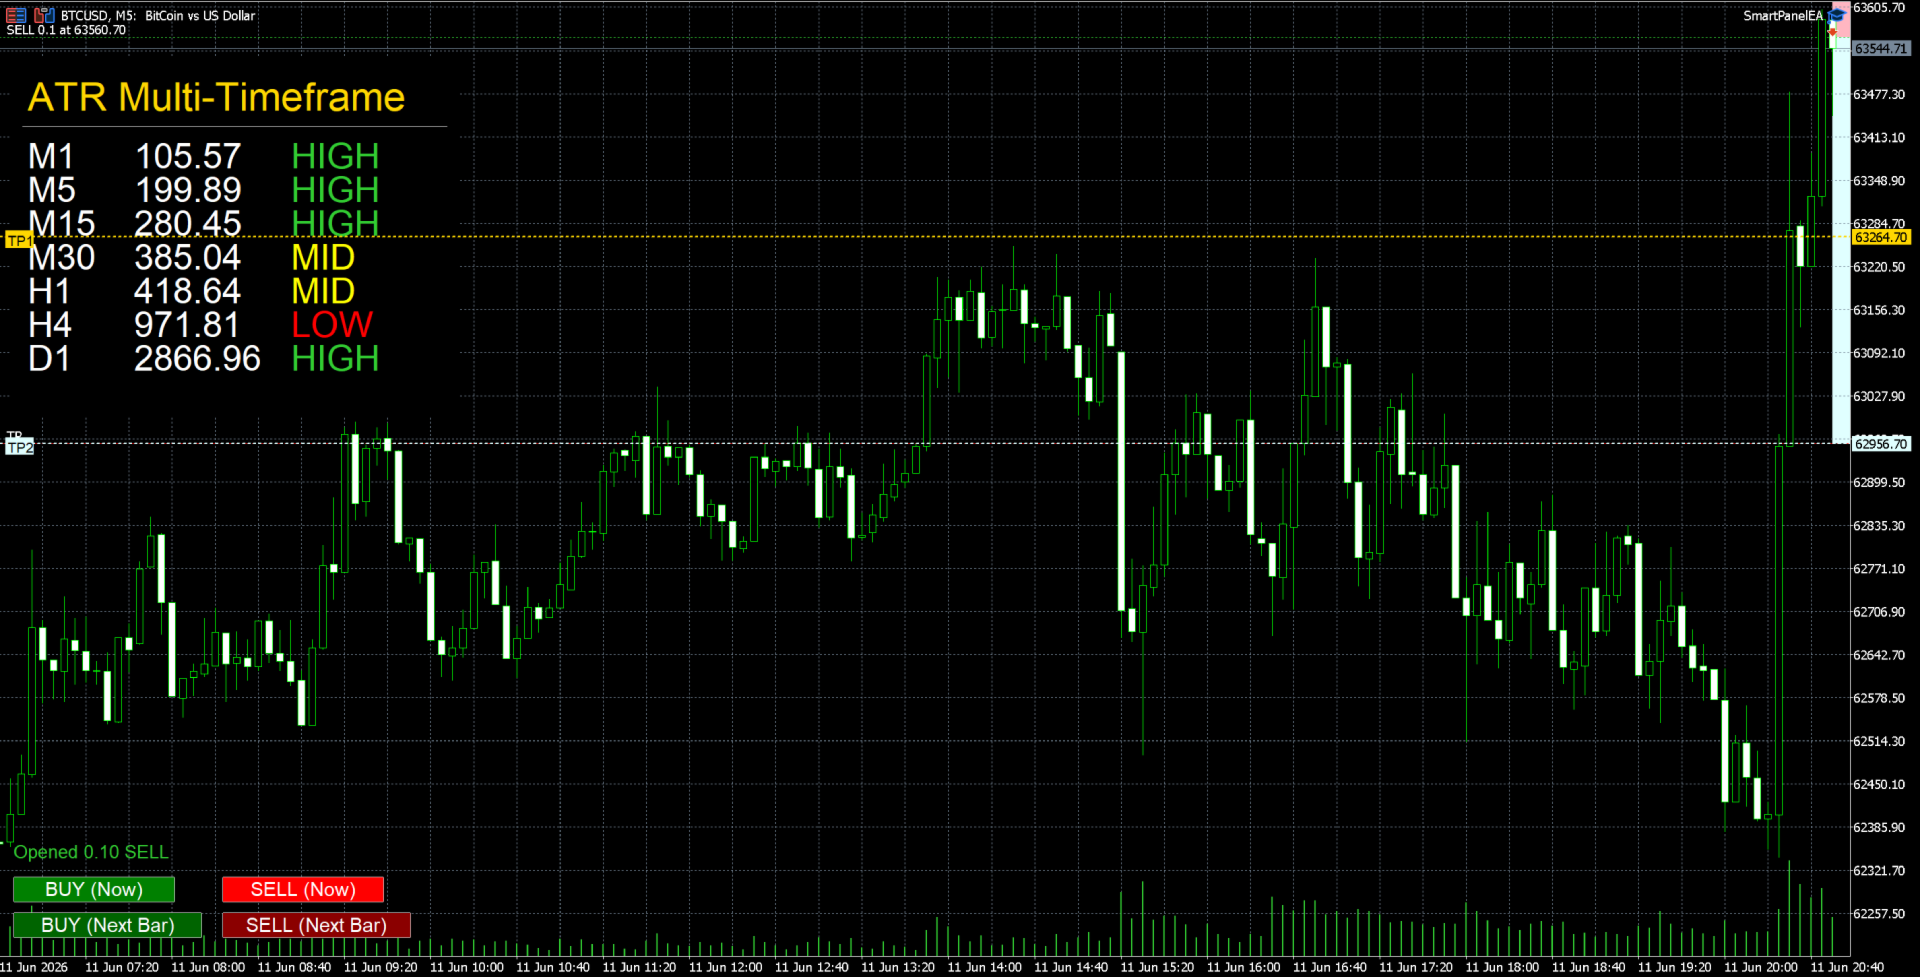
Multi Timeframe Volatility Dashboard is a powerful and convenient tool for traders that allows instant assessment of current market volatility across 7 timeframes simultaneously. The indicator displays ATR (Average True Range) values and classifies volatility as **LOW, MEDIUM, or HIGH** relative to the average value over a specified lookback period.
Key Features
- Multi-timeframe analysis: simultaneous display of ATR on M1, M5, M15, M30, H1, H4, D1
- Volatility classification: automatic determination of volatility level (LOW/MID/HIGH)
- Color coding: intuitive color-coded volatility representation
- Adaptive interface: automatic scaling to screen resolution
- Customizable display: ability to disable unwanted timeframes
- Compact panel: minimalist design that doesn't clutter the chart
How It Works
The indicator calculates the current ATR value for each selected timeframe and compares it to the average value over the **lookback period** (default 50 bars). Based on this ratio, the volatility level is determined:
- LOW (Green): current ATR < 80% of average — market is calm
- MID (Yellow): current ATR within 80–120% of average — normal volatility
- HIGH (Red): current ATR > 120% of average — high volatility
Advantages
- Time-saving: no need to switch between timeframes
- Fast decision-making: instant assessment of market conditions
- Versatility: suitable for any trading strategy
- Free: completely free tool with no limitations
- Ease of use: simple setup and intuitive interface
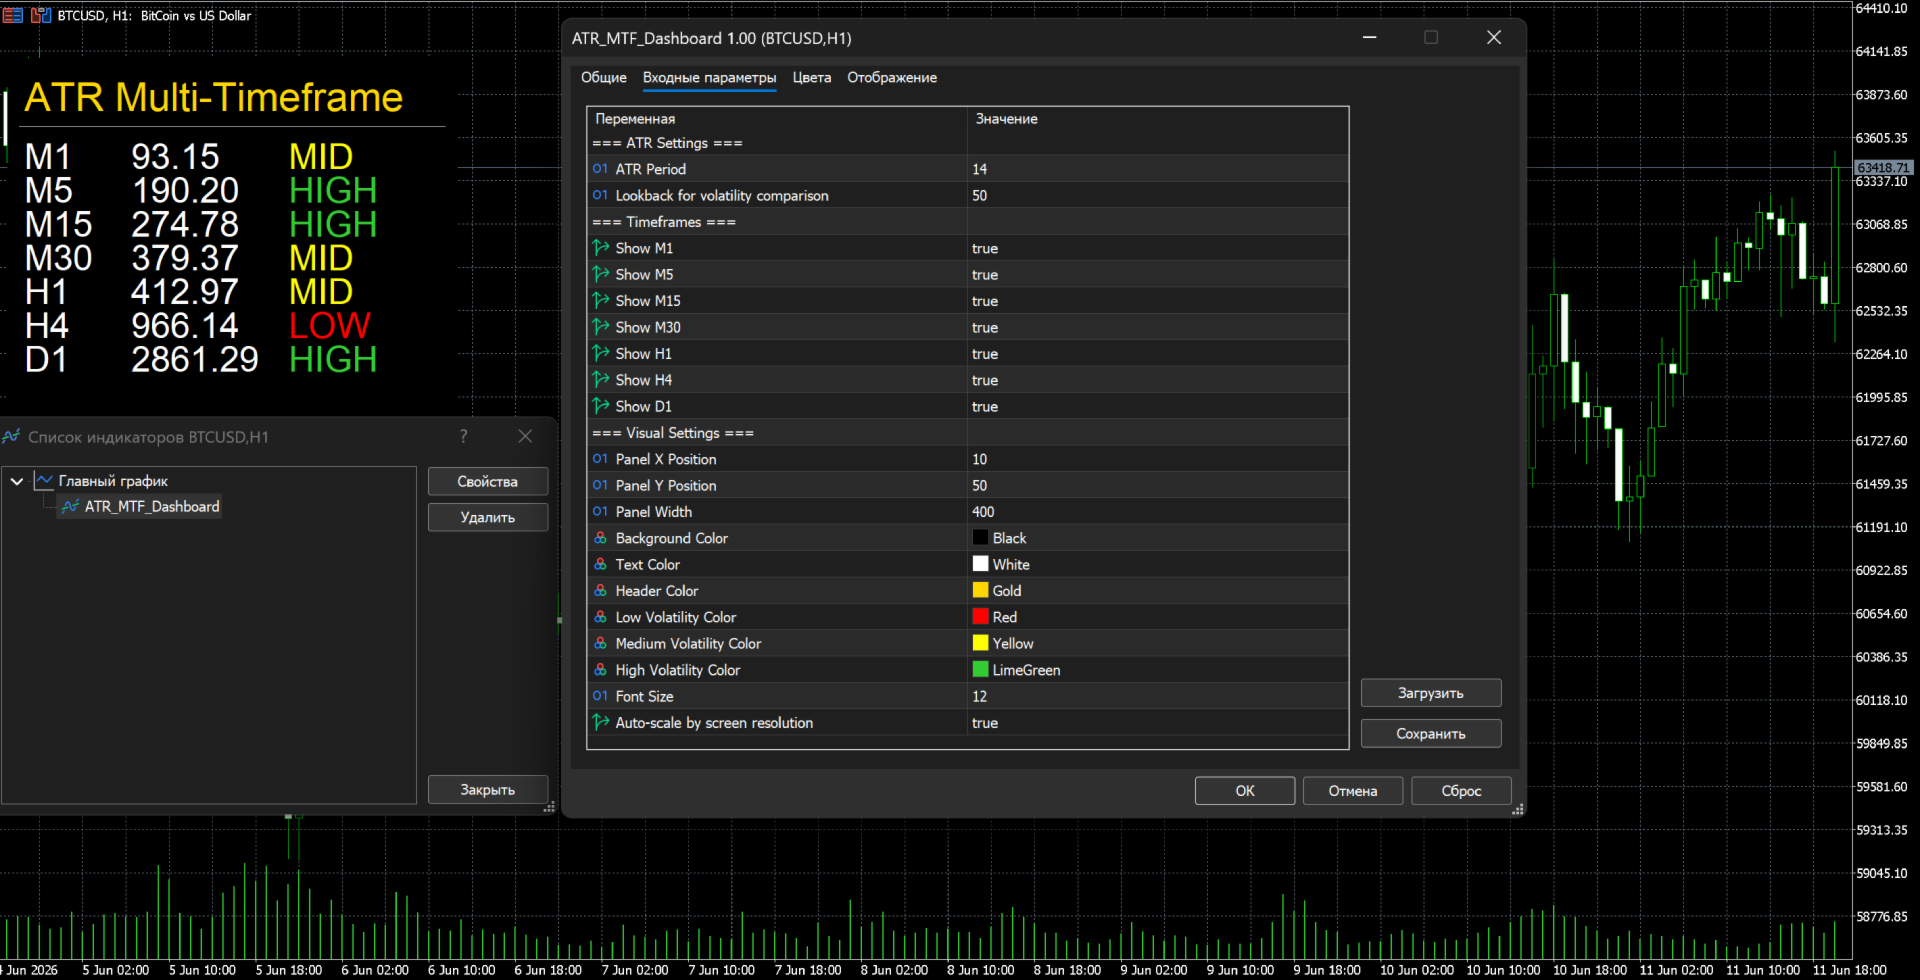
Settings
ATR Settings:
- ATR Period: ATR period (default 14)
- Lookback for volatility comparison: period for average ATR calculation (default 50)
Timeframes:
- Show M1/M5/M15/M30/H1/H4/D1: enable/disable display of the corresponding timeframe
Visual Settings:
- Panel X Position: panel X-axis position (default 10)
- Panel Y Position: panel Y-axis position (default 50)
- Panel Width: panel width (default 400)
- Background Color: panel background color
- Text Color: text color
- Header Color: header color
- Low Volatility Color: color for low volatility (green)
- Medium Volatility Color: color for medium volatility (yellow)
- High Volatility Color: color for high volatility (red)
- Font Size: font size (default 12)
- Auto-scale by screen resolution: automatic scaling to screen resolution
How to Use
1. Install the indicator on the chart via **Navigator → Indicators**
2. Adjust parameters as needed
3. Drag the panel to a convenient location on the chart
4. Monitor volatility changes across different timeframes
Trading Applications
- Timeframe selection for entry: use timeframes with optimal volatility
- Risk management: increase stop-loss distance during high volatility
- Signal filtering: avoid entries during extremely low or high volatility
- Scalping: use M1–M5 for fast trading
- Day trading: use H1–H4 for positional trading
System Requirements
- MetaTrader 5
- Any financial instrument
- Minimal system resources
Version 1.00
Free tool for professional traders





















사용자가 평가에 대한 코멘트를 남기지 않았습니다