Anchored VWAP Studio

Anchored VWAP Studio

Anchored VWAP Studio by XTSFORGE is a workflow-oriented VWAP and Anchored VWAP indicator for MetaTrader 5. It is designed for traders who use VWAP as a structural reference and want to manage manually selected anchor points directly on the chart.

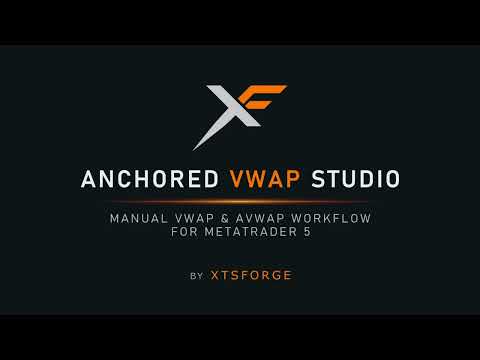
The indicator combines Daily, Weekly and Monthly VWAPs with manually placed Anchored VWAPs, optional bands, right-side price labels, alerts, hotkeys, settings profiles, anchor sets, intraday presets and an integrated chart control panel.

Anchored VWAP Studio does not generate automatic buy or sell signals. It is an analysis, reference and chart workflow tool. All trading decisions remain fully under the user's control.

Documentation

The full documentation is published as separate MQL5 articles so that each user can start with the part that is most relevant to them:

Main Features

  • Daily, Weekly and Monthly VWAP reference lines
  • Up to 20 manually placed Anchored VWAP slots
  • Configurable maximum active anchor count
  • Manual anchor placement directly on the chart
  • Individual color, visibility, band mode and label mode per anchor
  • NEW preset workflow for the next anchor before it is placed
  • Anchor marker lock and live drag preview
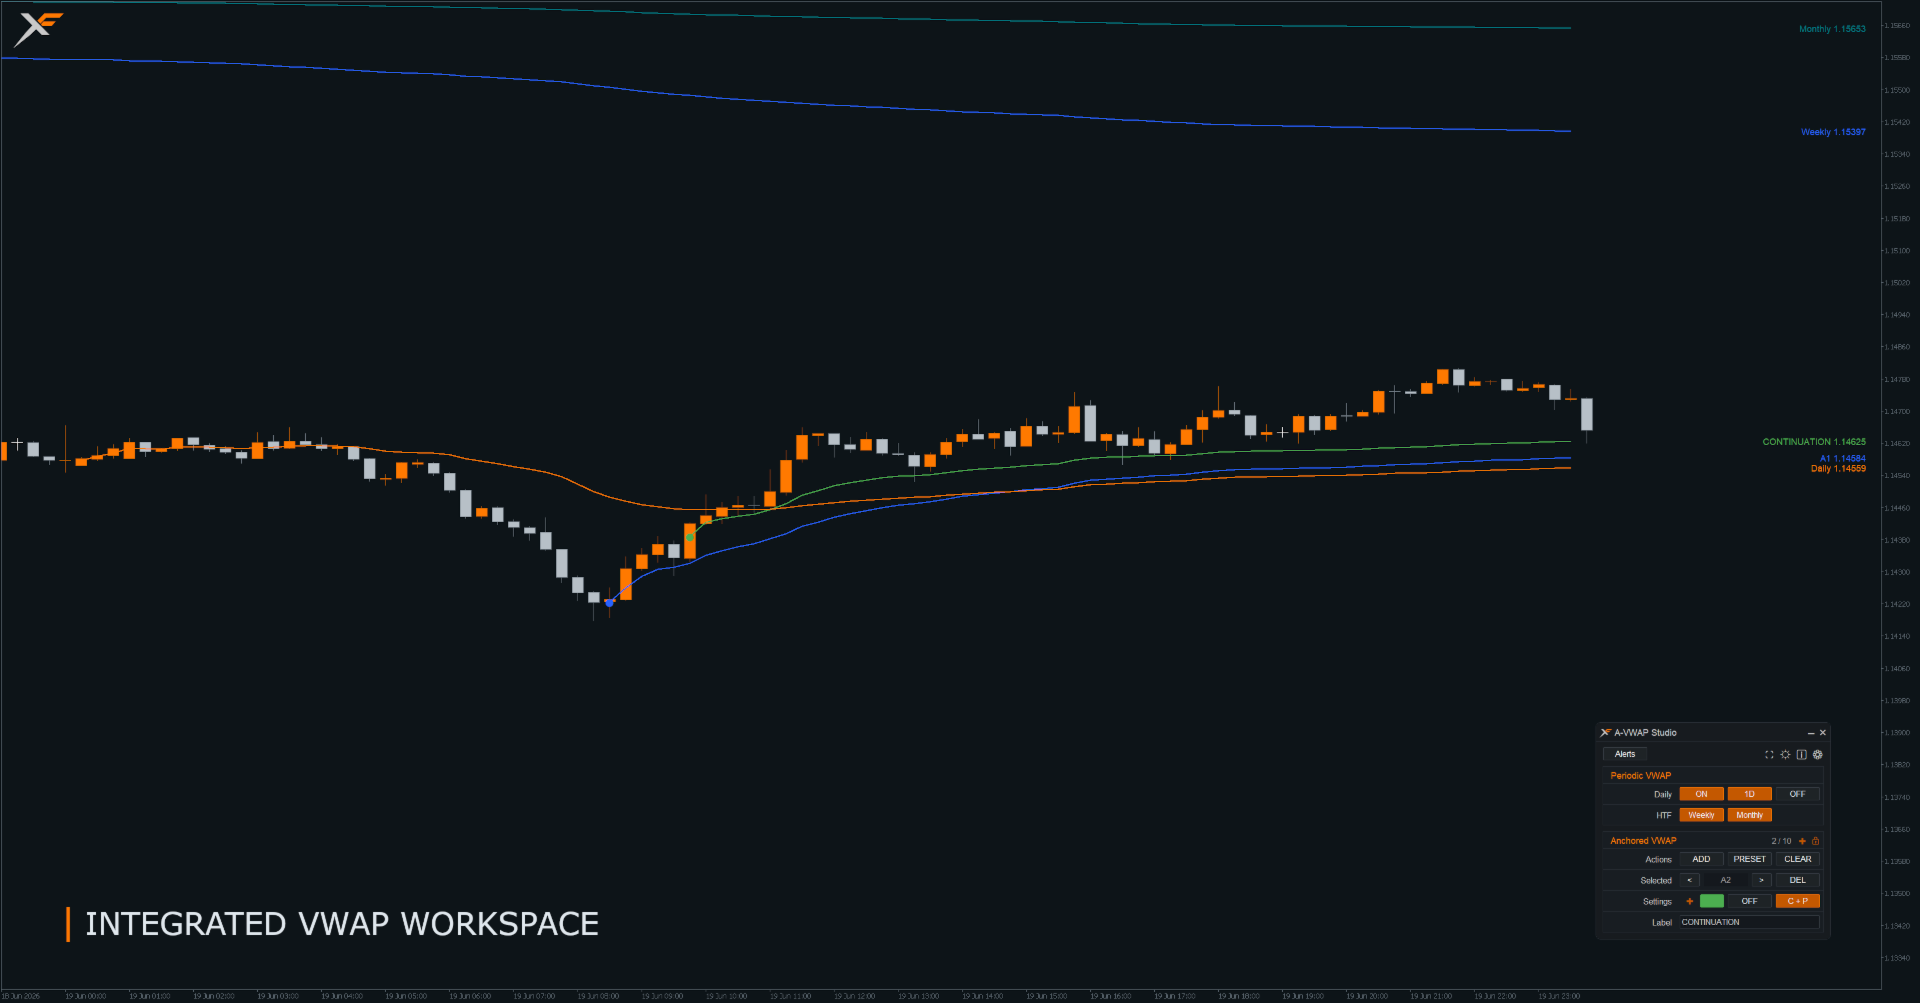
  • Optional bands for Daily VWAP and Anchored VWAPs
  • High / Low bands and standard deviation bands
  • Dual Band Mode with H/L and standard deviation bands
  • Right-side VWAP labels with collision handling
  • Custom labels for Anchored VWAPs
  • Integrated chart control panel
  • Dark, Light and Custom UI themes
  • Optional Plain Symbols UI mode
  • Configurable chart hotkeys
  • Clean Screenshot Mode
  • Alert system for VWAP and band interactions
  • Settings Profiles for saving indicator configurations
  • Anchor Sets for saving and reusing groups of anchors
  • Intraday Presets for recurring time-based anchors
  • Hidden-object Data Interface for EAs and scripts
  • Global-variable Command Interface for external control through Bridge modes

Manual Anchored VWAP Workflow

Anchored VWAP Studio is built around manual anchor decisions. Instead of automatically guessing anchor points, the indicator lets the user decide exactly where an Anchored VWAP should begin.

An anchor can be placed on a swing high, swing low, session start, impulse candle, news candle, breakout, reclaim or any other chart location that is relevant to the user's own analysis.

Each anchor can be managed individually. Color, visibility, band mode, label mode, custom label text, marker position and deletion can be controlled per anchor. The NEW preset workflow allows the next anchor to be prepared before it is placed on the chart.

Periodic VWAP Context

Daily, Weekly and Monthly VWAPs can be used as broader reference levels. The Daily VWAP supports configurable reset behavior, history display and optional bands. Weekly and Monthly VWAPs provide higher-timeframe context for intraday analysis.

Periodic VWAP labels can show the name, current price or both near the right edge of the chart, helping important VWAP levels remain readable without tracing the line back across the chart.

Bands and Labels

Daily VWAPs and Anchored VWAPs can display optional bands. Available band modes are:

  • OFF
  • High / Low bands
  • Standard deviation bands
  • Dual Mode with High / Low and standard deviation bands

Right-side labels help keep current VWAP and Anchored VWAP levels readable. Collision handling separates labels that are close together. Anchored VWAP labels can display the anchor number, price, custom text or a combination of these values.

Alerts

Anchored VWAP Studio includes optional alerts for VWAP and band interactions. Supported event types include Cross, Break, Touch and Band Touch.

Alerts can be delivered as terminal alerts, push notifications or email alerts, depending on the user's MetaTrader 5 terminal configuration. The email subject can be customized in the alert settings. Hidden Anchored VWAPs do not trigger Anchored VWAP alerts.

Hotkeys and Chart Workflow

The integrated chart panel is designed for visual chart operation. Configurable hotkeys can be used for frequent actions such as adding anchors, selecting anchors, toggling VWAPs, cycling band modes, changing labels and activating Clean Screenshot Mode.

Hotkeys are active only when the integrated UI is visible and hotkeys are enabled in the indicator inputs. In Bridge-only mode, integrated UI hotkeys are disabled.

Settings Profiles and Anchor Sets

Settings Profiles allow users to save and restore indicator configuration such as themes, line styles, label settings, alert settings and intraday preset rows. Profiles can be saved, loaded, updated, renamed or deleted from the integrated Settings window.

Anchor Sets allow users to save groups of manually placed anchors for the current symbol. A saved Anchor Set can replace the current anchors or be added to free anchor slots. Anchor Sets can also be updated, renamed or deleted.

Profiles are intended for configuration. Anchor Sets are intended for actual symbol-specific anchor collections.

Intraday Presets

Intraday Presets make it possible to add recurring time-based anchors, such as session opens, market opens or scheduled event times. Preset rows can be grouped into P1, P2 and P3 and then added to the chart or used to replace the current anchors.

Preset times are interpreted in broker server time.

Clean Screenshot Mode

Clean Screenshot Mode temporarily hides the integrated UI and related control overlays so the chart can be reviewed or captured more clearly. While the mode is active, a restore button is shown.

VWAP lines, Anchored VWAPs, labels and anchor markers remain controlled by their normal visibility settings.

Developer Functions

Advanced users can enable the hidden-object Data Interface to read current VWAP, Anchored VWAP, band and anchor-state data from EAs or scripts.

The global-variable Command Interface allows external tools to control selected indicator functions when a Bridge-capable control mode is active. Supported command areas include Periodic VWAP visibility, Daily history, Weekly and Monthly history, alerts, global anchor visibility, anchor lock state, anchor slots, colors, bands, label modes and label text.

The Data Interface and Command Interface are documented separately in the Developer Guide.

Typical Use Cases

  • Intraday VWAP analysis
  • Manual Anchored VWAP workflows
  • Anchoring from swing highs and swing lows
  • Session open and market open reference levels
  • Previous-session structure analysis
  • Anchoring from news candles or impulse moves
  • Multi-anchor confluence analysis
  • Clean chart screenshots for review and journaling
  • Alert-based monitoring of important VWAP levels
  • EA-assisted workflows through public interfaces

Important Notes

VWAP behavior depends on available historical data, broker sessions, timeframe data and the selected price and volume settings. VWAP calculations require usable broker-provided volume data. On many Forex and CFD symbols, tick volume is used when real volume is not available. If a symbol does not provide usable or reliable volume data, VWAP and Anchored VWAP calculations may be incomplete or not meaningful.

Very old anchor points may be limited by the indicator's internal performance protection logic in order to keep chart interaction responsive.

MetaTrader may render non-solid line styles such as Dash, Dot or DashDot differently depending on line width, chart zoom and display scaling. For the clearest visual distinction between non-solid styles, line width 1 is recommended.

The MQL5 Market demo version of indicators can only be tested in the MetaTrader Strategy Tester visual mode. Because Anchored VWAP Studio is designed around interactive chart controls, manual anchors, hotkeys and visual workflow, screenshots, product video and documentation are important for understanding the full on-chart workflow before choosing a rental or full license.

Risk Disclaimer

This product is a technical analysis and chart workflow tool. It does not provide financial advice, investment advice, personal recommendations, trading recommendations or guaranteed entry or exit signals.

All displayed levels, calculations, markers, bands, labels, panels, alerts and workflow functions are informational or user-configured tools only. They must be interpreted, configured and controlled by the user.

This product does not guarantee profits, does not prevent losses and does not predict future market movements. Trading financial instruments involves significant risk. Past market behavior, visual examples, screenshots, described use cases or test results do not guarantee future results.

The user is solely responsible for all trading decisions, risk management, broker selection, position sizing, product settings and the use of this product on demo or live accounts. Before using this product on a live account, it should be tested carefully in the MetaTrader 5 Strategy Tester and/or on a demo account.

Anchored VWAP Studio itself does not generate buy or sell signals. The indicator provides volume-based reference levels, Anchored VWAPs, Periodic VWAPs, bands, alerts and visual workflow tools for market analysis. Any trading decision based on these levels is made exclusively by the user.

License and Updates

The unlimited license provides unlimited product validity within the MQL5 Market activation system. Rental licenses are valid for the selected rental period.

Product updates, maintenance releases and improvements are provided through the MQL5 Market when available. Ongoing feature development is not guaranteed. Critical issues affecting documented functionality will be reviewed and addressed where reproducible.

Support

Support is provided through the MQL5 product comments and MQL5 private messages.

For bug reports, please include the MetaTrader 5 build, broker, symbol, timeframe, product version, screenshots, relevant settings and a short description of the issue. If possible, include clear steps to reproduce the issue.

Support covers installation, documented product features, settings, reproducible technical issues and general usage clarification.

Support does not include financial advice, personal trading recommendations, account-specific strategy optimization, signal services, guaranteed setup files or guaranteed trading outcomes.

Support requests are reviewed regularly. During holidays or periods of limited availability, response times may be longer. Critical reproducible bug reports are prioritized.

Privacy

The product does not collect or transmit personal user data.

The product may store local configuration and workflow data inside the user's MetaTrader 5 environment, such as indicator settings, Settings Profiles, Anchor Sets, local persistence data and terminal Global Variables used for the optional Command Interface.

Support is handled through the MQL5 platform. Please do not share account credentials, personal documents, payment data, private account numbers or other sensitive information in support messages.

추천 제품
Time and Sales Tick
Pablo Filipe Soares De Almeida
Time & Sales Tick Indicator 는 MetaTrader 5 차트에서 실시간 거래 틱 정보를 표시하는 지표입니다. 가격, 틱 거래량 및 시간을 시각적으로 보여주며, 사용자가 시장 미세 구조를 분석할 수 있도록 도와줍니다. 기능 설명 가격, 거래량 및 시간을 포함한 틱 데이터를 차트 내 패널에 실시간으로 표시합니다. 틱 데이터를 사용자가 지정한 시간 또는 수량 간격으로 그룹화하고, 상승 틱은 녹색, 하락 틱은 빨간색으로 구분하여 표시합니다. 패널은 차트의 네 모서리 중 원하는 위치로 자유롭게 이동할 수 있으며, 표시 크기와 글꼴도 사용자 설정이 가능합니다. 모든 통화쌍 및 상품에 대응하며 MetaTrader 5 플랫폼 내에서 안정적으로 작동합니다. 이 인디케이터는 스캘핑 및 틱 기반 전략을 사용하는 트레이더에게 유용합니다.
The VWAP indicator is our version of the popular Volume-Weighted Average Price indicator. The VWAP is the ratio between the value traded (price multiplied by the number of volume traded) and the total volume traded over a specific time period. As a result, it measures the average price of the instrument much better than the simple moving average. Although there are many ways to use the VWAP, most investors use it to calculate the daily average.  The indicator works in five modes: Moving  - In
WAPV Box Effort x Result
Eduardo Da Costa Custodio Santos
MT5에 대한 WA_PV_BOX_EFFORT X 결과 WAPV 상자 노력 x 결과 표시기는 패키지 표시기 그룹(Wyckoff Academy Wave Market)의 일부입니다. MT5용 WAPV Box Effort x Result Indicator는 가격과 거래량을 읽는 데 도움이 됩니다. 그 판독은 노력 x 결과의 식별을 돕는 것으로 구성됩니다. 그래프에 의해 생성된 파동. 상자가 녹색일 때 MT5에 대한 WAPV 상자 노력 x 결과 표시기는 거래량이 수요에 유리하고 상자가 빨간색일 때를 의미합니다. 물량은 공급에 유리하다. 상자가 클수록 가격에 대한 부피의 변위가 커집니다. 가격의 상승파동이 Box의 크기에 비례하지 않는다면, 노력 x 결과. 매우 시각적인 방법으로 우리는 볼륨과 가격 사이의 이러한 차이를 식별할 수 있습니다. MT5용 WAPV Box 노력 x 결과 표시기를 사용하면 표시기를 0축 아래에 배치하여 시각화를 개선할 수도 있습니다. 틱 볼륨 및 실제 볼륨으로 시장에서
Swiss VWAPsimple
Terence Gronowski
4.8 (5)
Swiss VWAPsimple Motivation Did not find free VWAP that works, the one that I found craseh. So I created a VWAP which calculates values only for the actual day. So computer resouces are not over stressed. What is VWAP, how is it used?  VWAP stands for Volume Weighed Average Price, it calculates the running sum of tick volume and the runnung sum of price times tickvolume. The division of these sums result in a weighed price (Sum P*V/Sum V). The calculation starts normally at midnight. The values
FREE
Mirror Chart MT5
Andrej Hermann
5 (1)
The Mirror Chart MT5 is a overlay indicator specifically designed to project a second financial instrument directly onto the main chart window. This tool is invaluable for traders who rely on correlation analysis, as it visualizes the price movements of two different instruments in real time. Unlike traditional overlays, this indicator utilizes intelligent, dynamic centering and scaling logic. It continuously analyzes the visible price range in the current window for both symbols and calculates
FREE
Smart FVG Stats
- Md Rashidul Hasan
5 (1)
The  Smart FVG Statistics Indicator  is a powerful MetaTrader 5 tool designed to automatically identify, track, and analyze Fair Value Gaps (FVGs) on your charts. Love it? Hate it? Let me know in a review! Feature requests and ideas for new tools are highly appreciated. :) Try "The AUDCAD Trader": https://www.mql5.com/en/market/product/151841 Key Features Advanced  Fair Value Gap  Detection Automatic Identification : Automatically scans for both bullish and bearish FVGs across specified histo
FREE
Value Chart Candlesticks
Flavio Javier Jarabeck
4.57 (14)
The idea of a Value Chart indicator was presented in the very good book I read back in 2020 , " Dynamic Trading Indicators: Winning with Value Charts and Price Action Profile ", from the authors Mark Helweg and David Stendahl. The idea is simple and the result is pure genius: Present candlestick Price analysis in a detrended way! HOW TO READ THIS INDICATOR Look for Overbought and Oversold levels. Of course, you will need to test the settings a lot to find the "correct" one for your approach. It
FREE
Blahtech Market Profile MT5
Blahtech Limited
5 (10)
Was: $249  Now: $99   Market Profile defines a number of day types that can help the trader to determine market behaviour. A key feature is the Value Area, representing the range of price action where 70% of trading took place. Understanding the Value Area can give traders valuable insight into market direction and establish the higher odds trade. It is an excellent addition to any system you may be using. Inspired by Jim Dalton’s book “Mind Over Markets”, this indicator is designed to suit the
Wapv Price and volume
Eduardo Da Costa Custodio Santos
MT5용 WAPV 가격 및 거래량 표시기는 (Wyckoff Academy Wave Market) 및 (Wyckoff Academy Price and Volume) 도구 세트의 일부입니다. MT5용 WAPV 가격 및 거래량 표시기는 차트에서 거래량 움직임을 직관적인 방식으로 쉽게 시각화할 수 있도록 만들어졌습니다. 그것으로 당신은 최대 거래량의 순간과 시장이 전문적인 관심을 갖지 않는 순간을 관찰할 수 있습니다 시장이 "스마트 머니"의 움직임이 아니라 관성에 의해 움직이는 순간을 식별합니다. 사용자가 수정할 수 있는 4가지 색상으로 구성되어 있습니다. 빨간색 = 제안 증가 녹색 = 수요 증가 회색 양초 = 수요와 공급의 감소 파란색 = 스마트머니 연기 위쪽 방향으로의 움직임은 강도를 나타냅니다. 하향 움직임 약점을 나타냅니다. Price의 방향에 상관없이 가장 강한 Volume이 올라가야 합니다. R. Wyckoff의 이론에 따라 생성된 지표
Donchian Breakout And Rsi
Mattia Impicciatore
4.5 (2)
개요 이 지표는 클래식 돈치안 채널(Donchian Channel) 의 향상된 버전으로, 실전 트레이딩을 위한 다양한 기능이 추가되었습니다. 표준 세 개의 선(상단, 하단, 중앙선) 외에도 브레이크아웃 을 감지하여 차트에 화살표로 시각적으로 표시하며, 차트를 깔끔하게 보기 위해 현재 추세 방향의 반대 라인만 표시 합니다. 지표 기능: 시각적 신호 : 브레이크아웃 시 컬러 화살표 표시 자동 알림 : 팝업, 푸시 알림, 이메일 RSI 필터 : 시장의 상대 강도를 기반으로 신호 검증 사용자 맞춤 설정 : 색상, 선 두께, 화살표 코드, RSI 임계값 등 동작 원리 돈치안 채널은 다음을 계산합니다: 상단선 : 최근 N개의 종가 완료 캔들에서 가장 높은 고가 하단선 : 최근 N개의 종가 완료 캔들에서 가장 낮은 저가 중앙선 : 고가와 저가의 평균값 상방 브레이크아웃 은 종가가 상단선을 돌파할 때 발생하며, 하방 브레이크아웃 은 종가가 하단선 아래로 내려갈 때 발생합니다. 이 지표는: 세 개의
FREE
Basic Vwap
james mugendi
4 (1)
Simple Vwap with the daily, weekly and monthly VWAP is the abbreviation for   volume-weighted average price , which is a technical analysis tool that shows the ratio of an asset's price to its total trade volume. It provides traders and investors with a measure of the average price at which a stock is traded over a given period of time. How it's used Identify entry and exit points:   Traders can use VWAP to determine when to buy or sell an asset.   Understand price trends :  Traders can use V
FREE
Simple Trend Direction MT5
Khalaf Hamza Mohammad Yousef
This is a FREE Trend Direction Indicator for MetaTrader 5. Features: Identifies market trend direction Uses EMA 50 and EMA 200 Non-repainting logic Clear visual display Suitable for manual trading Free version includes: - Single timeframe - Trend direction only - No alerts If you need: Alerts Multi-timeframe version EA automation Custom modifications My Name is Khalaf Hamza , You can contact me for freelance work --> khalaf.hamza.hi@gmail.com
FREE
VOLUME PROFILE SAF-XII MT5용 전문가급 마켓 프로파일 분석 도구 (그리드 스타일 트레이더를 위한 드림 인디케이터) 볼륨 프로파일(Volume Profile)이란? 볼륨 프로파일은 단순히 '시간'에 따른 거래량을 보여주는 일반 지표와 달리, 특정 '가격 수준'에서의 거래 활동을 표시하는 전문 기관용 도구입니다. 설정한 기간 내에 거래가 '어디서' 발생했는지를 시각화하여 다음을 식별할 수 있도록 돕습니다. 가치 영역 (VAH/VAL) – 전체 거래의 대부분이 발생한 가격대. 제어 지점 (POC) – 거래량이 가장 많이 집중된 단일 가격 수준. 유동성 불균형 – 각 가격대에서의 매수(Bull) vs 매도(Bear) 지배력. 지지/저항 – 실제 거래 활동에 기반한 자연적인 가격 지지 및 저항선. 3가지 작동 모드 – "설정 후 방치(Set and Forget)" 가능 VP_MANUAL (스윙 트레이딩 및 주요 레벨 분석) 사용자가 수직선을 드래그하여 분석 범위를 직접
Volume flow Profile
Israr Hussain Shah
Master Edition은 거래량과 자금 흐름의 관점을 통해 시장 구조를 시각화하도록 설계된 전문가급 분석 도구입니다. 표준 거래량 지표와 달리, 이 도구는 차트에 일일 거래량 프로필을 직접 표시하여 가격 발견이 발생한 위치와 "스마트 머니"가 위치한 곳을 정확하게 볼 수 있게 합니다. 이 Master Edition은 명확성과 속도를 위해 설계되었으며, 로드 시 차트 레이아웃을 즉시 아름답게 만드는 독특한 자동 테마 동기화 시스템을 특징으로 합니다. 주요 기능: 진정한 자금 흐름 계산: 표준 틱 거래량을 넘어섭니다. "Use Money Flow"를 활성화하면 거래량이 가격에 따라 가중치가 부여되어 특정 가격 수준에서의 실제 자본 투입을 드러냅니다. 가치 영역(VA) 시각화: 가치 영역(기본값: 거래량의 70%)을 자동으로 계산합니다. VA Fill: 통제 구역을 즉시 식별하기 위해 가치 영역 배경을 음영 처리합니다. 주요 수준: 통제점(POC), 가치 영역 고점(VAH), 가치 영
CvdDeltaVolumes
Parasbhai N Patel
Delta + CVD & CVD Candles Order-flow indicator combining Delta (Ask–Bid), Cumulative Volume Delta (CVD), and a unique CVD-based synthetic candle system. Shows buy/sell pressure, volume aggressiveness, and momentum shifts with optional Delta histogram, CVD line, and CVD+Delta combined candles. Useful for scalping, intraday trading, divergence detection, and understanding buyer/seller dominance. Overview The Delta + CVD & CVD Candles Indicator combines multiple order-flow tools into one clean
VWAP Indicator
LUC JACOBUS A VERHEECKE
4.11 (27)
Volume Weighted Average Price (VWAP) The volume weighted average price (VWAP) is a  trading   benchmark  used by traders that gives the average price a security has traded at throughout the day, based on both volume and price. It is important because it provides traders with insight into both the trend and value of a security. This indicator VWAP V2 is free and is the manual version of the extended Easy VWAP indicator (30 Euro), where the date and time properties are automatically entered. With
FREE
VWAP Daily
Anton Polkovnikov
Weighted average price indicator or VWAP. The well-known standard VWAP with the beginning of the day is added with the function of selecting the periodization. It can be calculated both every day and on other periods. Also the indicator allows to exclude the volume from the calculation, which will allow using it on the cryptocurrencies and forex. There is an alert for a VWAP price crossing. There are 1 and 2 standard deviation. Settings: Volume: turning volume on and off in the calculation mecha
Order Book, known also as Market Book, market depth, Level 2, - is a dynamically updated table with current volumes of orders to buy and to sell specific financial instument at price levels near Bid and Ask. MetaTrader 5 provides the means for receiving market book from your broker, but in real time only, without access to its history. The indicator OrderBook Cumulative Indicator accumulates market book data online and visualizes them on the chart. In addition, the indicator can show the market
AP Session Boxes Pro
Allan Graham Pike
AP Session Boxes — Asian / London / NY Range Overlay (MT5 Indicator) Clean session boxes on your chart. This lightweight indicator draws the   Asian ,   London , and   New York   time windows directly on the chart, including each box’s   high   and   low   as dashed lines. It’s perfect for quick context, breakout planning, and clean screenshots. Instant structure:   See where the market ranged during key sessions. Breakout prep:   Use the hi/lo lines as reference for pending orders or alerts fr
FREE
Price Magnet — Price Density and Attraction Levels Indicator Price Magnet is a professional analytical tool designed to identify key support and resistance levels based on statistical Price Density. The indicator analyzes a specified historical period and detects price levels where the market spent the most time. These zones act as “magnets,” attracting price action or forming a structural base for potential reversals. Unlike traditional Volume Profile tools, Price Magnet focuses on price-time d
PivotWave
Jeffrey Quiatchon
Introducing PivotWave – your ultimate trading companion that redefines precision and market analysis. Designed with traders in mind, PivotWave is more than just an indicator; it’s a powerful tool that captures the pulse of the market, identifying key turning points and trends with pinpoint accuracy. PivotWave leverages advanced algorithms to provide clear visual signals for optimal entry and exit points, making it easier for traders to navigate volatile market conditions. Whether you are a begin
Color Histogram Volume Set
Ricardo Almeida Branco
Do you use volume in your reading of the market? Certainly many traders use it, and do not imagine operating without it. The Color Histogram Volume Set indicator allows the user to choose the value that he considers interesting to monitor. When you pass this you will have visual confirmation and if you want you will also have the audible alert that is given by the indicator. Of course, there are other ways to try to find a high volume, such as assessing whether the volume is above av
표시기는 현재 시세를 작성하여 과거 시세와 비교할 수 있으며 이를 바탕으로 가격 변동을 예측합니다. 표시기에는 원하는 날짜로 빠르게 이동할 수 있는 텍스트 필드가 있습니다. 옵션: 기호 - 표시기가 표시할 기호 선택. SymbolPeriod - 지표가 데이터를 가져올 기간 선택. IndicatorColor - 표시기 색상. HorisontalShift - 지시자가 그린 따옴표를 지정된 막대 수만큼 이동합니다. Inverse - true는 인용 부호를 반대로, false - 원래 보기를 반전합니다. ChartVerticalShiftStep - 차트를 수직으로 이동합니다(키보드의 위/아래 화살표). 다음은 날짜를 입력할 수 있는 텍스트 필드의 설정으로, '엔터'를 누르면 즉시 이동할 수 있습니다.
If you like this project, leave a 5 star review. Follow on TikTok: @quantum.trader       [ Any Symbol Can Be ADDED ]       DM me for adding any Pair symbol, crypto, index, stock or anything related. you can also DM me in TikTok [@quantum.trader] Works on [ EURUSD-GBPUSD-GBPJPY-USDJPY-XAUUSD-US30-BTCUSD-ETHUSD-SOLUSD ] This indicator calculate and draw the Prediction or Forecast the peaks of the current day ( forecast high - forecast low - forecast middle - forecast upper q - forecast lower q
Bollinger RSI Momentum Reversal: Precision Signal Indicator Stop chasing every price spike. Most traders lose money because they enter on a Bollinger Band touch without waiting for momentum to shift. The Bollinger RSI Momentum Reversal indicator solves this by requiring a "Double-Lock" confirmation before ever printing a signal. ____________________________________________________________________________________________________________________________________________ How It Works This indicator
FREE
Phantom Edge SMC
Nattapon Chuekamhod
Phantom Edge SMC — The Ultimate Smart Money Indicator for MT5 Tired of manually drawing structures while trading SMC or ICT concepts? Let Phantom Edge SMC do the heavy lifting for you. Key Features Internal & Swing Structure: Automatically detects BOS and CHoCH across two structural levels. Order Blocks (OB): Identifies Internal and Swing OBs with automated mitigation tracking. Equal Highs / Lows: Highlights EQH / EQL to pinpoint Liquidity pools. Fair Value Gaps (FVG): Displays FVGs with
Daily High Low Danilo Monteiro
Danilo Hudson Couto Monteiro
4 (2)
# Indicador Daily High - Danilo Monteiro - MT5 ## Descrição O Daily High/Low Labels é um indicador personalizado para MetaTrader 5 que exibe automaticamente as máximas e mínimas diárias no gráfico, facilitando a identificação rápida dos níveis importantes de preço. O indicador marca os preços com etiquetas e linhas horizontais, permitindo uma visualização clara dos níveis críticos do dia atual e anterior. ## Principais Características ### 1. Marcação Automática - Exibe automaticamente as máxi
FREE
MIDAS Super VWAP
Flavio Javier Jarabeck
4.27 (11)
Imagine VWAP, MVWAP and MIDAS in one place... Well, you found it! Now you can track the movement of Big Players in various ways, as they in general pursue the benchmarks related to this measuring, gauging if they had good execution or poor execution on their orders. Traders and analysts use the VWAP to eliminate the noise that occurs throughout the day, so they can measure what prices buyers and sellers are really trading. VWAP gives traders insight into how a stock trades for that day and deter
FREE
VForce Pro
Thiago Pereira Pinho
**V-FORCE PRO - MetaTrader 5를 위한 고급 거래량 지표** **V-Force Pro로 실제 거래량의 힘을 발견하세요 - 시장 분석의 혁명!** **더 이상 어둠 속에서 거래하지 마세요! 실시간으로 대형 투자자들의 힘을 시각화하세요.** **모든 트레이더가 직면하는 문제:** 모든 기술적 지표가 같은 방향을 가리키는데도 왜 일부 시장 움직임은 실패할까요? 그 해답은 **실제 거래량**에 있습니다 - 대부분의 트레이더들이 간과하는 퍼즐의 가장 중요한 조각입니다! **V-Force Pro 5.3 - Speed Edition을 소개합니다** 단순한 히스토그램을 넘어서, 각 움직임 뒤에 숨겨진 **진정한 강도**를 드러내는 유일무이한 거래량 지표입니다! **독점적인 기능:** **1. 다단계 지배력 분석** *   **강력한 강세(진한 파랑):** 강한 확신을 가진 **매수** 거래량이 지배적 *   **약한 강세(연한 파랑):** 매수 압력은 있지만 주저함
Easy Correlations Indicator The Easy Correlations Indicator is designed to help traders analyze the relationship between two correlated instruments. By monitoring the distance between their Relative Strength Index (RSI) values, the indicator highlights situations where one instrument has moved significantly further than the other. This creates potential trading opportunities: Sell the stronger instrument (overstretched RSI) Buy the weaker instrument (lagging RSI) Because the positions are opened
FREE
이 제품의 구매자들이 또한 구매함
Neuro Poseidon MT5
Daria Rezueva
4.79 (53)
Neuro Poseidon is a new indicator by Daria Rezueva. It combines precise trading signals with adaptive TP/SL levels - creating best possible trades as a result! Message me and get  Neuro Poseidon Assistant  as a gift to automize your trading process! What makes it stand out? 1. Proven profitability on all assets and timeframes 2. Only confirmed BUY and SELL signals present on the chart 3. Adaptive TP & SL levels generated by the software for each trade 4. Easy to understand - suitable for al
SuperScalp Pro
Van Minh Nguyen
4.68 (28)
SuperScalp Pro – 전문 멀티 레이어 컨플루언스 스캘핑 시스템 SuperScalp Pro는 지능형 다중 요소 확인 시스템을 통해 높은 확률의 거래 기회를 식별하도록 설계된 전문적인 다중 컨플루언스 트레이딩 시스템입니다. Supertrend, VWAP, EMA, RSI, ADX, 거래량 분석, 볼린저 밴드 및 MACD 다이버전스를 통합하여 저품질 신호를 필터링하고, 가짜 돌파 신호를 줄이며, 진입 정확도를 향상시킵니다. XAUUSD, BTCUSD 및 주요 Forex 통화쌍에 특별히 최적화된 SuperScalp Pro는 ATR 기반 변동성 로직과 규칙 기반 신호 검증을 통해 변화하는 시장 환경에 적응하며, M1부터 H4까지 다양한 시간대에서 일관되고 객관적인 거래 확인 신호를 제공합니다. 내장된 스마트 제어 패널을 통해 실시간으로 완전한 사용자 설정이 가능하며, 트레이더는 개별 확인 필터를 활성화하거나 비활성화하여 다양한 시장 환경, 거래 스타일 및 위험 선호도에 맞게 시스템
M1 Quantum MT5
Hamed Dehgani
5 (5)
M1 Quantum을 이용한 실시간 트레이딩 신호 : 신호 가격 계획: 현재 가격: $149 (얼리 어답터 혜택) 다음 예정 가격: $169 예정 소매 가격: $299 개발자 안내: 구매 후 저에게 연락하시면 최신 권장 설정 파일(Set File) , 사용 팁, 그리고 다른 M1 Quantum 사용자들과 소통할 수 있는 VIP 지원 그룹 초대장을 받으실 수 있습니다. M1 Quantum 은 M1 전용 전문 트레이딩 시스템으로, 손절(Stop Loss), 익절(Take Profit), 그리고 스마트 자금 관리 기능이 내장된 빠르고 정확한 거래 신호를 제공합니다. M1 Quantum 은 연속 수익 거래 에 집중하여 계좌를 빠르게 성장시키도록 설계된 전문 자금 관리 시스템을 포함하고 있습니다. M1 Quantum 인디케이터 의 주요 기능 M1 타임프레임 및 모든 주요 통화쌍 용으로 설계됨 모든 거래에 손절과 익절 적용 자금 관리 시스템 이 포함되어 트레이더가 쉽게 거래할 수 있도록 안내
Divergence Bomber
Ihor Otkydach
4.9 (92)
이 지표를 구매하신 분께는 다음과 같은 혜택이 무료로 제공됩니다: 각 거래를 자동으로 관리하고, 손절/익절 수준을 설정하며, 전략 규칙에 따라 거래를 종료하는 전용 도우미 툴 "Bomber Utility" 다양한 자산에 맞게 지표를 설정할 수 있는 셋업 파일(Set Files) "최소 위험", "균형 잡힌 위험", "관망 전략" 모드로 설정 가능한 Bomber Utility의 셋업 파일 이 전략을 빠르게 설치, 설정, 시작할 수 있도록 돕는 단계별 영상 매뉴얼 주의: 위의 모든 보너스를 받기 위해서는 MQL5 개인 메시지 시스템을 통해 판매자에게 연락해 주세요. 독창적인 커스텀 지표인 “Divergence Bomber(다이버전스 봄버)”를 소개합니다. 이 지표는 MACD 다이버전스(괴리) 전략을 기반으로 한 올인원(All-in-One) 거래 시스템입니다. 이 기술 지표의 주요 목적은 가격과 MACD 지표 간의 다이버전스를 감지하고, **향후 가격이 어느 방향으로 움직일지를 알려주는
이 제품은 2026년 시장에 맞게 업데이트되었으며 최신 MT5 빌드에 최적화되었습니다. 가격 업데이트 안내: Smart Trend Trading System은 현재 $99 에 제공됩니다. 다음 30회 구매 후 가격은 $199 로 인상됩니다. 특별 혜택: Smart Trend Trading System 구매 후 저에게 개인 메시지를 보내시면 Smart Universal EA를 무료 로 받을 수 있으며, Smart Trend 신호를 자동 거래로 전환할 수 있습니다. Smart Trend Trading System은 리페인트 없음, 재그리기 없음, 지연 없음의 완전한 트레이딩 시스템으로, 더 깨끗한 신호, 더 나은 추세 방향, 그리고 더 체계적인 시장 거래 방식을 원하는 트레이더를 위해 제작되었습니다. Online course , manual and [download presets] . 이 시스템은 추세 감지, 반전 구간, Smart Cloud, 트레일링 스톱 로직, 지지와 저항, 캔들
UZFX {SSS} 스캘핑 스마트 시그널 v4.0 MT5는 급변하는 시장에서 정확한 실시간 시그널을 필요로 하는 스캘퍼, 데이 트레이더, 스윙 트레이더를 위해 설계된 리페인팅이 없는 고성능 트레이딩 지표입니다. (UZFX-LABS)에서 개발한 이 지표는 가격 움직임 분석, 추세 확인 및 스마트 필터링을 결합하여 모든 통화 쌍과 시간대에서 높은 확률의 매수 및 매도 신호, 경고 신호, 추세 지속 기회를 생성합니다. 거래에 대한 의구심을 떨쳐버리고, 명확성, 정밀성, 그리고 규율 있는 시장 실행을 원하는 트레이더를 위해 설계된 체계적인 신호 시스템을 따르기 시작하세요. 제 추천* 최적의 시간대: 15분 이상. {H1}이 제가 가장 선호하는 시간대입니다. 그리고 그 결과는 정말 놀라울 정도입니다...!! 주요 기능 업데이트 • 자동 매수 및 매도 신호 감지 • 고급 반전 인식 로직 • 잠재적인 시장 반전 전 조기 경고 신호 • 추세 지속 확인 신호 • 진입, 손절, TP1, TP2,
Transaction Speed MT5
Ivan Stefanov
5 (3)
이 지표는 시장에서 관심이 나타나는 영역 을 강조 표시한 후, 주문이 누적되는 영역 을 보여줍니다. 이는 **대규모 오더북(호가창)**처럼 작동합니다. 이것은 거대한 자금 을 위한 인디케이터입니다. 성능은 탁월하며, 시장에서 어떤 관심이 있든 반드시 포착할 수 있습니다 . (이것은 완전히 새로 작성되고 자동화된 버전 입니다 – 이제 수동 분석은 필요하지 않습니다.) **거래 속도(Transaction Speed)**는 새로운 개념의 인디케이터로, 시장에 대규모 주문이 언제, 어디에 쌓이는지를 보여주며 , 그 이점을 분석합니다. 매우 초기 단계에서 트렌드 전환 을 감지할 수 있습니다. FX 시장에서 흔히 사용하는 "거래량(volume)"은 오해입니다. 실제로는 시간당 가격 변화량 이므로, 올바른 용어는 거래 속도 입니다. 우리가 어떻게 사고하고, 행동하며, 분석하느냐 가 가장 중요합니다. 분석 패러다임의 전환 은 필수적입니다. 이 인디케이터는 외환 시장에서의 볼륨 개념을 논리적으로
Power Candles MT5
Daniel Stein
5 (8)
Power Candles V3 - 자체 최적화 강도 지표 파워 캔들 V3는 적용된 모든 차트에서 통화 및 상품의 강세를 실행 가능한 거래 계획으로 전환합니다. 단순히 캔들에 색상을 입히는 대신, 백그라운드에서 실시간 자동 최적화를 수행하여 현재 보고 있는 종목에 대한 최적의 손절매, 익절 및 신호 임계값을 제공합니다. 한 번의 클릭으로 실시간 거래에 적용할 수 있으며, 진입점, 손절매 및 익절 선이 정확한 가격에 맞춰 차트에 표시되고, 방향과 함께 알림이 발령됩니다. 이 도구는 Stein Investments 에코시스템의 일부입니다. 18개 이상의 도구와 함께 당신의 1대1 AI 트레이딩 멘토 Max.  항상 대기 중, 모든 인디케이터를 깊이 있게 이해, 무언가를 차근차근 생각해보고 싶은 순간에 도움을 줍니다.  https://stein.investments 에서 만나보세요 매 종가 바마다 3,000회 이상의 트레이딩 시뮬레이션. 9가지 강도 상태. 2가지 전략을 병렬로 테스트.
Trend Sniper X
Sarvarbek Abduvoxobov
5 (2)
Trend Sniper X 는 MetaTrader 5용 멀티 타임프레임 추세 추종 지표로, 트레이더가 추세 방향과 잠재적 반전 지점을 명확하고 정확하게 식별하도록 돕습니다. 가격 정보: 현재 가격은 프로모션 가격이며, 향후 업데이트 및 새로운 기능 출시 시 변경될 수 있습니다. Code2Profit 채널   멀티 타임프레임 분석으로 시장을 마스터하세요!   Trend Sniper X: 체계적인 시장 분석 및 업데이트   기술 사양 플랫폼 MetaTrader 5 지표 유형 멀티 타임프레임 추세 지표 운용 타임프레임 모든 차트 타임프레임 지원, 독립적으로 선택 가능한 상위 타임프레임(M1–MN1) 주요 상품 외환, 금(XAUUSD) 및 기타 CFD 권장 계좌 모든 계좌 유형 시각화 색상별 추세 캔들(매수/매도/약세/변경) + 매수/매도 화살표 추가 모듈 세션 시장 박스(시드니, 도쿄, 런던, 뉴욕) 주요 기능 멀티 타임프레임 추세 분석: 상위 타임프레임의 추세 방향을 현재 차트에 직접
Gann Made Easy MT5
Oleg Rodin
5 (6)
Gann Made Easy 는 mr.의 이론을 사용하여 최고의 거래 원칙을 기반으로 하는 전문적이고 사용하기 쉬운 Forex 거래 시스템입니다. W.D. 간. 이 표시기는 Stop Loss 및 Take Profit Levels를 포함하여 정확한 BUY 및 SELL 신호를 제공합니다. PUSH 알림을 사용하여 이동 중에도 거래할 수 있습니다. 구매 후 거래 방법 안내 및 유용한 추가 지표를 무료로 받으시려면 저에게 연락주세요! 아마도 Gann 거래 방법에 대해 이미 여러 번 들었을 것입니다. 일반적으로 Gann의 이론은 초보자 거래자뿐만 아니라 이미 거래 경험이 있는 사람들에게도 매우 복잡한 것입니다. Gann의 거래 방식은 이론적으로 적용하기 쉽지 않기 때문입니다. 나는 그 지식을 연마하고 Forex 지표에 최고의 원칙을 적용하기 위해 몇 년을 보냈습니다. 표시기는 적용하기가 매우 쉽습니다. 차트에 첨부하고 간단한 거래 권장 사항을 따르기만 하면 됩니다. 지표는 지속적으로 시장 분석
Gem SIGNAL
Shengzu Zhong
5 (1)
GEM Signal Pro GEM Signal Pro는 MetaTrader 5용 추세추종형 지표로, 차트에서 더 명확한 신호, 더 구조적인 트레이드 설정, 그리고 더 실용적인 리스크 관리를 원하는 트레이더를 위해 설계되었습니다. 단순한 화살표만 표시하는 것이 아니라, GEM Signal Pro는 전체 트레이드 아이디어를 더 깔끔하고 읽기 쉬운 방식으로 보여줍니다. 조건이 확인되면 진입가, 손절가, 목표가를 차트에 표시하여 트레이더가 설정을 더 효율적으로 검토할 수 있도록 도와줍니다. 작동 방식 이 지표는 먼저 내부 로직에 따라 유효한 초기 신호를 식별합니다. 확인 조건이 충족되면, GEM Signal Pro는 차트에 전체 설정을 표시합니다. 이를 통해 트레이더는 거래 구조를 더 명확하게 보고, 수동 분석 작업을 줄일 수 있습니다. 차트에 표시되는 거래 레벨 확인된 신호에 대해, GEM Signal Pro는 다음을 표시할 수 있습니다. 진입가 손절가 목표가 1 목표가 2 목표가 3 손
Atomic Analyst MT5
Issam Kassas
4.33 (39)
이 제품은 2026년 시장에 맞게 업데이트되었으며 최신 MT5 빌드에 최적화되었습니다. 가격 업데이트 안내: Atomic Analyst는 현재 $99 에 제공됩니다. 다음 30회 구매 후 가격은 $199 로 인상됩니다. 특별 혜택: Atomic Analyst 구매 후 저에게 개인 메시지를 보내시면 Smart Universal EA를 무료 로 받을 수 있으며, Atomic Analyst 신호를 자동 거래로 전환할 수 있습니다. Atomic Analyst는 리페인트 없음, 재그리기 없음, 지연 없음의 Price Action 거래 인디케이터로, 수동 거래, 신호 명확성, EA 자동화를 위해 설계되었습니다. User manual: settings, inputs and strategy.   &   User Manual PDF . 가격 움직임, 강도, 모멘텀, 다중 시간대 방향 및 고급 필터를 분석하여 트레이더가 노이즈를 줄이고 약한 세팅을 피하며 더 체계적인 거래 결정을 내릴 수 있도록
The Oracle Pro
Ottaviano De Cicco
The Oracle Pro: Synthetic Multi-Timeframe Bias Engine for MT5 ️ Summer Launch Offer — Get The Oracle Pro for USD 199 (early buyers). Price rises with traction; final price USD 399. The Oracle Pro is a premium multi-timeframe bias engine for MetaTrader 5, built for demanding and professional traders. It answers one question with discipline: what is the directional bias on each timeframe right now, how strong is it, and how much do the timeframes agree? Everything is computed on closed bars only
Axiom Matrix
Issam Kassas
5 (1)
AXIOM MATRIX MT5 출시 가격: $99 Axiom Matrix는 출시 가격 $99에 제공됩니다. 첫 30회 구매 이후 가격은 $199로 인상됩니다. Axiom Matrix는 MetaTrader 5용 전문 멀티 심볼, 멀티 타임프레임 시장 스캐너이자 의사결정 대시보드입니다. Axiom Matrix는 사용자의 Market Watch를 스캔하고, 여러 타임프레임을 분석하며, 여러 근거 엔진을 읽고, 가장 강한 기회를 비교하여 하나의 깔끔한 매트릭스 대시보드 안에서 최적의 BUY, SELL, WAIT 또는 차단 상태를 보여줍니다. 저는 무거운 시장 스캔 작업을 대신 처리해 줄 수 있는 하나의 도구가 필요했기 때문에 Axiom Matrix를 만들었습니다. 저는 RSI만 따로 확인하고 싶지 않았습니다. 그다음 MACD만 따로 확인하고. 그다음 이동평균. 그다음 거래량. 그다음 변동성. 그다음 지지와 저항. 그리고 하나의 트레이딩 아이디어를 만들기 위해 심볼과 타임프레임을 수동으로 계
ARIPoint
Temirlan Kdyrkhan
1 (1)
ARIPoint is a powerful trading companion designed to generate high-probability entry signals with dynamic TP/SL/DP levels based on volatility. Built-in performance tracking shows win/loss stats, PP1/PP2 hits, and success rates all updated live. Key Features: Buy/Sell signals with adaptive volatility bands Real-time TP/SL/DP levels based on ATR Built-in MA Filter with optional ATR/StdDev volatility Performance stats panel (Success, Profit/Loss, PP1/PP2) Alerts via popup, sound, push, or email Cu
Trend Forecaster
Alexey Minkov
5 (8)
Trend Forecaster is a MetaTrader 5 indicator that combines breakout signals, possible reversal area analysis, market range data and a visual statistics panel in one chart workspace. It shows Buy and Sell signals, tracks Average Range and Current Range, and can automatically adjust Sensitivity for the current symbol and timeframe. Manual Sensitivity control is also available. The indicator can be used on Forex pairs, metals, stocks, indices and cryptocurrencies. Different timeframes are supported
Quantum TrendPulse
Bogdan Ion Puscasu
5 (25)
SuperTrend   ,   RSI   ,   Stochastic   의 힘을 하나의 포괄적인 지표로 결합하여 트레이딩 잠재력을 극대화하는 궁극의 트레이딩 도구   인 Quantum TrendPulse를   소개합니다. 정밀성과 효율성을 추구하는 트레이더를 위해 설계된 이 지표는 시장 추세, 모멘텀 변화, 최적의 진입 및 종료 지점을 자신 있게 식별하는 데 도움이 됩니다. 주요 특징: SuperTrend 통합:   주요 시장 추세를 쉽게 따라가고 수익성의 물결을 타세요. RSI 정밀도:   매수 과다 및 매도 과다 수준을 감지하여 시장 반전 시점을 파악하는 데 적합하며 SuperTrend 필터로 사용 가능 확률적 정확도:   변동성이 큰 시장에서 숨겨진 기회를 찾기 위해 확률적 진동   을 활용하고 SuperTrend의 필터로 사용 다중 시간대 분석:   M5부터 H1 또는 H4까지 다양한 시간대에 걸쳐 시장을 최신 상태로 유지하세요. 맞춤형 알림:   맞춤형 거래 조건이 충족되면
Current event:  https://c.mql5.com/1/326/A2SR2025_NoMusic.gif MT5용 A2SR 지표: 자동화된 실제 수요 및 공급(S/R). + 거래 상품. Product description in English here. --   Guidance   : -- at   https://www.mql5.com/en/blogs/post/734748/page4#comment_16532516 -- and  https://www.mql5.com/en/users/yohana/blog 더욱 스마트한 거래 결정을 위한 강력하고, 정확하며, 시간 절약적인 기능 + EA 호환 객체. 주요 장점 선행 실제 SR 레벨(지연 또는 재표시 없음) 2014년부터 MT4 에서 수년간 입증된 신뢰성을 바탕으로 A2SR이 이제 MetaTrader 5에서도 사용 가능합니다. 가격이 도달하기 전에 실제 지지선과 저항선을 식별하는 선행적이고 재표시 없는 지표를 통해 트레이더에
Azimuth Pro
Ottaviano De Cicco
5 (7)
Azimuth Pro V2: Synthetic Fractal Structure and Confirmed Entries for MT5 Overview Azimuth Pro is a multi-level swing structure indicator by Merkava Labs . Four nested swing layers, swing-anchored VWAP, ABC pattern detection, three-timeframe structural filtering, and closed-bar confirmed entries — one chart, one workflow from micro-swings to macro-cycles. This is not a blind signal product. It is a structure-first workflow for traders who care about location, context, and timing. ️ Summer Sale
FX Power MT5 NG
Daniel Stein
5 (33)
FX Power: 통화 강세 분석으로 더 스마트한 거래 결정을 개요 FX Power 는 어떤 시장 상황에서도 주요 통화와 금의 실제 강세를 이해하기 위한 필수 도구입니다. 강한 통화를 매수하고 약한 통화를 매도함으로써 FX Power 는 거래 결정을 단순화하고 높은 확률의 기회를 발견합니다. 트렌드를 따르거나 극단적인 델타 값을 사용해 반전을 예측하고자 한다면, 이 도구는 귀하의 거래 스타일에 완벽히 적응합니다. 단순히 거래하지 말고, FX Power 로 더 스마트하게 거래하세요. 1. FX Power가 거래자에게 매우 유용한 이유 통화와 금의 실시간 강세 분석 • FX Power 는 주요 통화와 금의 상대적 강세를 계산하고 표시하여 시장 역학에 대한 명확한 통찰력을 제공합니다. • 어떤 자산이 앞서고 있고 어떤 자산이 뒤처지는지 모니터링하여 보다 현명한 거래 결정을 내릴 수 있습니다. 포괄적인 멀티 타임프레임 뷰 • 단기, 중기 및 장기 타임프레임에서 통화와 금의 강세를
Btmm state engine pro
Garry James Goodchild
5 (5)
BTMM State Engine Pro is a MetaTrader 5 indicator for traders who use the Beat The Market Maker approach: Asian session context, kill zone timing, level progression, peak formation detection, and a multi-pair scanner from a single chart. It combines cycle state logic with a built-in scanner dashboard so you do not need the same tool on many charts at once. What it does Draws the Asian session range; session times can follow broker server offset or be set in inputs. Tracks level progression (L
Quant Direction MT5
Georgios Kalomoiropoulos
Quant Direction 은 3D 시장 분석 도구입니다. 다양한 매개변수에 걸쳐 정확한 백분율 편차를 계산하면서 완벽하게 객관적인 알고리즘 기반 시장 분석을 제공합니다. 첨단 AI 기반 모델링 도구와 엄격한 테스트를 거쳐 개발된 이 알고리즘은 타의 추종을 불허하는 정확도로 시장을 분석합니다. 플랫폼에서 모든 통화쌍 또는 금융 상품을 분석할 수 있습니다. 단기 거래, 데이 트레이딩, 스윙 트레이딩 등 어떤 유형의 거래를 하든 Quant Direction은 최적의 선택입니다. 운영자가 되는 것의 진정한 이점 퀀트 디렉션의 진정한 장점은 감정, 눈의 피로, 과도한 분석을 완전히 배제한다는 점입니다. 더 이상 수십 개의 차트를 일일이 살펴보며 방향을 찾거나 자신의 판단에 끊임없이 의문을 품을 필요가 없습니다. 이 시스템은 8개의 시간 간격(5개월에서 수개월까지)을 밀리초 단위로 처리합니다. 특정 시점의 주요 시장 참여자를 정확하게 식별하여 항상 성공 확률이 가장 높은 방향으로 거래할
FX Trend MT5 NG
Daniel Stein
5 (6)
FX Trend NG: 차세대 멀티 마켓 트렌드 인텔리전스 개요 FX Trend NG 는 다중 시간 프레임 기반의 전문 트렌드 분석 및 시장 모니터링 도구입니다. 몇 초 만에 전체 시장 구조를 파악할 수 있도록 설계되었습니다. 여러 차트를 일일이 전환할 필요 없이, 어떤 종목이 추세에 있는지, 어디에서 모멘텀이 약화되고 있는지, 그리고 어떤 시간 프레임이 서로 정렬되어 있는지 즉시 확인할 수 있습니다. 출시 기념 특별 혜택 – FX Trend NG 를 $30 (6개월) 또는 $80 평생 라이선스 로 이용할 수 있습니다. 이미 Stein Investments 고객이신가요? -> 메시지를 보내 전용 고객 그룹에 참여하세요. 설정이나 사용 방법이 필요하신가요? -> Stein Investments 공식 페이지 를 방문하세요. 1. FX Trend NG가 특별한 이유 3단계 추세 로직 – 단순한 Buy / Sell이 아닙니다 • 대부분의 지표는 Buy 또는 Sell 두 가지 상태만 제
소개       Quantum Breakout PRO   , 브레이크아웃 존 거래 방식을 변화시키는 획기적인 MQL5 지표! 13년 이상의 거래 경험을 가진 숙련된 트레이더 팀이 개발한       퀀텀 브레이크아웃 PRO       혁신적이고 역동적인 브레이크아웃 존 전략으로 거래 여정을 새로운 차원으로 끌어올리도록 설계되었습니다. Quantum Breakout Indicator는 5개의 이익 목표 영역이 있는 브레이크아웃 영역의 신호 화살표와 브레이크아웃 상자를 기반으로 한 손절 제안을 제공합니다. 초보자 거래자와 전문 거래자 모두에게 적합합니다. Quantum EA 채널:       여기를 클릭하세요 중요한! 구매 후 설치 매뉴얼을 받으려면 개인 메시지를 보내주십시오. 추천: 기간: M15 통화쌍: GBPJPY, EURJPY, USDJPY,NZDUSD, XAUUSD 계정 유형: 스프레드가 매우 낮은 ECN, Raw 또는 Razor 브로커 시간: GMT +3 중개인 :
이 제품은 2026년 시장에 맞게 업데이트되었으며 최신 MT5 빌드에 최적화되었습니다. 가격 업데이트 안내: Smart Price Action Concepts는 현재 $200 에 제공됩니다. 다음 30회 구매 후 가격은 $299 로 인상됩니다. 특별 혜택: 구매 후 저에게 개인 메시지를 보내시면 무료 보너스 + 선물 을 받을 수 있습니다. 먼저, 이 트레이딩 도구는 리페인트 없음, 재그리기 없음, 지연 없음의 인디케이터이므로 전문적인 트레이딩에 적합하다는 점을 강조하고 싶습니다. Online course , and manual Smart Price Action Concepts Indicator는 초보자와 경험 많은 트레이더 모두에게 매우 강력한 도구입니다. 20개 이상의 유용한 인디케이터를 하나로 결합하고, Inner Circle Trader Analysis와 Smart Money Concepts Trading Strategies 같은 고급 트레이딩 아이디어를 통합합니다. 이 인디
KURAMA GOLD SIGNAL PRO (MT5) — 7중 필터 · 자동 TP/SL · 품질 점수 · 시그널 기록 저장 | XAUUSD 완전 트레이딩 시스템 실시간 리페인트 없음. 시그널이 나타나는 순간 화살표, 진입, TP, SL이 그 자리에 고정되어 이후 절대 움직이지 않습니다. 여러분이 거래하는 것은 바로 이 실시간 시그널입니다. 그리고 v7.20에서는 실제로 발신된 모든 시그널이 자동 저장되어 재시작 후에도 정확히 복원됩니다. 구매자 전용 보너스 평생 라이선스를 구매하시면 AI Zone Radar($59 상당) + 완전 PDF 매뉴얼을 무료로 드립니다. 제품 가격에 더해 $59 상당의 보너스가 따라옵니다. 구매 후 MQL5로 메시지를 보내주세요. AI Zone Radar: https://www.mql5.com/en/market/product/175834 골드 트레이더 커뮤니티에서 실제로 사용되며 정확성과
This indicator automatically detects internal & swing market structure, Fibonacci Retracement and Fibo Levels. Features Full internal & swing market structure labeling in real-time Fibonacci Retracement Fibonacci Levels After purchasing the indicator, the full source code is provided, and via indicator buffers it can be easily integrated into your Expert Advisors (EAs) for automated trading strategies.
CGE Trading Suite
Carl Gustav Johan Ekstrom
5 (2)
Institutional-Grade Analytics for MT5 One indicator. The full analytical edge of a professional trading desk, built into your MT5 chart. CGE Trading Suite unifies everything a serious trader reads in a market — structure, momentum, timing, and capital flow — into one seamless MT5 workspace. 16 integrated modules act as a single system: ICT sessions and killzones, order-block and liquidity mapping, MIDAS volume curves, automated trend lines and channels, the Economic Confidence Model, and a live
Entry Points Pro for MT5
Yury Orlov
4.48 (140)
다시 색을 칠하지 않고 거래에 진입할 수 있는 정확한 신호를 제공하는 MT5용 지표입니다. 외환, 암호화폐, 금속, 주식, 지수 등 모든 금융 자산에 적용할 수 있습니다. 매우 정확한 추정값을 제공하고 매수와 매도의 가장 좋은 시점을 알려줍니다. 하나의 시그널로 수익을 내는 지표의 예와 함께 비디오 (6:22)시청하십시오! 대부분의 거래자는 Entry Points Pro 지표의 도움으로 첫 거래 주 동안 트레이딩 결과를 개선합니다. 저희의   Telegram Group 을 구독하세요! Entry Points Pro 지표의 좋은점. 재도색이 없는 진입 신호 신호가 나타나고 확인되면(시그널 캔들이 완성된 경우) 신호는 더 이상 사라지지 않습니다. 여타 보조지표의 경우 신호를 표시한 다음 제거되기 때문에 큰 재정적 손실로 이어집니다. 오류 없는 거래 게시 알고리즘을 통해 트레이드(진입 또는 청산)를 할 이상적인 순간을 찾을 수 있으며, 이를 통해 이를 사용하는 모든 거래자의 성공률이
RFI levels PRO MT5
Roman Podpora
4 (4)
이 지표는 추세 반전 지점과 가격 반등 영역을 정확하게 보여줍니다.       주요 투자자들   . 새로운 트렌드가 형성되는 곳을 파악하고 최대한 정확하게 의사결정을 내리며 모든 거래를 완벽하게 통제합니다. TREND LINES PRO   지표와 함께 사용할 때 최대의 잠재력을 발휘합니다.  VERSION MT4 지표가 보여주는 내용: 새로운 추세의 시작 시 활성화되는 반전 구조 및 반전 수준. 최소한의 위험 대비 수익률을 갖는 이익 실현   (TAKE PROFIT)   및   손절매(STOP LOSS)   레벨 표시       RR 1:2   . 지능형 손실 감소 로직이 적용된 손절매 기능. 지정된 지표에서 두 가지 추세 유형에 대한 반전 패턴을 표시합니다. 지표: 트렌드를 따라   트렌드 라인 프로   (글로벌 트렌드 변화) 트렌드 프로   (빠른 트렌드 변화) 간단하고 효과적입니다       스캐너       실시간 추세 (신규). 다중 시간 프레임 도구 필터링. 표시하다  
필터:
리뷰 없음
리뷰 답변