HotkeyFractalsEA

Hotkey Fractals EA is a trading expert advisor designed for manual and semi-automated trading, built on the logic of the Fractalsalligatorfilter indicator. The EA helps quickly identify trading opportunities based on fractals with Alligator line filtering and instantly place virtual or market orders with pre-calculated Entry, Stop Loss, and Take Profit levels.

The advisor is created for traders who work with breakout strategies, fractal market structure, and trend-direction trading. Its main purpose is to speed up trading workflow, reduce manual actions, and simplify trade preparation.

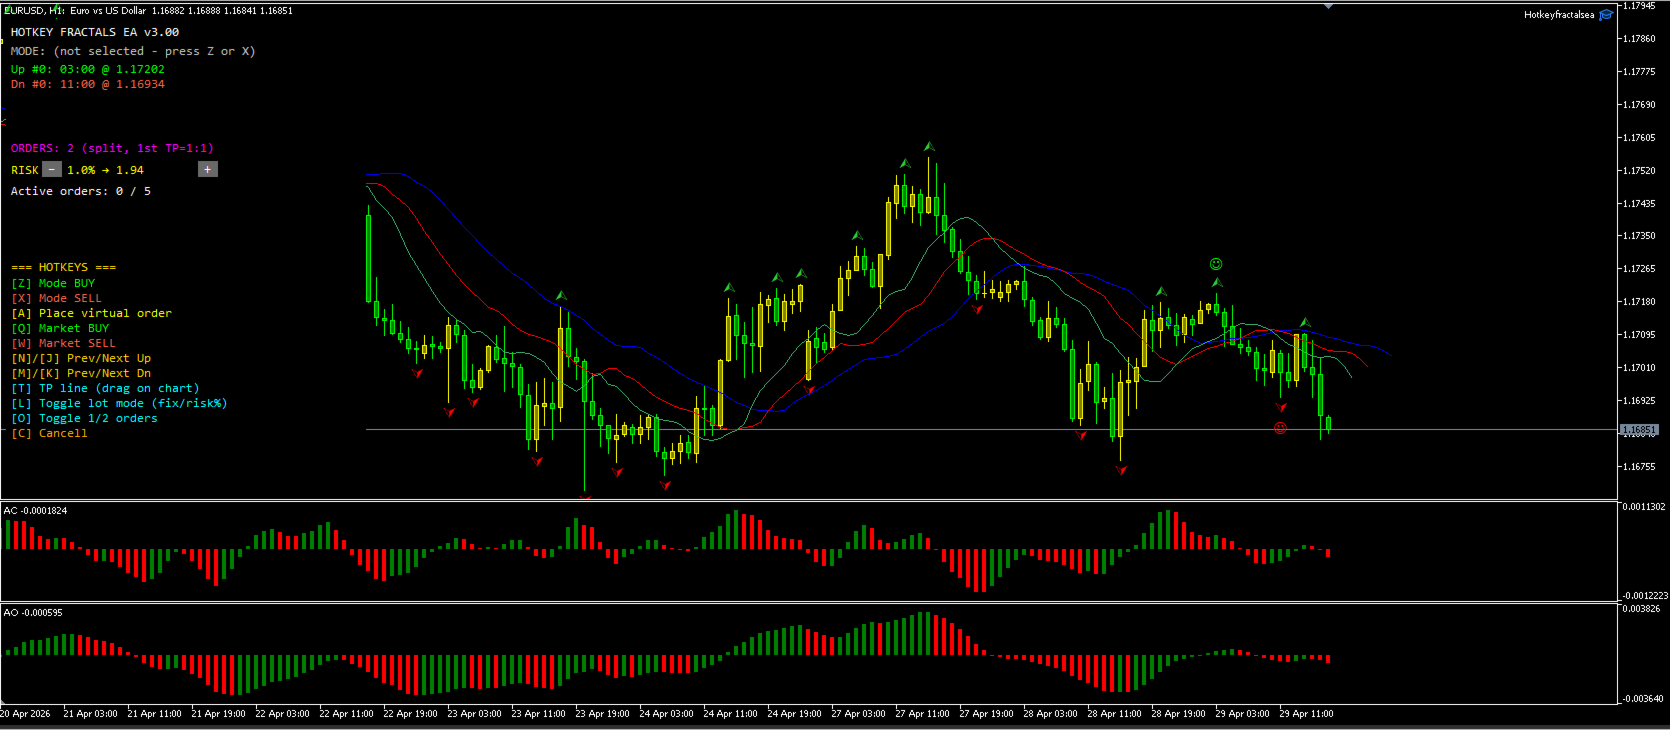
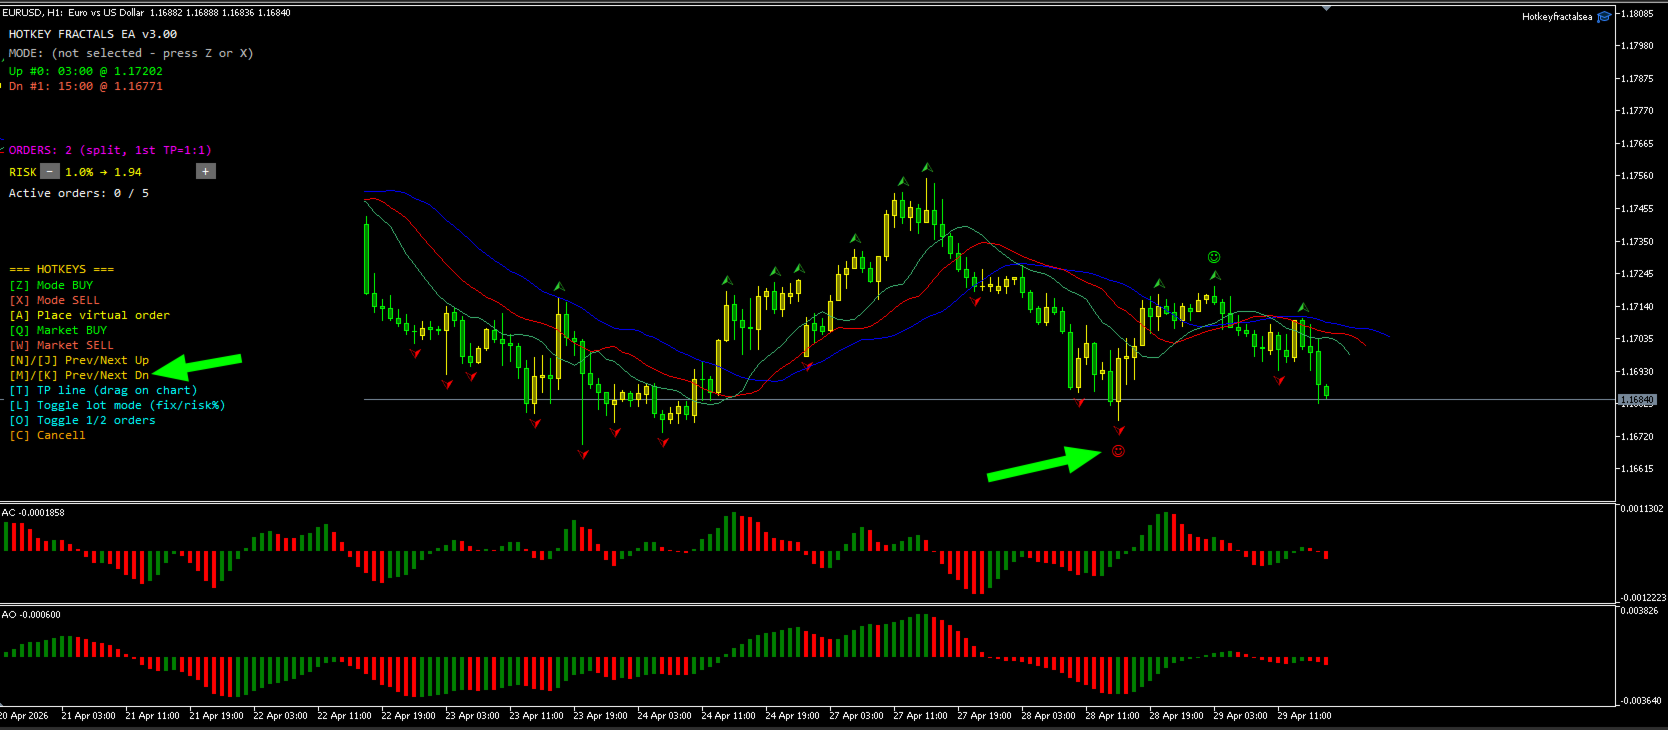
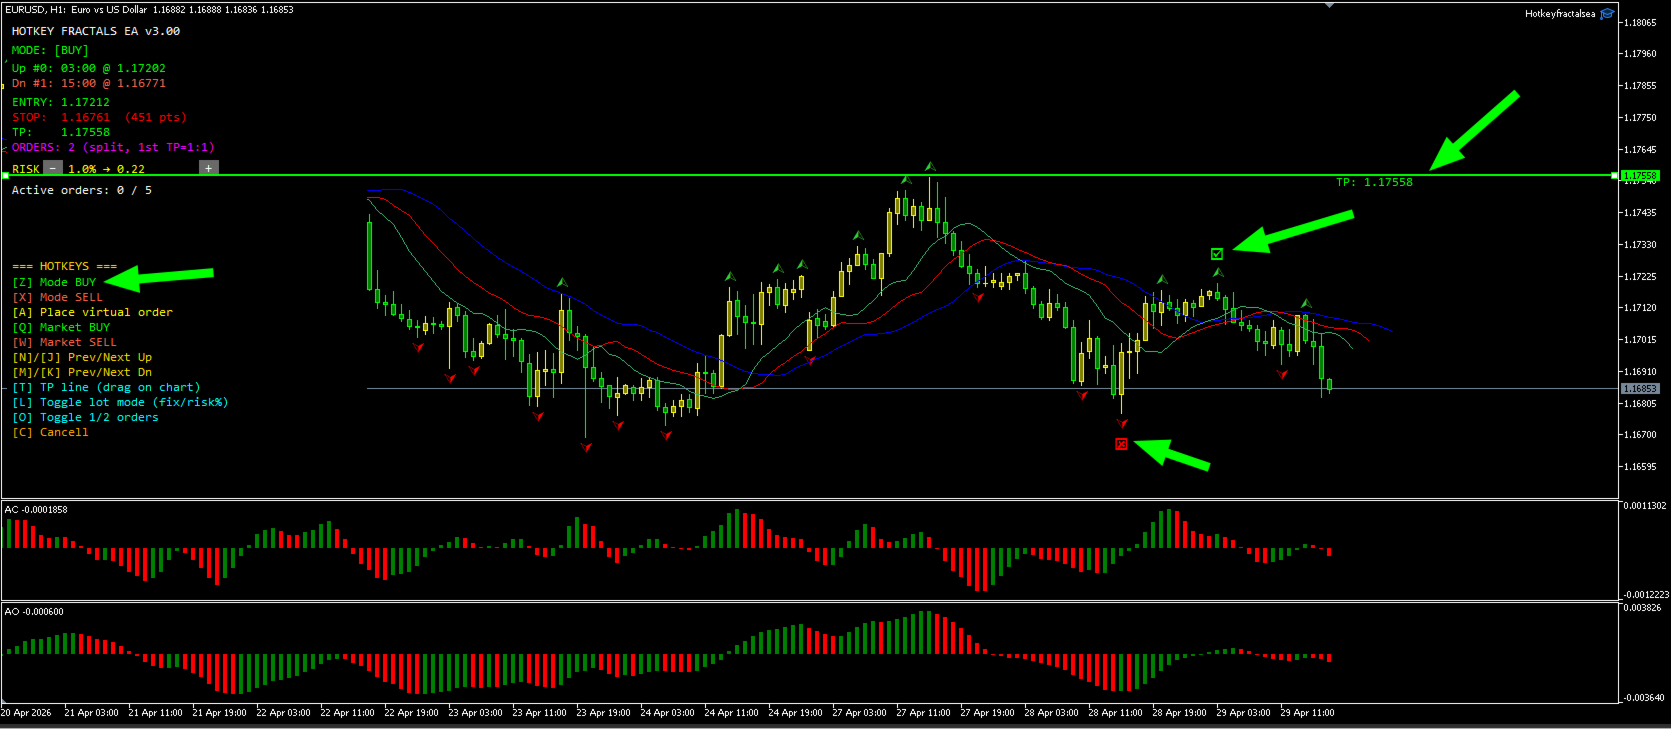
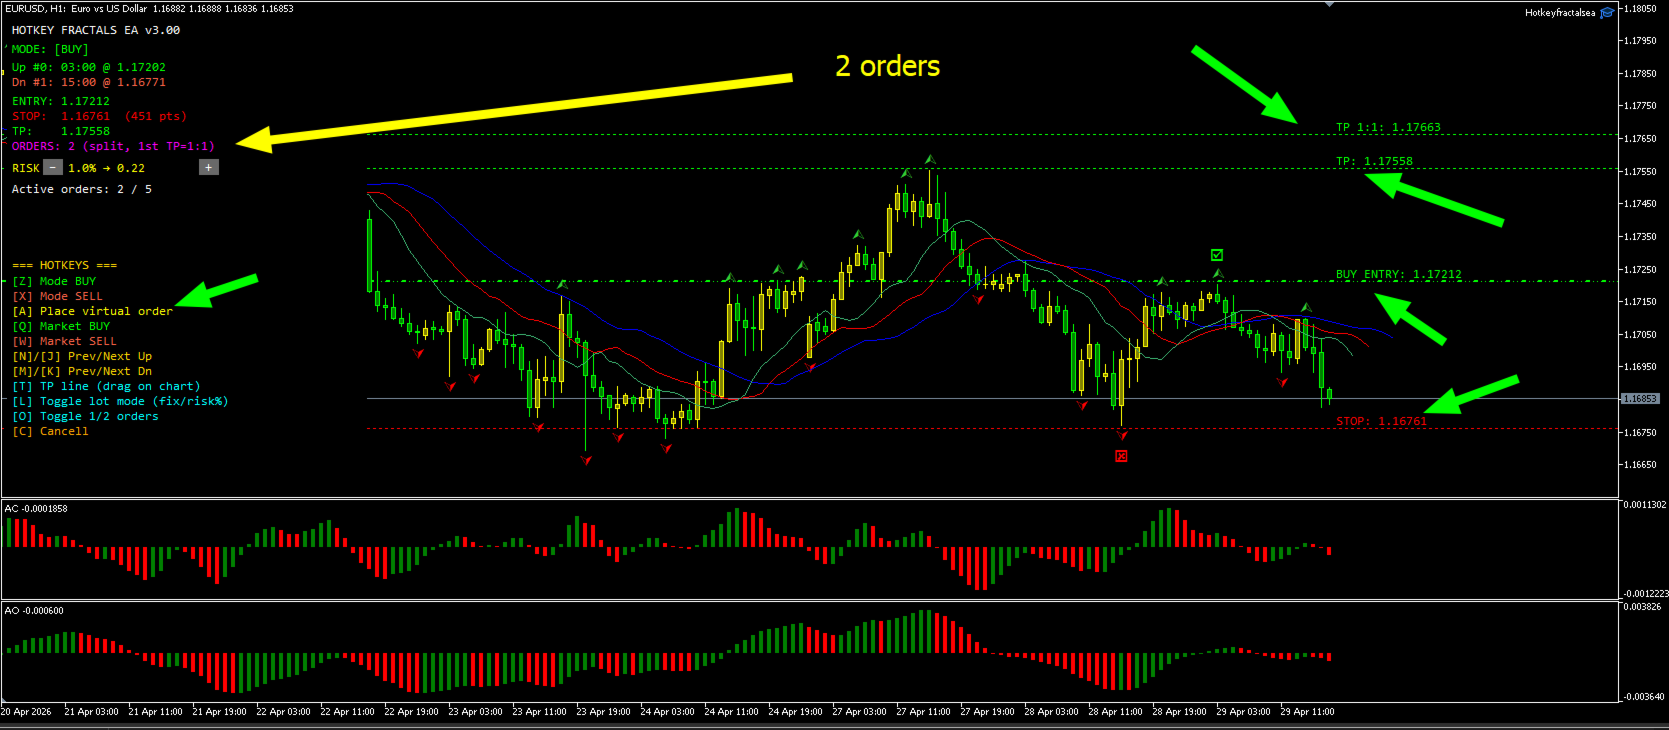
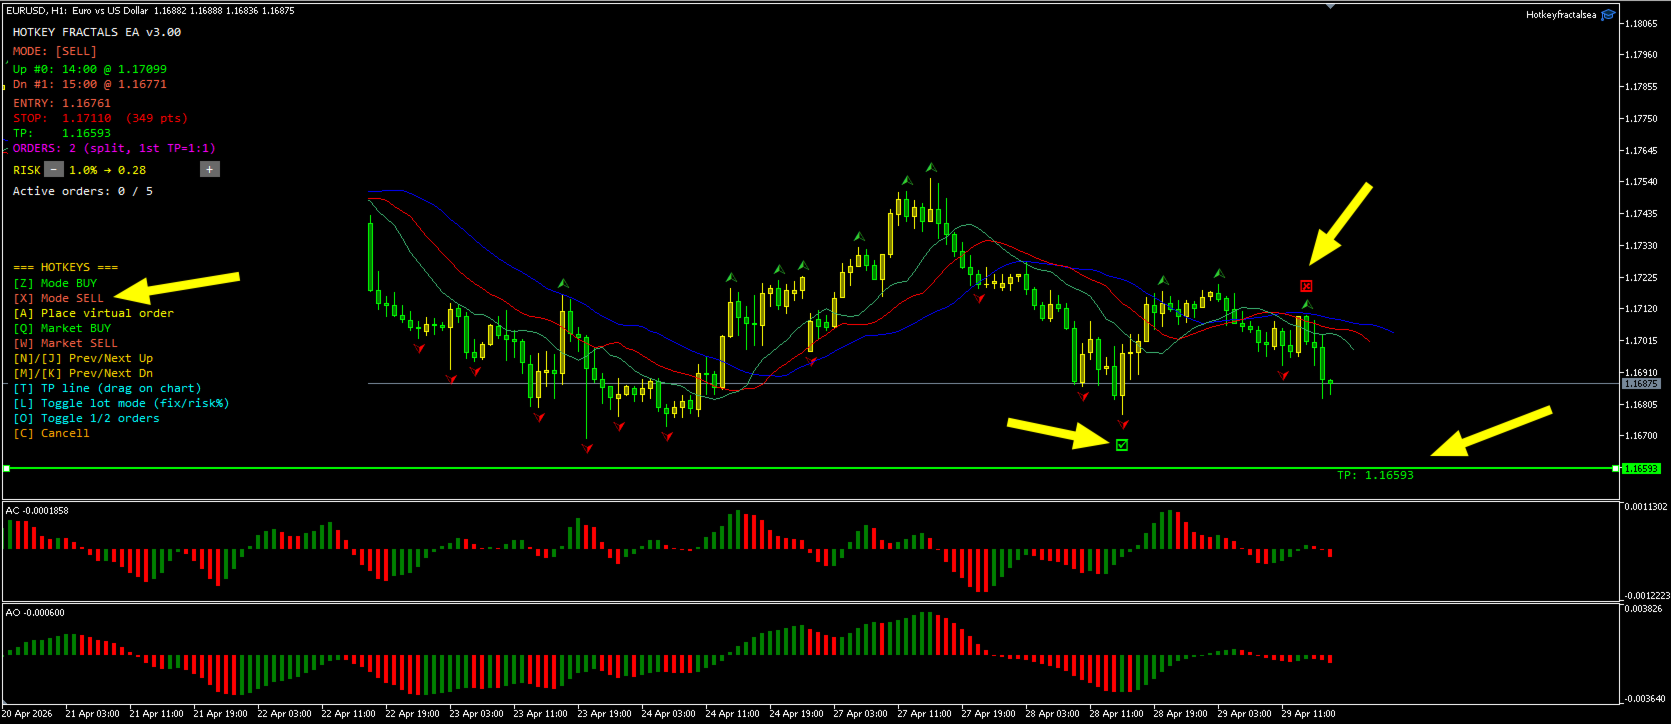
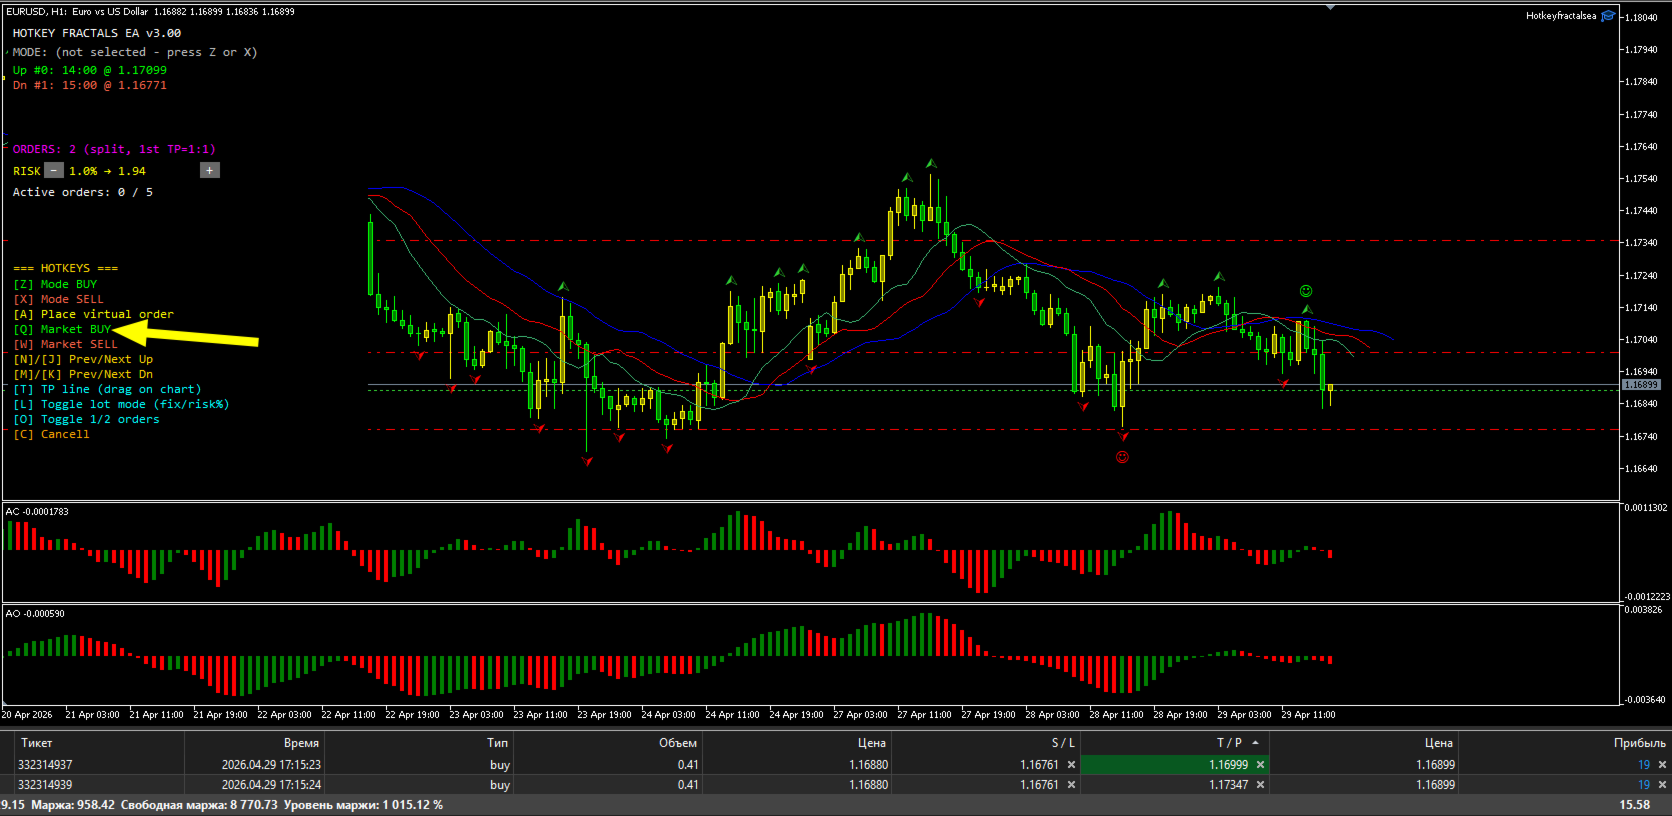
Hotkey Fractals EA displays the current upper and lower fractals and allows fast switching between detected levels using hotkeys. For each signal, Entry, Stop Loss, and Take Profit levels are calculated automatically.

Key features:

  • One-click BUY and SELL order execution;
  • Fast selection of active fractals;
  • Virtual pending orders;
  • Instant market entries;
  • Automatic Stop Loss and Take Profit calculation;
  • Fixed lot mode;
  • Position sizing based on risk percentage;
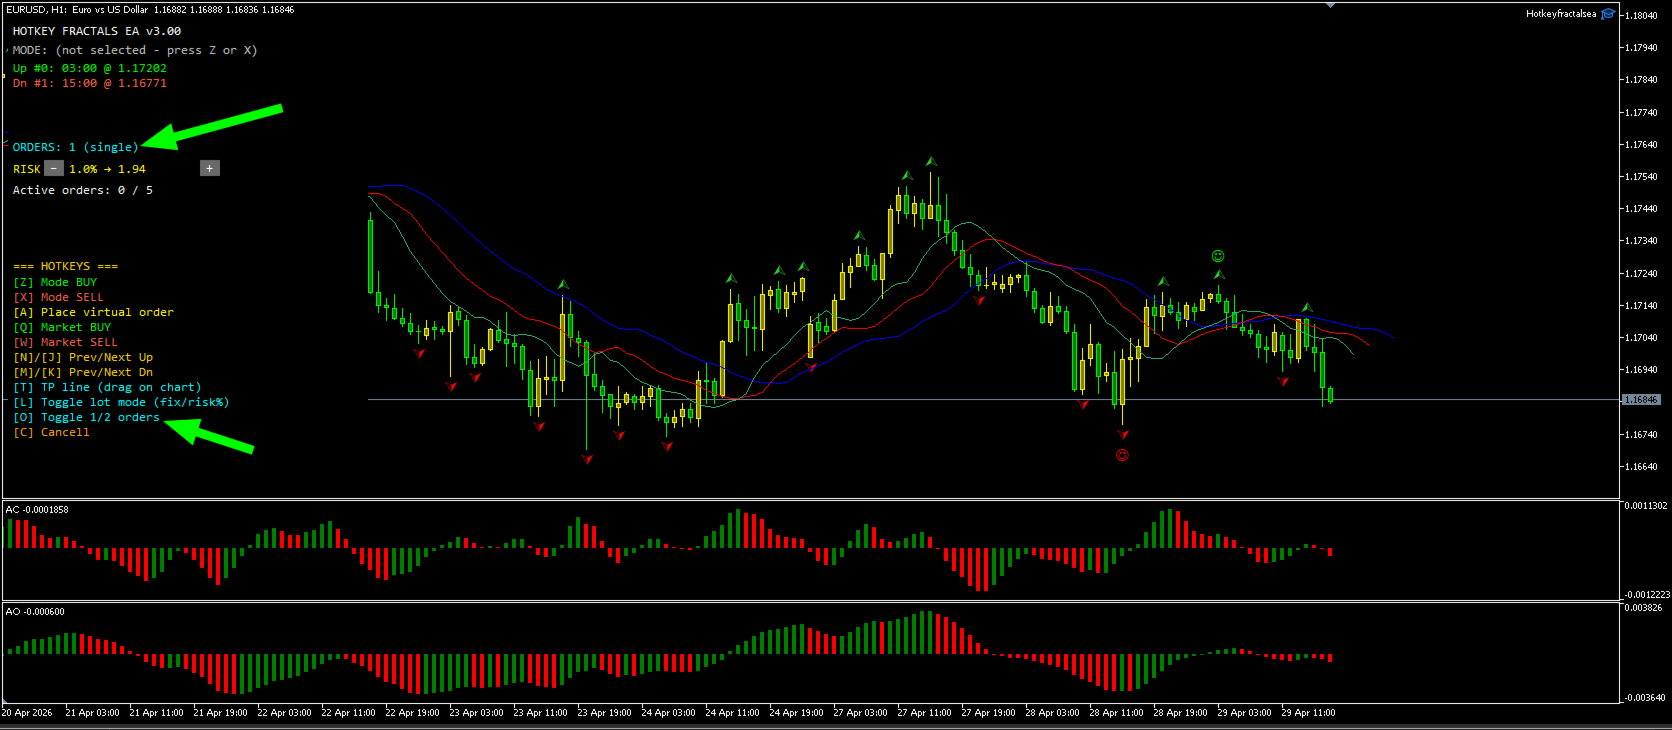
  • Position splitting into 2 orders;
  • First Take Profit based on Risk/Reward 1:1;
  • Manual Take Profit placement directly on the chart;
  • Visual Entry / SL / TP lines;
  • Selection of valid fractals filtered by Alligator;
  • Hotkeys for fast control;
  • Information panel on the chart.

Order operation modes

The EA supports two position entry modes:

Single Order — opening one position.

Split Orders — automatic division of a position into two parts. The first part is closed at a 1:1 risk-to-reward ratio, while the second part is held until the main Take Profit level. This approach allows partial profit-taking while keeping part of the position for larger market moves.

Risk management

Two position sizing methods are supported:

  • fixed lot size;
  • automatic lot calculation based on risk percentage.

Position size is calculated according to the Stop Loss distance, helping maintain proper risk management rules.

Fractal time filter

The EA includes a dedicated time filter for fractal selection. When enabled, only fractals formed within the defined time range are used for trading decisions.

Fractals generated outside the selected time window will not be available for Entry and Stop Loss selection. This is especially useful for traders focusing on active trading sessions or intraday strategies.

Main settings

Hotkeys
Configuration of keys for switching BUY/SELL modes, placing orders, cycling fractals, managing TP line, and controlling trading modes.

Trading
Settings for lot size, risk percentage, slippage, and Magic Number.

Fractal offsets
Allows setting additional distance for Entry and Stop Loss relative to the selected fractal.

Fractal detection
Settings for Alligator periods, filtering mode, and fractal analysis depth.

Time filter
Defines the time range in which fractals are considered valid for trading.

Panels and visualization
Interface customization, color theme, and on-chart information display settings.

Hotkey Fractals EA helps traders work faster with price levels, reduces errors in manual order placement, and makes fractal-based trading more structured, efficient, and convenient.


фрактал Вильямса фрактал БВ фракталы Вильямса пробой фрактала пробитый фрактал Торговый хаос broken fractal unbroken fractal Williams fractal Trading Haos Bill Williams

제작자의 제품 더 보기
B Williams Divergent Bar The indicator searches for and marks Divergent Bars on the chart according to Bill Williams' methodology. What it shows: Green upward arrow   — potential bullish reversal (Bullish Divergent Bar). Red downward arrow   — potential bearish reversal (Bearish Divergent Bar). Signal logic:   The indicator looks for bars with a large shadow in the direction of the reversal that update the local extremum (new local low or high), while being on the opposite side of the Alligator
FREE
Fractals Alligator Filter is an indicator for MetaTrader 5 that detects fractals and filters them according to their position relative to the Alligator lines. There is also the HotkeyFractalsEA utility designed to simplify trading. The indicator automatically separates fractals   into valid and invalid fractals: valid fractals are displayed with colored arrows; invalid fractals can be displayed separately or hidden in the settings. Two filtering modes are available: filtering relative to the Tee
FREE
BWZonesIndicator
Roman Ogorodnikov
BW Zones Indicator is an indicator for MetaTrader 5 that detects market zones based on AO and AC direction and displays them directly on the price chart: green zone — AO and AC are rising; red zone — AO and AC are falling; neutral zone — AO and AC move in different directions. Chart display: colored bars for zone visualization; up arrow after two consecutive green zones; down arrow after two consecutive red zones. Arrow placement: up signal — below the candle low; down signal — above the candle
FREE
B Williams Div bar
Roman Ogorodnikov
B Williams Divergent Bar The indicator searches for and marks Divergent Bars on the chart according to Bill Williams' methodology. What it shows: Green upward arrow — potential bullish reversal (Bullish Divergent Bar). Red downward arrow — potential bearish reversal (Bearish Divergent Bar). Arrows appear only on closed bars. Signal logic: The indicator looks for bars with a large shadow in the direction of the reversal that update the local extremum (new local low or high), while being on the op
FREE
SquatBarMarker
Roman Ogorodnikov
Squat Bar Marker is an indicator for MetaTrader 5 that detects Bill Williams MFI bar types and displays them directly on the price chart. Supported bar types: Green Bar — MFI and volume are rising; Fade Bar — MFI and volume are falling; Fake Bar — MFI rises while volume falls; Squat Bar — MFI falls while volume rises. Chart display: green bars — Green Bar; brown bars — Fade Bar; blue bars — Fake Bar; pink bars — Squat Bar. Display modes: no coloring; only Squat bars; all bar types. The indicator
FREE
Fractal Broken mt4
Roman Ogorodnikov
The indicator draws two types of Bill Williams' fractals: Broken fractals   – the price has been at least once above or below these fractals. Unbroken fractals   – new fractals where the price has not yet moved above or below them. You can configure the color of the fractals, as well as the number of bars used for the indicator's display. фрактал Вильямса фрактал БВ фракталы Вильямса пробой фрактала пробитый фрактал Торговый хаос broken fractal unbroken fractal Williams fractal    Trading Haos
FREE
이 인디케이터는 두 가지 색상의 이동평균선(MA)을 표시합니다: 파란색 — 이전 봉의 시가와 종가가 MA 선 위에 있을 때. 빨간색 — 이전 봉의 시가와 종가가 MA 선 아래에 있을 때. 설정 가능 옵션: MA 유형 (단순, 지수, 평활, 선형); MA 기간; MA 색상 변경 시 알림. 문제가 있으면 알려주세요. 수정하겠습니다! bar cross Moving  cross  candle cross Moving  cross bar cross MA cross candle cross MA cross bar cross Moving Average cross candle cross Moving Average cross bar 이 인디케이터는 두 가지 색상의 이동평균선(MA)을 표시합니다: 파란색 — 이전 봉의 시가와 종가가 MA 선 위에 있을 때. 빨간색 — 이전 봉의 시가와 종가가 MA 선 아래에 있을 때. 설정 가능 옵션: MA 유형 (단순, 지수, 평활, 선형); MA 기간;
FREE
The indicator plots a   two-colored   Moving Average (MA): Blue color — the   previous   bar’s   open   and   close   prices are   above   the MA line. Red color — the   previous   bar’s   open   and   close   prices are   below   the MA line. Customizable settings: MA type (Simple, Exponential, Smoothed, Linear); MA period; Alert when the MA color changes. bar cross Moving  cross  candle cross Moving  cross bar cross MA cross candle cross MA cross bar cross Moving Average cross candle cross Mov
FREE
Fractal Broken
Roman Ogorodnikov
Fractals Broken/Unbroken This indicator detects classic Bill Williams fractals and separates them into two categories: broken and unbroken fractals. The tool helps traders quickly identify which fractal levels have already been broken by price action and which levels remain intact as potential support or resistance zones. The indicator works directly on the chart and displays different fractal types using separate colors for easier visual analysis. How It Works The indicator uses the standard 5-
FREE
MAs crossing
Roman Ogorodnikov
5 (1)
The indicator draws three Moving Averages. Two short ones cross a long one. At the same time, the long MA changes color: If both short MAs are above the long one - first color; If both short MAs are below the long one - second color; If the two short MAs are on opposite sides of the long one - third color. All three MAs are based on closing prices with a smoothing method of "simple." cross MA cross 3 MA cross three Moving Average across Moving cross Moving crossing  MA crossing MA across MA
FREE
필터:
리뷰 없음
리뷰 답변