Combo Filter
- 지표
- Cha Juyeong
- 버전: 1.0
If I were a beginner, I would probably want to apply basic indicators together. I know this because that’s exactly how I started. That is why I built a tool that allows you to use simple indicators in combination:
-
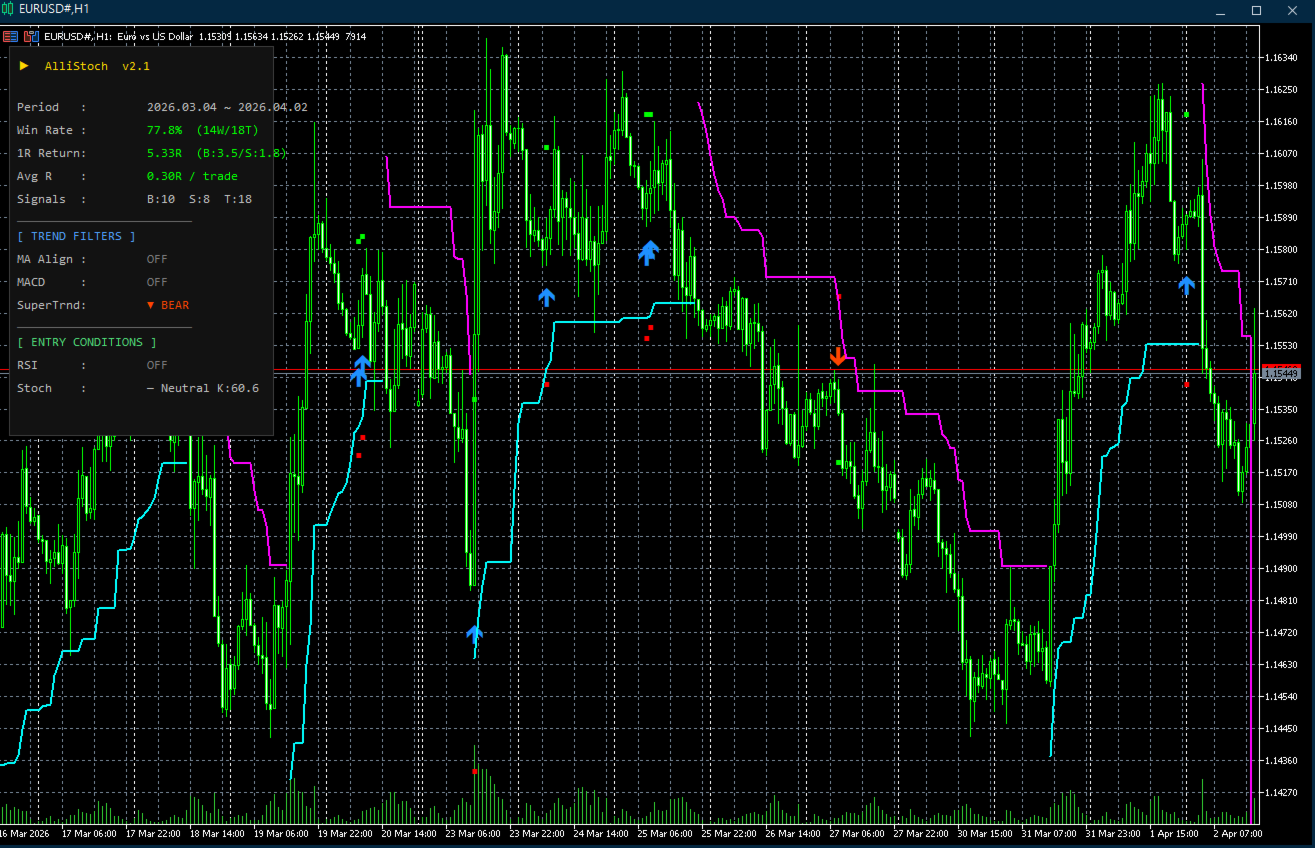
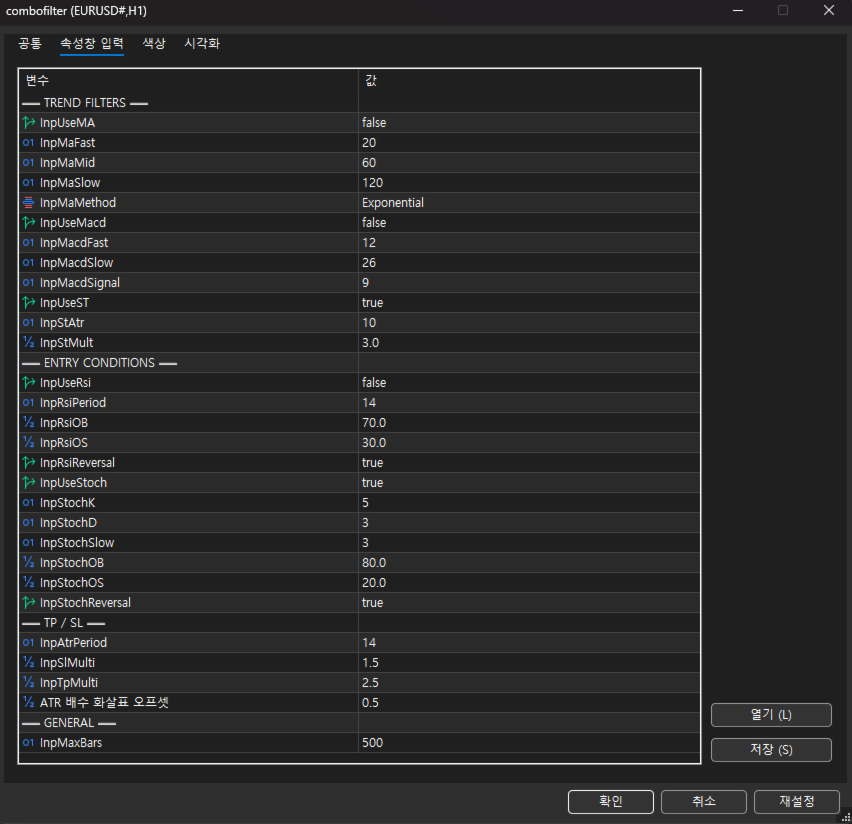
Trend: MACD, SuperTrend, MA
-
Trigger: RSI or Stochastic
I look forward to developing various other indicators and EAs in the future. Thank you.
"This is my first project, so please feel free to leave feedback or report any bugs."
*No repaint — signals are confirmed on bar close