VSA Smart Engine

VSASmartEngine - VSA Volume Intelligence System

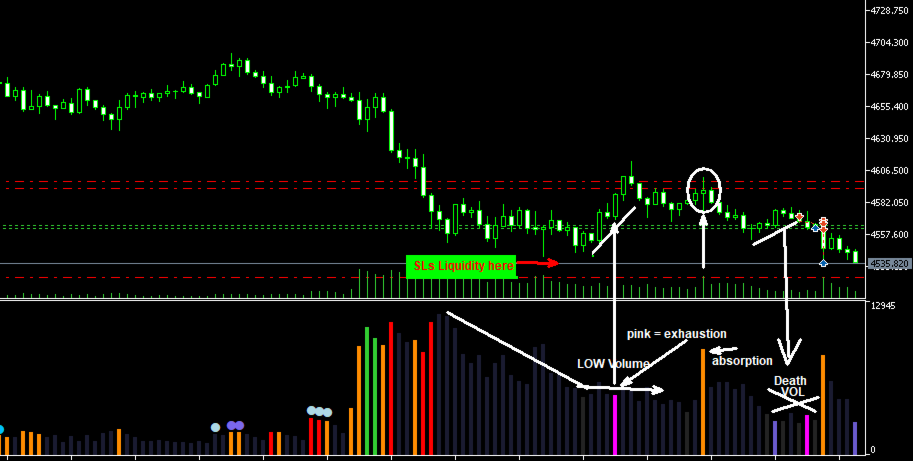
VSASmartEngine is a technical indicator for MetaTrader 5 based on VSA (Volume Spread Analysis) methodology. The system is designed to provide an objective reading of market activity, helping traders identify aggression, absorption, and exhaustion states by analyzing the relationship between volume and price action.

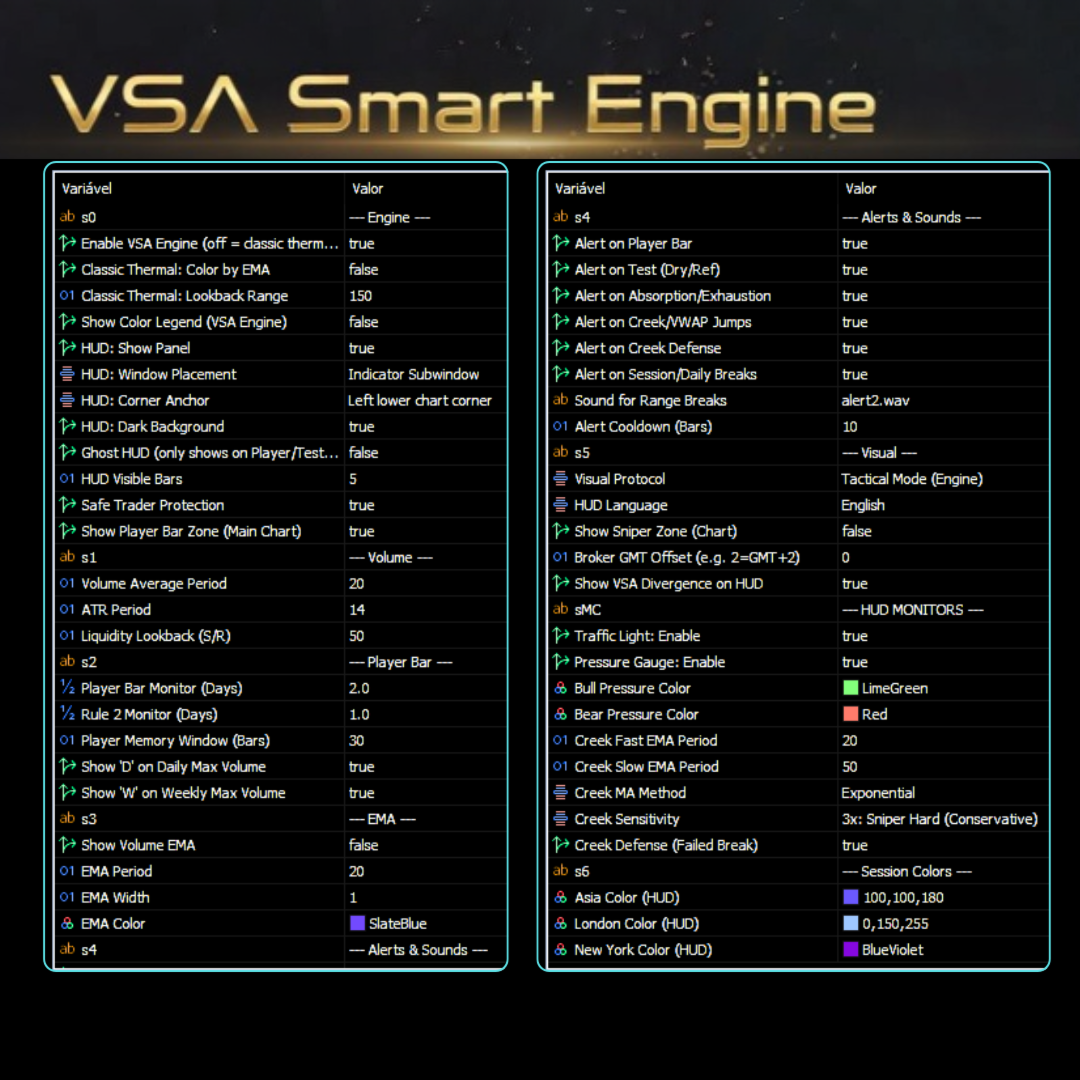
The indicator features a dual-processing architecture, allowing the user to switch between the full VSA logic engine or a simplified horizontal heatmap view for flow analysis.

Operation Modes

  1. VSA Engine Mode: Classifies every bar in real-time into 4 distinct market states: Aggression (Continuation), Absorption, Exhaustion, and Neutral.
  2. Classic Mode: Provides a horizontal heatmap for quick visual identification of volume anomalies and historical data normalization.

Core Features

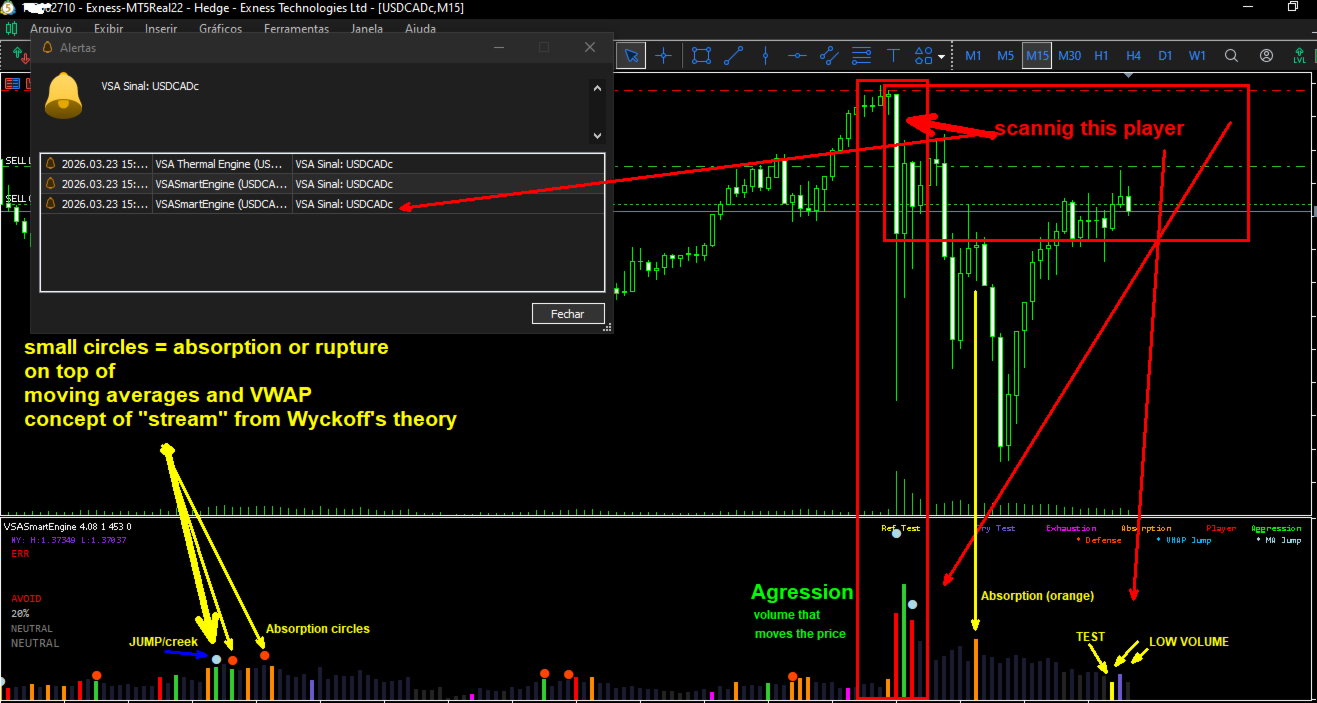
  • Player Bar Memory: Identifies bars with significant volume and projects dynamic zones of interest based on Fair Value Gaps (FVG). The system tracks zone validity until price mitigation occurs.
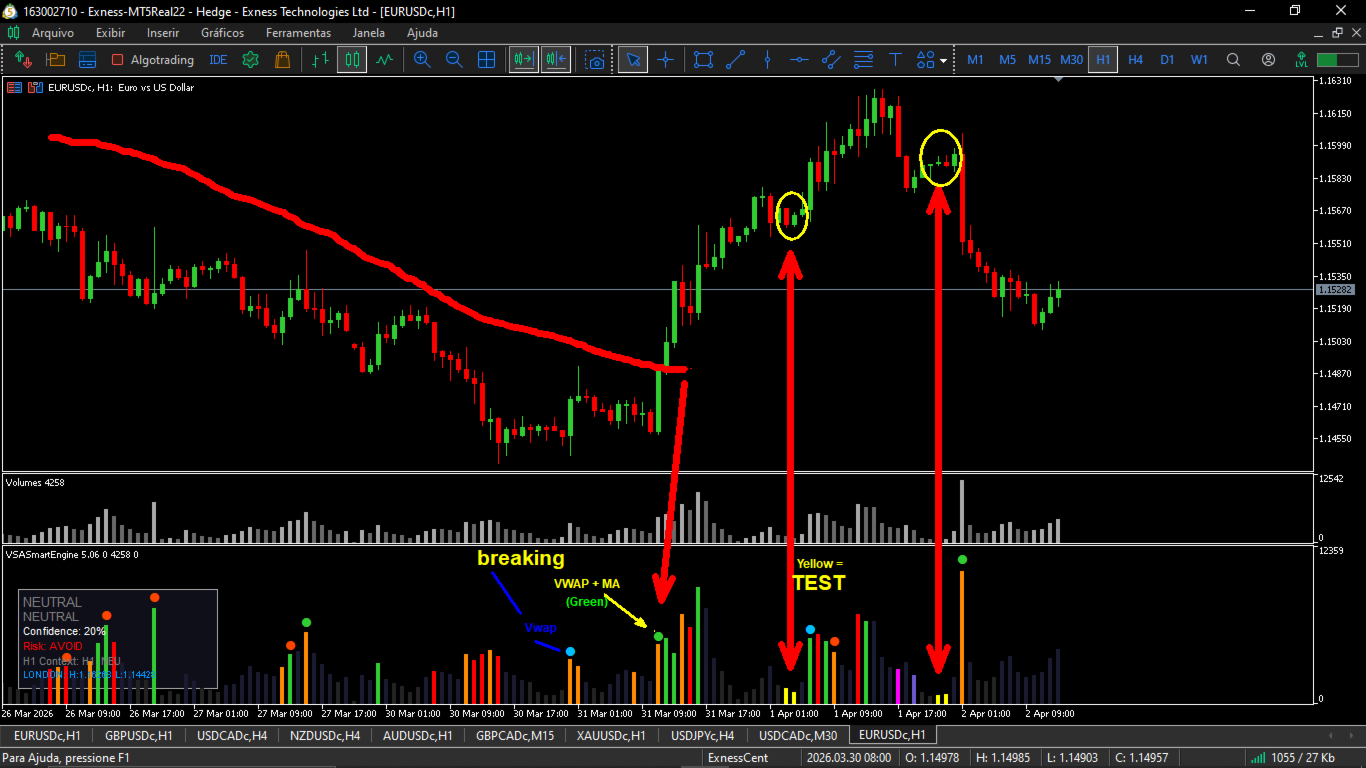
  • Creek Setup (Belo Riacho): A confirmation logic based on liquidity level breakouts with momentum filters. It utilizes moving averages and VWAP to validate movement strength.
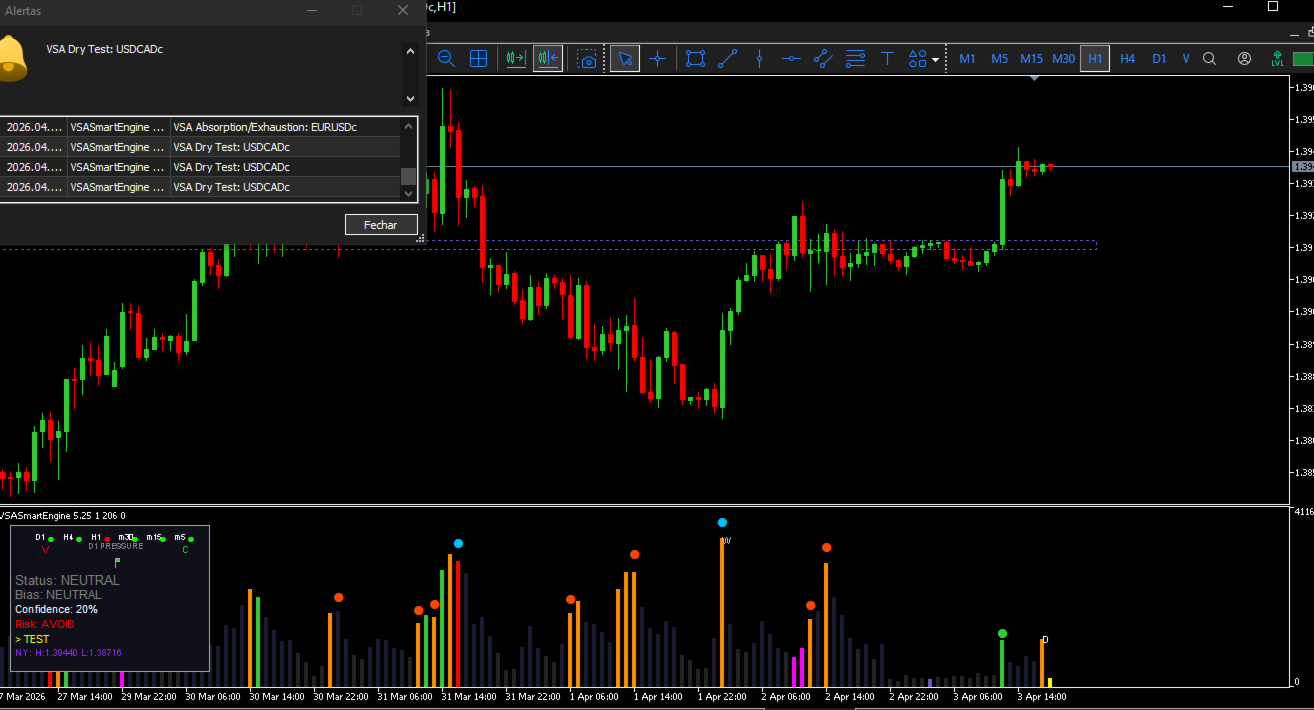
  • Sniper Zones: Detects low-volume bars returning to pre-mapped interest zones, signaling potential supply or demand tests (Dry Tests).
  • Market Context Monitor: A visual traffic light system that analyzes multiple timeframes simultaneously, providing macro directional bias directly on the trading chart.
  • HUD Interface: An integrated information panel displaying current market state, analysis confidence level, session information (Asia, London, and New York), and daily levels (PDH/PDL).

Technical Advantages

  • Professional Visualization: Clean interface designed to reduce visual fatigue and chart noise.
  • Alert System: Configurable notifications for volume events, Creek signals, Sniper tests, and daily range breakouts.
  • Visual Customization: Several color protocols available, including Stealth, Tactical, and Thermal modes.

Support and Contact

Technical support and updates are provided exclusively via the MQL5 private messaging system and the product comments section. Community feedback is regularly integrated into new versions.


추천 제품
Spread Engine Nika — MetaTrader 5를 위한 실시간 스프레드 분석 도구 Spread Engine Nika는 MetaTrader 5용 전문 스프레드 분석 인디케이터입니다. 과거 틱 데이터를 사용하여 모든 심볼에 대한 통계적 스프레드 프로파일을 구축하고, 실시간 스프레드 상황을 맥락과 함께 표시하며, 현재 스프레드가 정상인지, 높은지, 위험한지를 즉각 판단할 수 있게 해줍니다 — 차트 위의 컴팩트한 패널에 모두 표시됩니다. 스캘퍼, 당일 거래자, 그리고 체결 비용을 중시하는 모든 트레이더를 위해 설계되어 원시 스프레드 데이터를 실행 가능한 정보로 변환합니다. 주요 기능 스프레드 프로파일 엔진 — 최대 120일의 과거 틱을 분석하고 시간 버킷(설정 가능, 기본 15분)으로 분할합니다. 각 버킷에는 평균, 중앙값, 75번째 백분위수, 최대값, 표준편차, 일간 표준편차가 저장됩니다. 실시간 스프레드 표시 — 현재 스프레드를 실시간으로 표시하며, 해당 시간대의 과
FREE
Pip Movement Alert MT5로 시장 모멘텀을 앞서 나가세요. 이 다목적 다중 통화 인디케이터는 여러 심볼에서 정확한 핍 움직임을 추적하고 트레이더에게 알리기 위해 설계되었으며, 외환, 주식, 암호화폐, 상품 거래에 이상적입니다. Forex Factory와 Reddit의 r/Forex와 같은 거래 커뮤니티에서 찬사를 받고 있으며, Investopedia와 TradingView의 논의에서도 갑작스러운 시장 변화를 감지하는 능력으로 주목받고 있어, 빠른 가격 움직임을 활용하려는 트레이더에게 필수적인 도구입니다. 사용자들은 핍 기반의 중요한 움직임(예: 10핍 단위)을 최대 95%의 신뢰도로 식별하며, 실시간 알림을 활용하여 변동성 급등을 포착함으로써 거래 타이밍이 20-30% 개선되었다고 보고합니다. 주요 이점에는 다중 통화 모니터링, 사용자 정의 가능한 핍 임계값, 지속적인 차트 분석 없이 추적을 단순화하는 경량 디자인이 포함되어 스캘퍼, 데이 트레이더, 스윙 트레이더에게
FREE
RSI Currency Strength Meter is a powerful and elegant multi-currency indicator that measures the real-time relative strength of the 8 major currencies using RSI logic. By calculating the smoothed performance of each currency across its major pairs and applying the RSI formula, it delivers clean and responsive strength lines that make it easy to spot which currencies are truly strong or weak at any moment. This indicator is particularly useful for visualizing currency correlations and divergence
Visual Momentum Flow Indicator
AL MOOSAWI ABDULLAH JAFFER BAQER
Visual Momentum Flow Indicator: Decode the Market's True Intent Are you tired of indicators that only work in trending markets, leaving you confused during consolidations? Do you struggle to distinguish between a genuine momentum breakout and a false move within a ranging market? The Visual Momentum Flow Indicator is your solution. This meticulously engineered tool is designed not just to follow trends, but to interpret the very character of the market, giving you a distinct edge by clearly ide
VIX index
Carlos Andrés Moya Erazo
The VIX Index, or CBOE Volatility Index, is an indicator designed for MetaTrader 5 that transforms historical volatility into an easy-to-interpret oscillator, placing the volatility range between 0 (minimum) and 100 (maximum) based on a configurable normalization period. Unlike a simple ATR, this oscillator shows you on the chart when volatility is abnormally low or high compared to its recent behavior. Additionally, the indicator provides context and information about the famous VIX Volatility
FREE
RED ZONE Monitor Loss-Cut & Break-Even Risk Monitor for Averaging Traders (MT5) RED ZONE Monitor is a risk management indicator for traders who use averaging, scaling-in, or multiple open positions . It visually displays: The loss-cut (liquidation) risk zone The break-even price Based on current open positions, lots, and margin conditions This indicator does not provide entry signals. It does not promise profits. It shows where your account actually fails if price moves against you. What RED ZO
Smart FVG Stats
- Md Rashidul Hasan
The  Smart FVG Statistics Indicator  is a powerful MetaTrader 5 tool designed to automatically identify, track, and analyze Fair Value Gaps (FVGs) on your charts. Love it? Hate it? Let me know in a review! Feature requests and ideas for new tools are highly appreciated. :) Try "The AUDCAD Trader": https://www.mql5.com/en/market/product/151841 Key Features Advanced  Fair Value Gap  Detection Automatic Identification : Automatically scans for both bullish and bearish FVGs across specified histo
FREE
Currency Strength Meter is the easiest way to identify strong and weak currencies. This indicator shows the relative strength of 8 major currencies + Gold: AUD, CAD, CHF, EUR, GBP, JPY, NZD, USD, XAU. Gold symbol can be changed to other symbols like XAG, XAU etc. By default the strength value is normalised to the range from 0 to 100 for RSI algorithm: The value above 60 means strong currency; The value below 40 means weak currency; This indicator needs the history data of all 28 major currency
Volume Data on Candles Indicator for MetaTrader 5 Maximize your trading insights with the Volume Data on Candles indicator for MetaTrader 5. This powerful tool provides real-time volume data directly on each candle, allowing you to identify significant shifts in market activity. When the volume of a candle exceeds the average of the last 50 candles, it will be clearly highlighted , ensuring you don't miss out on potential high-volume movements. Key Features: Real-Time Volume Data : Displays volu
FREE
Volume Profile Pro 보조지표 이 지표는 "어떤 가격대에서 가장 많은 거래가 일어났는지" 분석하는 Volume Profile Pro 도구입니다. 다음과 같은 특별한 기능이 있습니다: 표시 모드 (Display Modes) Volume Profile (일반): 각 가격대의 총 거래량(Total Volume)을 표시하여 중요한 지지 및 저항 구간을 보여줍니다. Delta / Money Flow: 매수세와 매도세(Buy vs Sell)의 "차이(Delta)"를 표시하여 해당 가격대에서 누가 시장을 주도하는지 보여줍니다. 거래량(Volume) 또는 자금 흐름(Money Flow)으로 선택하여 볼 수 있습니다. 계산 모드 (Calculation Modes) Pro 버전의 강점은 기간 설정의 유연성입니다: Fixed Mode (고정 모드): 과거 캔들 개수를 고정하여 설정합니다 (예: 최근 100개 캔들). Dynamic Mode (핵심 기능): 수직선(Vertical Line)이
Moving Spread
Jose Maria Molina Sanchez
Moving Spread – 실시간 시장 비용 모니터 평균 스프레드를 실시간으로 모니터링하고 고비용 기간의 거래를 피하세요. 이 지표의 기능 Moving Spread 는 시간이 지남에 따라 시장의 평균 스프레드(포인트 단위) 를 측정하여 그 변동을 보여줍니다. 이는 진입 비용이 너무 높을 때를 파악하는 데 필수적인 도구입니다. 이러한 상황에서는 거래 시작 전에 이미 수익이 줄어들 수 있습니다. 왜 이것이 중요한가요? 높은 스프레드는 시장 진입 및 청산 시 더 많은 비용을 지불한다는 것을 의미합니다. 이 지표는 이러한 순간을 식별하고 비용이 과도할 때 거래를 피하는 데 도움을 줍니다. 작동 방식 별도의 창에서 현재 스프레드를 표시 하며, 평균값을 나타내는 빨간색 선이 있습니다. 스프레드가 정의된 임계값(예: > 0)을 초과하면 자동 알림 을 제공합니다. 스캘퍼 및 당일 트레이더에게 이상적 이며, "블리딩"(지속적인 손실)로 인한 숨겨진 손실을 방지하는 데 도움이 됩니
FREE
Ultimate Candle Patterns
Wojciech Daniel Knoff
Check out my TRADE PLANNER MT5 – strongly recommended to anticipate account scenarios before risking any money. This is a multi-symbol, multi-timeframe, table-based indicator for MetaTrader 5 that identifies 46 types of candlestick formations. Each formation has its own image for easier recognition. The indicator includes popular patterns such as Engulfing, Hammer, Three Line Strike, Piercing, and Doji-like candles. You can check the full list of patterns in the screenshots below. Also you can
Price Alerts Advanced Price Target Notifications
Elsayed Mohamed Kamal Elsayed Abdelwadod
Price Alerts - Advanced Price Target Notifications Never miss important price levels again! Price Alert Pro lets traders: • Set unlimited price target alerts • Receive instant desktop and mobile notifications • Visually track progress to each target • Customize alert sounds and frequencies • Manage all alerts from an intuitive panel Perfect for: - Breakout traders waiting for key levels - News traders monitoring reaction points - Position traders managing multiple targets - All traders who c
Gold Venamax MT5
Sergei Linskii
2.67 (3)
Gold Venamax - 이것은 최고의 주식 기술 지표입니다. 지표 알고리즘은 자산의 가격 변동을 분석하고 변동성과 잠재적 진입 영역을 반영합니다. 표시기 기능: 이것은 편안하고 수익성 있는 거래를 위한 매직과 두 개의 추세 화살표 블록을 갖춘 슈퍼 지표입니다. 블록 전환을 위한 빨간색 버튼이 차트에 표시됩니다. 매직은 표시기 설정에서 설정되므로 서로 다른 블록을 표시하는 두 개의 차트에 표시기를 설치할 수 있습니다. Gold Venamax는 서로 다른 화살표 버퍼(GV 및 SD)를 사용하여 두 개의 차트에 배치할 수 있습니다. 이렇게 하려면 설정에서 다른 Magic을 선택해야 합니다. 예를 들어 하나는 Magic = 999이고 다른 하나는 Magic = 666입니다. 다음으로 차트의 빨간색 버튼으로 화살표 버퍼를 선택할 수 있습니다. 지표 설정의 각 화살표 버퍼(GV 및 SD)에는 편안하고 수익성 있는 거래를 위한 별도의 화살표 필터가 있습니다(UseFiltrGV = true;
Trading Room Indcator
Meshari F M Alkhawaled
Trading Room Indicator is a professional market-structure tool built to give traders a clear, complete trading framework — combining CPR levels, dynamic targets, and trend direction in one clean view. Instead of guessing direction or overloading the chart with indicators, Trading Room Indicator focuses on what actually matters : levels, direction, and potential price expansion. What This Indicator Provides CPR Structure BUY level SELL level Pivot Point (PP) Designed to highlight equilibrium
Knowledge of the strength and weakness of each currency is vital for every forex trader. Our   Currency Strength Meter indicator   measures the strength of eight major currencies (USD, EUR, GBP, CHF, JPY, CAD, AUD, NZD) by using the Relative Strength Index indicator, also known as RSI. The Currency Strength Meter indicator shows you, simply and quickly, when a currency is oversold, overbought, or in "normal area". This way, you can identify which currency is the strongest and the weakest. Our
TheRealPrice v3.0 | Ultimate Spread & Ask Visualizer TheRealPrice is a high-precision utility for MetaTrader 5 designed to expose the hidden cost of every trade: The Spread . While standard charts only display the Bid price, professional traders know that buy orders and short-exits happen at the Ask price. TheRealPrice bridges this gap by drawing a dynamic, real-time horizontal line that tracks the exact Ask level, providing a clear visual representation of the current market spread. Why do you
FlagTrend TF
Dorival Cardozo
FlagTrendTF Free Indicator for MetaTrader 5 FlagTrendTF is a free MetaTrader 5 indicator designed to help traders identify market trends across multiple timeframes quickly and visually. It is ideal for confirming whether the market direction is aligned from higher timeframes down to the trading timeframe. How FlagTrendTF Works The indicator allows you to monitor up to 4 timeframes simultaneously , displaying easy-to-read arrows: Green arrow : bullish trend Red arrow : bearish trend This fa
FREE
Entry Helper
Gayathiri Gopalakrishnan
Entry Helper - Professional MT5 Indicator Documentation Overview Entry Helper is a professional-grade MetaTrader 5 indicator that combines 15 advanced analysis layers for comprehensive market analysis Designed for serious traders requiring institutional-level analysis capabilities ## Core Features 1 - 15 simultaneous analysis layers 2 - Machine learning price prediction 3 - Smart Money Concepts detection 4 - Institutional order flow analysis 5 - Multi-timeframe confluence system 6 - AI pa
Correlation Matrix Pro - 다중 통화 헤지 스캐너 실시간으로 통화쌍 간의 상관관계를 파악하세요! 최대 6개의 통화쌍 간 통계적 관계를 동시에 시각화하는 강력한 분석 도구입니다. 포트폴리오 관리, 리스크 분산 및 헤지 전략에 완벽합니다. 주요 기능 - 로그 수익률을 사용한 실시간 피어슨 상관관계 - 최대 6개 통화쌍 동시 모니터링 - 자동 타임프레임 감지 - 조정 가능한 룩백 기간 (5-200 봉) - 헤지 기회 자동 감지 - 미니멀하고 접을 수 있는 패널 디자인 - 즉각적인 해석을 위한 색상 코딩 매트릭스 색상 코드 녹색 (+0.70 ~ +1.00) = 강한 양의 상관관계 연녹색 (+0.50 ~ +0.69) = 중간 양의 상관관계 회색 (-0.49 ~ +0.49) = 약한/상관관계 없음 주황색 (-0.50 ~ -0.69) = 중간 음의 상관관계 빨간색 (-0.70 ~ -1.00) = 강한 음의 상관관계 (헤지) 왜 상관관계인가? 리스크 관리 높은 상관관계 포지션을
FREE
개요 Candle Timer Countdown Pro는 현재 캔들의 마감까지 남은 시간을 부드럽고 정확하게 카운트다운으로 표시하며, 원형 진행 아크를 통해 남은 시간을 직관적으로 보여줍니다. 서버 시간 보간(Server Time Interpolation) 기술을 사용하여 틱이 없는 구간에서도 멈춤 없이 부드럽게 작동합니다. M1부터 MN까지 모든 타임프레임을 지원합니다. 스캘핑(1분 차트)부터 스윙 트레이딩(H4 이상)까지, 캔들 마감 시간을 정확히 파악하면 진입 타이밍을 개선하고 성급한 결정을 방지할 수 있습니다. 주요 특징 틱 간 멈춤 없는 정확한 카운트다운 원형 진행 표시 (Ring 또는 Filled Pie) 6가지 표시 위치 선택 가능 3가지 색상 모드 (Manual / Candle Outline / Candle Body) 마감 직전 하이라이트 기능 연결 상태 감지 (Active / Inactive / Disconnected) 새 캔들 알림 (팝업, 이메일, 푸시) 모든 타임
WH SMC Indicator MT5
Wissam Hussein
5 (1)
Welcome to the ultimate Smart Money Concepts indicator ,, this indicator is All-in-One package the only thing you need to empower  all the Smart Money Concepts  in one place with interactive advanced gui panel with all the features and customization you need. MT4 Version :   WH SMC Indicator MT4 *This Price For Limited Number of Copies.  Features:  Main Section: User-Friendly Panel (GUI):  Designed for traders of all experience levels, the indicator integrates seamlessly into your MT5 platform
Dynamic Spread and Swap
Bernard Kimani Mugwe
Tired of manually clicking through every chart just to check the current spread or overnight swap fees? The Dynamic Spread and Swap  is a must-have utility that solves this problem by displaying all critical cost information for your favorite trading symbols in one clean, convenient dashboard. This lightweight tool automatically detects all symbols from your open charts and presents the data in a non-intrusive panel on your screen. Stop guessing your trading costs and start making more informed
FREE
Visual CrossPulse Dynamics Indicator
AL MOOSAWI ABDULLAH JAFFER BAQER
Visual CrossPulse Dynamics: Trade with the Market's True Rhythm Unlock a new level of market insight with Visual CrossPulse Dynamics, a sophisticated trading indicator designed to adapt to ever-changing volatility and reveal the true direction of the trend. Are you tired of indicators that lag in fast-moving markets or give false signals during consolidation? The Visual CrossPulse Dynamics indicator solves this problem by using an advanced, adaptive algorithm that intelligently adjusts to the m
Price Magnet — Price Density and Attraction Levels Indicator Price Magnet is a professional analytical tool designed to identify key support and resistance levels based on statistical Price Density. The indicator analyzes a specified historical period and detects price levels where the market spent the most time. These zones act as “magnets,” attracting price action or forming a structural base for potential reversals. Unlike traditional Volume Profile tools, Price Magnet focuses on price-time d
Volume Profile VFX
Thanutchaya Phatsathit
Volume Profile VFX:  Why Choose Volume Profile VFX?  Volume Profile VFX is engineered for traders who demand precision, reliability, and a decisive edge in modern markets — and every future Dynamic Visual Effects (VFX) update is included free for the lifetime of your license.                                     Feature Volume Profile VFX Volume Logic Advanced Data Validation Engine. Verified data accuracy, overriding common broker feed inconsistencies. Data Integrity Non-Repainting & Non-Lagg
MT5 Session Indicator: Track Global Market Hours with Precision Boost your trading strategy with this FREE Session Indicator for MetaTrader 5 , designed to help you effortlessly identify active trading sessions across global markets. Perfect for forex, stocks, and commodities traders, this tool highlights key market hours (Asian, European, North American, and overlaps) directly on your chart, ensuring you never miss high-liquidity periods. Key Features: Visual Session Overlays : Clear color-c
FREE
Volume Profile V6
Andrey Kolesnik
4.67 (3)
시장 매물대 지표(Volume Profile) + 스마트 오실레이터. 통화 쌍, 주식, 선물, 암호화폐 등 거의 모든 종목에서 작동하며, 실제 거래량(Real Volume)과 틱 거래량(Tick Volume)을 모두 지원합니다. 프로파일 생성 범위를 일주일이나 한 달 등으로 자동 설정할 수 있을 뿐만 아니라, 두 개의 수직선(빨간색과 파란색)을 이동하여 수동으로 범위를 설정할 수도 있습니다. 히스트그램 형태로 표시되며, 특정 가격 수준의 히스토그램 너비는 해당 가격대에서 발생한 거래량을 의미합니다. Mode level line color 파라미터를 사용하면 가격이 반등할 가능성이 높은 주요 매물대 수준을 자동으로 표시할 수 있으며, Maximum color 파라미터는 설정된 전체 범위에서 거래가장 많이 발생한 최대 거래량 수준을 별도로 보여줍니다. 스마트 오실레이터는 과매수 및 과매도 구간을 표시합니다. 여러 지표로부터 오는 정보를 분석하고, 처리된 데이터를 바탕으로 과매수 및 과매
Fair Value Gap FVG
George Njau Ngugi
A fair value gap (FVG) is a temporary price gap that occurs when the price of a stock or security is out of line with its fair value.   This gap is often caused by an imbalance between buyers and sellers. How it works Price imbalance When there is an imbalance between buyers and sellers, the price of a security can move too quickly. Price gap This creates an unadjusted area on the price chart, known as the fair value gap Price correction The price is often drawn back to the fair value gap, as i
Elite Harmony Signals Pro Panoramica Elite Harmony Signals è un indicatore sofisticato di analisi tecnica che visualizza rettangoli dinamici che forniscono zone di trading chiare e segnali di conferma per decisioni migliorate. Caratteristiche Principali Zone Rettangolo Dinamiche Estensione in Tempo Reale : I rettangoli si estendono automaticamente all'azione corrente del prezzo Chiusura Intelligente : I rettangoli si chiudono solo quando appaiono segnali opposti Conferma Visiva : Zone di trading
이 제품의 구매자들이 또한 구매함
SuperScalp Pro
Van Minh Nguyen
4.72 (18)
SuperScalp Pro – 고급 다중 필터 스캘핑 인디케이터 시스템 SuperScalp Pro는 클래식 Supertrend와 여러 지능형 확인 필터를 결합한 고급 스캘핑 인디케이터 시스템입니다. 해당 인디케이터는 M1부터 H4까지 모든 타임프레임에서 효율적으로 작동하며, 특히 XAUUSD, BTCUSD 및 주요 외환 통화쌍에 적합합니다. 독립형 시스템으로 사용하거나 기존 거래 전략에 유연하게 통합할 수 있습니다. 이 인디케이터는 11개 이상의 필터를 통합하며, 빠른/느린 EMA, 추세 판별용 3개의 EMA, EMA 기울기(EMA slope), RSI, ADX, 거래량(Volume), VWAP, 볼린저 밴드 돌파(Bollinger Bands Breakout) 및 MACD 다이버전스 필터 등을 포함합니다. 스마트 캔들 필터는 캔들 종가를 확인하여 약한 신호를 제거하고, 3 EMA와 MACD 다이버전스 필터를 결합한 추세 인식 메커니즘은 더 높은 승률의 신호를 선별하는 데 도움을 줍니
Azimuth Pro
Ottaviano De Cicco
5 (6)
LAUNCH PROMO Azimuth Pro price is initially set at 299$ for the first 100 buyers. Final price will be 499$ . THE DIFFERENCE BETWEEN RETAIL AND INSTITUTIONAL ENTRIES ISN'T THE INDICATOR — IT'S THE LOCATION. Most traders enter at arbitrary price levels, chasing momentum or reacting to lagging signals. Institutions wait for price to reach structured levels where supply and demand actually shift. Azimuth Pro maps these levels automatically: swing-anchored VWAP, multi-timeframe structure lines, an
Power Candles MT5
Daniel Stein
5 (7)
Power Candles – 모든 시장을 위한 강도 기반 진입 신호 Power Candles 는 Stein Investments의 검증된 강도 분석을 가격 차트에 직접 제공합니다. 가격 움직임에만 반응하는 대신, 각 캔들은 실제 시장 강도를 기준으로 색상화되어 모멘텀 형성, 강도 가속, 명확한 추세 전환을 즉시 파악할 수 있습니다. 모든 시장을 위한 단일 로직 Power Candles는 모든 거래 심볼 에서 자동으로 작동합니다. 현재 심볼이 Forex인지 비-Forex 시장인지 자동으로 감지하여 내부적으로 적절한 강도 모델을 적용합니다. Forex 및 Gold 는 FX Power Delta 값을 사용합니다 (절대값 범위 최대 100) 지수, 크립토 및 CFD 는 IX Power Strength 값을 사용합니다 (절대값 범위 최대 50) 필요한 강도 계산은 Power Candles에 완전히 내장되어 있습니다. 캔들 색상이나 신호 로직을 위해 추가 인디케이터는 필요하지 않습니다. 가격
Entry In The Zone and SMC Multi Timeframe is a real-time 2-in-1 market analysis tool that combines market structure analysis and a No Repaint BUY / SELL signal system into a single indicator, built on Smart Money Concepts (SMC) — a widely adopted framework used by professional traders to understand market structure. This indicator helps you see the market more clearly, make decisions based on structure rather than guesswork, and focus on high-probability zones where price is more likely to react
Divergence Bomber
Ihor Otkydach
4.9 (86)
이 지표를 구매하신 분께는 다음과 같은 혜택이 무료로 제공됩니다: 각 거래를 자동으로 관리하고, 손절/익절 수준을 설정하며, 전략 규칙에 따라 거래를 종료하는 전용 도우미 툴 "Bomber Utility" 다양한 자산에 맞게 지표를 설정할 수 있는 셋업 파일(Set Files) "최소 위험", "균형 잡힌 위험", "관망 전략" 모드로 설정 가능한 Bomber Utility의 셋업 파일 이 전략을 빠르게 설치, 설정, 시작할 수 있도록 돕는 단계별 영상 매뉴얼 주의: 위의 모든 보너스를 받기 위해서는 MQL5 개인 메시지 시스템을 통해 판매자에게 연락해 주세요. 독창적인 커스텀 지표인 “Divergence Bomber(다이버전스 봄버)”를 소개합니다. 이 지표는 MACD 다이버전스(괴리) 전략을 기반으로 한 올인원(All-in-One) 거래 시스템입니다. 이 기술 지표의 주요 목적은 가격과 MACD 지표 간의 다이버전스를 감지하고, **향후 가격이 어느 방향으로 움직일지를 알려주는
이 지표를 구매하면 제 프로페셔널 트레이드 매니저를 무료로 드립니다. 우선 이 거래 시스템이 리페인팅, 리드로잉 및 레이그 인디케이터가 아니라는 점을 강조하는 것이 중요합니다. 이는 수동 및 로봇 거래 모두에 이상적인 것으로 만듭니다. 온라인 강좌, 설명서 및 프리셋 다운로드. "스마트 트렌드 트레이딩 시스템 MT5"은 새로운 및 경험이 풍부한 트레이더를 위해 맞춤형으로 제작된 종합적인 거래 솔루션입니다. 10개 이상의 프리미엄 인디케이터를 결합하고 7개 이상의 견고한 거래 전략을 특징으로 하여 다양한 시장 조건에 대한 다목적 선택이 가능합니다. 트렌드 추종 전략: 효과적인 트렌드 추이를 타기 위한 정확한 진입 및 손절 관리를 제공합니다. 반전 전략: 잠재적인 트렌드 반전을 식별하여 트레이더가 범위 시장을 활용할 수 있게 합니다. 스캘핑 전략: 빠르고 정확한 데이 트레이딩 및 단기 거래를 위해 설계되었습니다. 안정성: 모든 인디케이터가 리페인팅, 리드로잉 및 레이그가 아니므로 신뢰
Meridian Pro
Ottaviano De Cicco
5 (1)
Meridian Pro: Professional Multi-Timeframe Trend Matrix for MT5 Overview Meridian Pro is a multi-timeframe trend matrix by Merkava Labs that compresses directional state, strength, momentum condition and matrix agreement into one compact panel. One adaptive engine, applied consistently from M1 to W1. No per-symbol tuning. No indicator stacking. One structured readout across every asset and every timeframe. Launch Offer — Get Meridian Pro for USD 99 (introductory). Regular price: USD 149. 1. Why
OmniSync Projection
Antonio-alin Teculescu
5 (1)
Chronos Fractal Engine is an innovative price projection indicator for MetaTrader 5, designed to transform your technical analysis by intelligently identifying and projecting historical price patterns. Built upon an advanced correlation algorithm and the fractal principles of the market, this powerful tool visualizes potential future price movements, giving you a unique edge in your trading decisions. What is Chronos Fractal Engine? At its core, the Chronos Fractal Engine employs a sophisticat
Gold Entry Sniper
Tahir Mehmood
5 (8)
Gold Entry Sniper – 골드 스캘핑 & 스윙 트레이딩을 위한 전문 다중 시간 프레임 ATR 대시보드 Gold Entry Sniper 는 XAUUSD 및 기타 종목에 대해 정확한 매수/매도 신호 를 제공하는 고급 MetaTrader 5 지표입니다. ATR 트레일링 스톱 로직 과 다중 시간 프레임 분석 을 기반으로 설계되어 스캘핑과 스윙 트레이딩 모두에 적합합니다. 주요 기능 및 장점 다중 시간 프레임 분석 – M1, M5, M15 추세를 한눈에 확인. ATR 기반 트레일링 스톱 – 변동성에 따라 자동 조정. 전문 차트 대시보드 – 신호 상태, ATR 레벨, 회귀선, 매매 방향 표시. 명확한 매수/매도 마커 – 자동 화살표와 텍스트 라벨. 종료 알림 & 거래 관리 – 수익 보호를 위한 자동 종료 감지. 완전 사용자 설정 가능 – 대시보드 위치, 색상, ATR/회귀선 파라미터 조정. 골드(XAUUSD) 최적화 – M1~M15 스캘핑에 완벽, 외환/지수/암호화폐에도 적용 가능.
Trend Screener Pro MT5
STE S.S.COMPANY
4.85 (104)
트렌드 표시기, 트렌드 트레이딩 및 필터링을 위한 획기적인 고유 솔루션, 하나의 도구 안에 내장된 모든 중요한 트렌드 기능! Forex, 상품, 암호 화폐, 지수 및 주식과 같은 모든 기호/도구에 사용할 수 있는 100% 다시 칠하지 않는 다중 시간 프레임 및 다중 통화 표시기입니다. Trend Screener는 차트에 점이 있는 화살표 추세 신호를 제공하는 효율적인 지표 추세 추종 지표입니다. 추세 분석기 표시기에서 사용할 수 있는 기능: 1. 트렌드 스캐너. 2. 최대 이익 분석이 있는 추세선. 3. 추세 통화 강도 측정기. 4. 경고가 있는 추세 반전 점. 5. 경고가 있는 강력한 추세 점. 6. 추세 화살표 Trend Screener Indicator가 있는 일일 분석 예, 일일 신호 성능...등은 여기에서 찾을 수 있습니다. 여기를 클릭하십시오. LIMITED TIME OFFER : Trend Screener Indicator는 50$ 및 평생 동안만 사용할 수 있습니다.
Btmm state engine pro
Garry James Goodchild
5 (3)
BTMM State Engine Pro is a MetaTrader 5 indicator for traders who use the Beat The Market Maker approach: Asian session context, kill zone timing, level progression, peak formation detection, and a multi-pair scanner from a single chart. It combines cycle state logic with a built-in scanner dashboard so you do not need the same tool on many charts at once. What it does Draws the Asian session range; session times can follow broker server offset or be set in inputs. Tracks level progression (L
Power Bar MT5
Daniel Stein
실제 자금을 투입하기 전에 어떤 전략이 내 심볼에서 효과적인지 확인하세요. Power Bar는 모든 심볼과 모든 타임프레임에서 극단적인 가격 바 를 감지한 다음, 3가지 다른 트레이딩 전략을 즉시 백테스트하여 승률, 수익 팩터, 손익을 나란히 비교할 수 있습니다. 모든 것이 하나의 인터랙티브 패널에 담겨 있습니다. 추측 없음. 커브 피팅 없음. 오직 데이터뿐입니다. Power Bar가 특별한 이유 대부분의 인디케이터는 신호를 주고 그것이 효과가 있는지는 추측에 맡깁니다. Power Bar는 한 걸음 더 나아갑니다 - 모든 신호를 세 가지 전략 에 대해 테스트하고 통계를 보여줍니다. FlipFlop, Momentum, Reversal을 원클릭으로 전환하고 숫자가 즉시 변하는 것을 확인하세요. FlipFlop - 항상 포지션 유지. 신호에 진입하고, 반대 신호에 청산. 당사의 연구에 따르면 US30, US500, DAX와 같은 추세가 있는 지수에서 가장 효과적입니다. Momentum
FX Trend MT5 NG
Daniel Stein
5 (4)
FX Trend NG: 차세대 멀티 마켓 트렌드 인텔리전스 개요 FX Trend NG 는 다중 시간 프레임 기반의 전문 트렌드 분석 및 시장 모니터링 도구입니다. 몇 초 만에 전체 시장 구조를 파악할 수 있도록 설계되었습니다. 여러 차트를 일일이 전환할 필요 없이, 어떤 종목이 추세에 있는지, 어디에서 모멘텀이 약화되고 있는지, 그리고 어떤 시간 프레임이 서로 정렬되어 있는지 즉시 확인할 수 있습니다. 출시 기념 특별 혜택 – FX Trend NG 를 $30 (6개월) 또는 $80 평생 라이선스 로 이용할 수 있습니다. 이미 Stein Investments 고객이신가요? -> 메시지를 보내 전용 고객 그룹에 참여하세요. 설정이나 사용 방법이 필요하신가요? -> Stein Investments 공식 페이지 를 방문하세요. 1. FX Trend NG가 특별한 이유 3단계 추세 로직 – 단순한 Buy / Sell이 아닙니다 • 대부분의 지표는 Buy 또는 Sell 두 가지 상태만 제
Crystal Heikin Ashi Signals
Muhammad Jawad Shabir
5 (2)
Crystal Heikin Ashi Signals - Professional Trend & Signal Detection Indicator Advanced Heikin Ashi Visualization with Intelligent Signal System for Manual & Automated Trading Final Price: $149 ---------> Price goes up $10 after every 10 sales . Limited slots available — act fast . Overview Crystal Heikin Ashi Signals is a professional-grade MetaTrader 5 indicator that combines pure Heikin Ashi candle visualization with an advanced momentum-shift detection system. Designed for both manual traders
RFI levels PRO MT5
Roman Podpora
3.67 (3)
이 지표는 추세 반전 지점과 가격 반등 영역을 정확하게 보여줍니다.       주요 투자자들   . 새로운 트렌드가 형성되는 곳을 파악하고 최대한 정확하게 의사결정을 내리며 모든 거래를 완벽하게 통제합니다. TREND LINES PRO   지표와 함께 사용할 때 최대의 잠재력을 발휘합니다.  VERSION MT4 지표가 보여주는 내용: 새로운 추세의 시작 시 활성화되는 반전 구조 및 반전 수준. 최소한의 위험 대비 수익률을 갖는 이익 실현   (TAKE PROFIT)   및   손절매(STOP LOSS)   레벨 표시       RR 1:2   . 지능형 손실 감소 로직이 적용된 손절매 기능. 지정된 지표에서 두 가지 추세 유형에 대한 반전 패턴을 표시합니다. 지표: 트렌드를 따라   트렌드 라인 프로   (글로벌 트렌드 변화) 트렌드 프로   (빠른 트렌드 변화) 간단하고 효과적입니다       스캐너       실시간 추세 (신규). 다중 시간 프레임 도구 필터링. 표시하다  
Trend indicator AI mt5
Ramil Minniakhmetov
5 (16)
트렌드 인공 지능 지표는 실행 가능한 진입 점 및 반전 경고와 추세 식별을 결합하여 상인의 시장 분석을 향상시킬 훌륭한 도구입니다. 이 표시기는 사용자가 자신감과 정밀도로 외환 시장의 복잡성을 탐색 할 수 있도록 지원합니다 기본 신호 외에도 트렌드 인공 지능 지표는 풀백 또는 되돌림 중에 발생하는 2 차 진입 점을 식별하여 거래자가 기존 트렌드 내에서 가격 수정을 활용할 수 있도록합니다. 중요한 장점: ·작동 4 및 5 *명확한 구매 또는 판매 신호 *다시 칠하지 않습니다 *모든 자산에서 작동 나는 전보 사기에 개 또는 세트를 판매하지 않도록주의. 모든 설정은 블로그에 여기에 무료.  중요! 지침 및 보너스를 얻기 위해 구입 후 즉시 저에게 연락! 진짜 가동 감시는 뿐 아니라 나의 다른 제품 여기에서 찾아낼 수 있습니다: https://www.mql5.com/en/users/mechanic/seller&nbsp ; 설정 및 입력: 모든 자산에 대해 기본 설정을 권
Bill Williams Advanced
Siarhei Vashchylka
5 (11)
Bill Williams Advanced is designed for automatic chart analysis using Bill Williams' "Profitunity" system. The indicator analyzes four timeframes at once. Manual (Be sure to read before purchasing) Advantages 1. Analyzes the chart using Bill Williams' "Profitunity" system. Signals are displayed in a table in the corner of the screen and on the price chart. 2. Finds all known AO and AC signals, as well as zone signals. Equipped with a trend filter based on the Alligator. 3. Finds "Divergence Bar
Atomic Analyst MT5
Issam Kassas
3.94 (31)
우선적으로 언급할 점은이 거래 지표가 다시 그리지 않고 지연되지 않으며 이를 통해 수동 및 로봇 거래 모두에 이상적이라는 점입니다. 사용자 매뉴얼: 설정, 입력 및 전략. Atomic Analyst는 가격의 강도와 모멘텀을 활용하여 시장에서 더 나은 이점을 찾는 PA Price Action Indicator입니다. 고급 필터를 장착하여 잡음과 거짓 신호를 제거하고 거래 잠재력을 높이는 데 도움이 됩니다. 복잡한 지표의 다중 레이어를 사용하여 Atomic Analyst는 차트를 스캔하고 복잡한 수학적 계산을 간단한 신호와 색상으로 변환하여 초보 트레이더가 이해하고 일관된 거래 결정을 내릴 수 있도록합니다. "Atomic Analyst"는 새로운 및 경험이 풍부한 트레이더를위한 종합적인 거래 솔루션입니다. 프리미엄 지표와 최고 수준의 기능을 하나의 거래 전략에 결합하여 모든 종류의 트레이더에 대한 다재다능한 선택지가되었습니다. 인트라데이 거래 및 스캘핑 전략 : 빠르고 정확한 일일
Quantum TrendPulse
Bogdan Ion Puscasu
5 (22)
SuperTrend   ,   RSI   ,   Stochastic   의 힘을 하나의 포괄적인 지표로 결합하여 트레이딩 잠재력을 극대화하는 궁극의 트레이딩 도구   인 Quantum TrendPulse를   소개합니다. 정밀성과 효율성을 추구하는 트레이더를 위해 설계된 이 지표는 시장 추세, 모멘텀 변화, 최적의 진입 및 종료 지점을 자신 있게 식별하는 데 도움이 됩니다. 주요 특징: SuperTrend 통합:   주요 시장 추세를 쉽게 따라가고 수익성의 물결을 타세요. RSI 정밀도:   매수 과다 및 매도 과다 수준을 감지하여 시장 반전 시점을 파악하는 데 적합하며 SuperTrend 필터로 사용 가능 확률적 정확도:   변동성이 큰 시장에서 숨겨진 기회를 찾기 위해 확률적 진동   을 활용하고 SuperTrend의 필터로 사용 다중 시간대 분석:   M5부터 H1 또는 H4까지 다양한 시간대에 걸쳐 시장을 최신 상태로 유지하세요. 맞춤형 알림:   맞춤형 거래 조건이 충족되면
Gann Made Easy MT5
Oleg Rodin
5 (2)
Gann Made Easy 는 mr.의 이론을 사용하여 최고의 거래 원칙을 기반으로 하는 전문적이고 사용하기 쉬운 Forex 거래 시스템입니다. W.D. 간. 이 표시기는 Stop Loss 및 Take Profit Levels를 포함하여 정확한 BUY 및 SELL 신호를 제공합니다. PUSH 알림을 사용하여 이동 중에도 거래할 수 있습니다. 구매 후 거래 방법 안내 및 유용한 추가 지표를 무료로 받으시려면 저에게 연락주세요! 아마도 Gann 거래 방법에 대해 이미 여러 번 들었을 것입니다. 일반적으로 Gann의 이론은 초보자 거래자뿐만 아니라 이미 거래 경험이 있는 사람들에게도 매우 복잡한 것입니다. Gann의 거래 방식은 이론적으로 적용하기 쉽지 않기 때문입니다. 나는 그 지식을 연마하고 Forex 지표에 최고의 원칙을 적용하기 위해 몇 년을 보냈습니다. 표시기는 적용하기가 매우 쉽습니다. 차트에 첨부하고 간단한 거래 권장 사항을 따르기만 하면 됩니다. 지표는 지속적으로 시장 분석
PZ Trend Trading MT5
PZ TRADING SLU
3.8 (5)
Capture every opportunity: your go-to indicator for profitable trend trading Trend Trading is an indicator designed to profit as much as possible from trends taking place in the market, by timing pullbacks and breakouts. It finds trading opportunities by analyzing what the price is doing during established trends. [ Installation Guide | Update Guide | Troubleshooting | FAQ | All Products ] Trade financial markets with confidence and efficiency Profit from established trends without getting whip
ARICoins
Temirlan Kdyrkhan
ARICoin is a powerful trading companion designed to generate high-probability entry signals with dynamic TP/SL/DP levels based on volatility. Built-in performance tracking shows win/loss stats, PP1/PP2 hits, and success rates all updated live. Key Features: Buy/Sell signals with adaptive volatility bands Real-time TP/SL/DP levels based on ATR Built-in MA Filter with optional ATR/StdDev volatility Performance stats panel (Success, Profit/Loss, PP1/PP2) Alerts via popup, sound, push, or email Cust
RelicusRoad Pro MT5
Relicus LLC
5 (24)
RelicusRoad Pro: 퀀트 시장 운영 체제 70% 할인 평생 이용권 (한정 시간) - 2,000명 이상의 트레이더와 함께하세요 왜 대부분의 트레이더는 "완벽한" 지표를 가지고도 실패할까요? 진공 상태에서 단일 개념 만으로 거래하기 때문입니다. 문맥 없는 신호는 도박입니다. 지속적인 승리를 위해서는 컨플루언스(중첩) 가 필요합니다. RelicusRoad Pro는 단순한 화살표 지표가 아닙니다. 완전한 퀀트 시장 생태계 입니다. 독점적인 변동성 모델링을 사용하여 가격이 이동하는 "공정 가치 로드"를 매핑하고, 단순 노이즈와 실제 구조적 돌파를 구분합니다. 추측은 그만두세요. 기관급 로드 로직으로 거래를 시작하세요. 핵심 엔진: "Road" 알고리즘 시스템의 중심에는 시장 상황에 실시간으로 적응하는 동적 변동성 채널인 Road Algo 가 있습니다. 세이프 라인(평형) 과 가격이 수학적으로 반전될 가능성이 높은 확장 레벨 을 투영합니다. Simple Road: 일반적인 시장을 위
FX Power MT5 NG
Daniel Stein
5 (31)
FX Power: 통화 강세 분석으로 더 스마트한 거래 결정을 개요 FX Power 는 어떤 시장 상황에서도 주요 통화와 금의 실제 강세를 이해하기 위한 필수 도구입니다. 강한 통화를 매수하고 약한 통화를 매도함으로써 FX Power 는 거래 결정을 단순화하고 높은 확률의 기회를 발견합니다. 트렌드를 따르거나 극단적인 델타 값을 사용해 반전을 예측하고자 한다면, 이 도구는 귀하의 거래 스타일에 완벽히 적응합니다. 단순히 거래하지 말고, FX Power 로 더 스마트하게 거래하세요. 1. FX Power가 거래자에게 매우 유용한 이유 통화와 금의 실시간 강세 분석 • FX Power 는 주요 통화와 금의 상대적 강세를 계산하고 표시하여 시장 역학에 대한 명확한 통찰력을 제공합니다. • 어떤 자산이 앞서고 있고 어떤 자산이 뒤처지는지 모니터링하여 보다 현명한 거래 결정을 내릴 수 있습니다. 포괄적인 멀티 타임프레임 뷰 • 단기, 중기 및 장기 타임프레임에서 통화와 금의 강세를
Currency Strength Dashboard Pro
Anastasia Danilova
5 (1)
Currency Strength Dashboard Pro MetaTrader 5 를 위한 실시간 통화 강도 분석 전문 대시보드 입니다. 이 지표는 8개의 주요 통화 (EUR, USD, GBP, JPY, CHF, AUD, CAD, NZD)의 강도를 계산하고, 28개의 통화쌍 을 동시에 여러 시간 프레임에서 분석하여 표시합니다. 이 대시보드는 트레이더가 추가 계산이나 여러 차트 간 전환 없이 한눈에 시장 전체 상황을 파악 할 수 있도록 해줍니다. 계산 방법 이 지표는 고급 수학적 통화 강도 분석 방법 을 기반으로 합니다. 이는 유사한 지표에서 널리 사용되는 RSI 기반 방법 보다 더 정확하고 객관적인 결과를 제공합니다. 이 방법은 28개의 모든 통화쌍 간의 관계를 동시에 분석 하여 시장에서 실제로 형성되는 힘의 균형을 보다 명확하고 편향 없이 보여줍니다. 실시간 대시보드 메인 테이블에는 8개의 통화 에 대한 전체 데이터가 표시됩니다. Rank (순위) — 전체 강도 기준 통화 순위, 1
CGE Trading Suite
Carl Gustav Johan Ekstrom
5 (1)
CGE Trading Suite delivers the analytical edge typically reserved for professional trading desks. The platform integrates a full suite of analytical tools into one seamless workflow: dynamic grid mapping, liquidity behavior analysis, ECM, trend lines, MIDAS, trade cycles, and directional channel projections. Together, these provide a unified view of market structure and momentum. Directional clarity is further enhanced by the capital flow index, which measures currency basket strength to identif
HFT Spike Detector
OMG FZE LLC
5 (2)
[ My Products ] , [ My Channel ]   ,  [ LIVE SIGNAL ] HFT Spike Detector HFT Spike Detector는 HFT로 인해 발생하는 급격한 가격 변동을 실시간으로 분석하고 측정하기 위해 개발된 전문적인 틱 모니터링 도구입니다. 목적은 브로커로 인해 발생하는 비정상적인 슬리피지, 유동성 공백 및 밀리초 단위 가격 스파이크를 수치 데이터로 감지할 수 있도록 하는 것입니다. 실시간 틱 흐름과 체결 조건을 분석하기 때문에 백테스트로는 정확하게 평가할 수 없습니다. 이 EA는 자동화를 위해 준비된 세트 파일과 함께 사용할 수 있도록 구매할 수 있습니다:  VolumeHedger EA 작동 원리 이 Expert Advisor는 들어오는 모든 틱을 실시간으로 분석하고: 가격 변화 속도 초당 틱 밀도 슬리피지 크기 같은 방향의 마이크로 흐름 측정하여 차트의 패널에 표시합니다. 이를 통해 스프레드를 제외한 실제 실행 품질을 확인할 수
ARIPoint
Temirlan Kdyrkhan
ARIPoint is a powerful trading companion designed to generate high-probability entry signals with dynamic TP/SL/DP levels based on volatility. Built-in performance tracking shows win/loss stats, PP1/PP2 hits, and success rates all updated live. Key Features: Buy/Sell signals with adaptive volatility bands Real-time TP/SL/DP levels based on ATR Built-in MA Filter with optional ATR/StdDev volatility Performance stats panel (Success, Profit/Loss, PP1/PP2) Alerts via popup, sound, push, or email Cu
Trend Lines PRO MT5
Roman Podpora
5 (1)
트렌드 라인즈 프로       이 지표는 시장이 실제로 어떤 방향으로 전환되는지 파악하는 데 도움이 됩니다. 실제 추세 반전 지점과 주요 시장 참여자들이 다시 진입하는 지점을 보여줍니다. 보시다시피       BOS 라인       복잡한 설정이나 불필요한 노이즈 없이 더 높은 시간대의 추세 변화와 주요 레벨을 확인할 수 있습니다. 신호는 차트에 다시 그려지지 않고 캔들이 마감된 후에도 계속 표시됩니다. MT4 버전   -   RFI LEVELS PRO   표시기   와 결합 시 최대 잠재력을 발휘합니다. 지표가 보여주는 내용: 실제 변화       추세(BOS 라인) 한 번 신호가 나타나면 그 신호는 계속 유효합니다! 이는 신호를 발생시킨 후 변경될 수 있는 리페인팅 방식의 지표와 중요한 차이점입니다. 리페인팅 방식의 지표는 잠재적으로 자금 손실로 이어질 수 있습니다. 이제 더욱 높은 확률과 정확도로 시장에 진입할 수 있습니다. 또한 화살표가 나타난 후 목표가(익절)에 도달하거나
Berma Bands
Muhammad Elbermawi
5 (8)
Berma Bands(BBs) 지표는 시장 동향을 파악하고 이를 활용하려는 트레이더에게 귀중한 도구입니다. 가격과 BBs 간의 관계를 분석함으로써 트레이더는 시장이 추세 단계인지 범위 단계인지를 분별할 수 있습니다. 자세한 내용을 알아보려면 [ Berma Home Blog ]를 방문하세요. 버마 밴드는 세 개의 뚜렷한 선으로 구성되어 있습니다. 어퍼 버마 밴드, 미들 버마 밴드, 로어 버마 밴드입니다. 이 선들은 가격 주위에 그려져 전체 추세에 대한 가격 움직임을 시각적으로 표현합니다. 이 밴드들 사이의 거리는 변동성과 잠재적인 추세 반전에 대한 통찰력을 제공할 수 있습니다. 버마 밴드 라인이 각각에서 분리될 때, 그것은 종종 시장이 횡보 또는 범위 이동 기간에 접어들고 있음을 시사합니다. 이는 명확한 방향 편향이 없음을 나타냅니다. 트레이더는 이러한 기간 동안 추세를 파악하기 어려울 수 있으며 더 명확한 추세가 나타날 때까지 기다릴 수 있습니다. 버마 밴드 라인이 단일 라인으로
제작자의 제품 더 보기
Weis Wave Scouter Basic
Jean Carlos Martins Roso
5 (1)
Weis Wave Scouter Basic은 MetaTrader 5용으로 설계된 당사의 유명한 인디케이터의 기본 버전으로, Wyckoff 방법론과 VSA(Volume Spread Analysis) 개념을 쉽고 효율적으로 탐색하려는 트레이더를 위해 설계되었습니다. 볼륨 파동 읽기를 기반으로 하여 시장 움직임을 명확하게 식별할 수 있으며, Richard Wyckoff가 가르친 노력 대 결과 및 수요 공급 원칙에 중점을 둡니다. Weis Wave Scouter Basic을 사용하면 기본 색상 테마(Classic)로 상승 및 하락 파동을 직관적인 히스토그램으로 시각화할 수 있어 트렌드 및 반전 해석이 쉬워집니다. Brick Size 및 Volume Scale Factor와 같은 기본 조정을 지원하며, 틱 볼륨 또는 실제 볼륨을 사용할 수 있는 옵션을 제공하여 Forex, 주식, 암호화폐 등 다양한 시장에 적합합니다. 초보자나 간단한 도구를 원하는 트레이더에게 완벽한 Weis Wave Sco
FREE
WeisWaveScouter
Jean Carlos Martins Roso
WeisWaveScouter is a powerful and accurate indicator designed to help traders detect key market movements based on price and volume waves. Built for the MetaTrader 4 platform, WeisWaveScouter provides detailed analysis of bullish and bearish waves, as well as highlighting volume spikes, giving you a clear view of market conditions. Key Features: Bullish and Bearish Waves: Easily identify bullish and bearish movements with waves clearly differentiated by customizable colors. Volume Spikes: Det
EmaCloud
Jean Carlos Martins Roso
Get ready to trade with real strategy using EmaCloud — the indicator built for traders who demand clarity, speed, and smarter decisions. Map market trends with precision using moving-average clouds (EMA, SMA, SMMA, and LWMA) and spot directional shifts before the crowd. Customize your workspace with 8 tactical-inspired visual themes, from “Classic” mode to “Forest,” adapting the environment to your trading style. Receive clear buy and sell signals with complete alerts: chart arrows, pop-ups, pus
Volume Thermal Vision Basic
Jean Carlos Martins Roso
Volume Thermal Vision Basic은 널리 알려진 Volume Thermal Vision 지표의 간소화된 버전으로, 거래량 강도를 실용적이고 효율적으로 분석하려는 트레이더를 위해 설계되었습니다. 총 6가지 생생한 색상 수준을 제공하며, StealthMode, NightVision, FrostVision 모드를 통해 거래량 데이터를 명확하고 전략적으로 시각화할 수 있습니다. 이 인디케이터는 가볍고 직관적인 인터페이스로 초보자에게 이상적이며, 숙련된 트레이더의 분석 도구로도 매우 유용합니다. MQL5 Market에서 전체 버전으로 업그레이드하면, 고급 기능과 다양한 시각화 옵션을 통해 트레이딩 결정을 보다 효과적으로 내릴 수 있습니다. 거래 전략 최적화에 유용한 도구입니다.
FREE
MACD Crossfire
Jean Carlos Martins Roso
MACD Crossfire MACD-based indicator designed to help traders filter crossover signals using risk context, momentum, and volume. Instead of showing raw signals only, MACD Crossfire evaluates the quality of each setup and highlights when market conditions are not favorable for trading. What the indicator does Detects MACD crossovers Scores signal quality (0 to 5 stars) Measures market risk (0–100%) Shows whether momentum is gaining or losing strength Detects divergences between price and indi
FREE
Volume ThermalVision
Jean Carlos Martins Roso
Volume Thermal Vision - Advanced Volume Analysis for MetaTrader 4 Unlock the power of volume analysis with Volume Thermal Vision, a sophisticated indicator designed to enhance your trading decisions. Developed by Jean Roso, this tool provides a dynamic visualization of volume intensity through a customizable heatmap, empowering traders to identify market trends and potential reversals with precision. Key Features: Multi-Protocol Visualization: Choose from five distinct protocols—Tactical, Steal
Volume Thermal Vision
Jean Carlos Martins Roso
Volume Thermal Vision으로 볼륨의 힘을 경험하세요 트레이딩을 한 단계 업그레이드할 준비가 되셨나요? MetaTrader 5용 궁극의 볼륨 지표인 Volume Thermal Vision을 소개합니다. 볼륨 분석을 전략적 우위로 전환시켜 주는 이 지표는 높은 확률의 기회를 식별하려는 트레이더를 위해 개발되었으며, VSA(Volume Spread Analysis), ICT(Inner Circle Trader), SMC(Smart Money Concepts), Wyckoff 등 방법론에 최적화되어 EURUSD, GBPUSD, US30 등 페어의 시장 행동을 해독하는 데 도움을 줍니다. 왜 Volume Thermal Vision인가? 고급 볼륨 분석: 12단계 컬러 레벨로 볼륨 강도를 시각화하여 축적, 분배 및 기관 움직임을 명확하게 식별합니다. 독점 시각 프로토콜: Tactical, StealthMode, ThermalVision, NightVision 4가지 모드를 선택해
Weis Wave Scouter
Jean Carlos Martins Roso
Weis Wave Scouter는 MetaTrader 5용으로 개발된 혁신적인 지표로, Wyckoff 방법론과 VSA(Volume Spread Analysis)의 검증된 원칙을 결합했습니다. 높은 정확성과 깊이 있는 분석을 원하는 트레이더를 위해 설계되었으며, 누적 거래량 파동 분석을 통해 시장을 전술적으로 읽고 추세 반전 및 지속의 핵심 포인트를 식별하는 데 도움을 줍니다. 이 지표는 선명한 시각적 인터페이스를 제공하며, Classic, NightVision, OceanBreeze 등 다양한 테마의 사용자 지정 가능한 색상 히스토그램을 통해 상승 및 하락 파동을 시각화합니다. 주요 기능에는 거래량 급증 감지, 낮은 활동 영역(DeadZone) 식별, 거래량 기반 파동 반전 경고 설정이 포함되어 있습니다. 또한 노력 대비 결과 분석, 원인과 결과 분석, 수요와 공급 분석 등 Wyckoff 및 VSA 이론의 핵심 요소를 지원합니다. Brick Size, Volume Scale Fact
Result Wave Recon
Jean Carlos Martins Roso
Result Wave Recon Indicator Description Overview The Result Wave Recon indicator for MetaTrader 5 (MT5) is a sophisticated technical analysis tool designed to visualize accumulated price movements in the form of waves, combined with volume peak analysis. It offers customizable visual themes to suit various trading styles and preferences, making it a versatile addition to any trader's toolkit. The indicator plots bullish and bearish waves as histograms in a separate window, with volume peaks hig
필터:
리뷰 없음
리뷰 답변