Volume ThermalVision

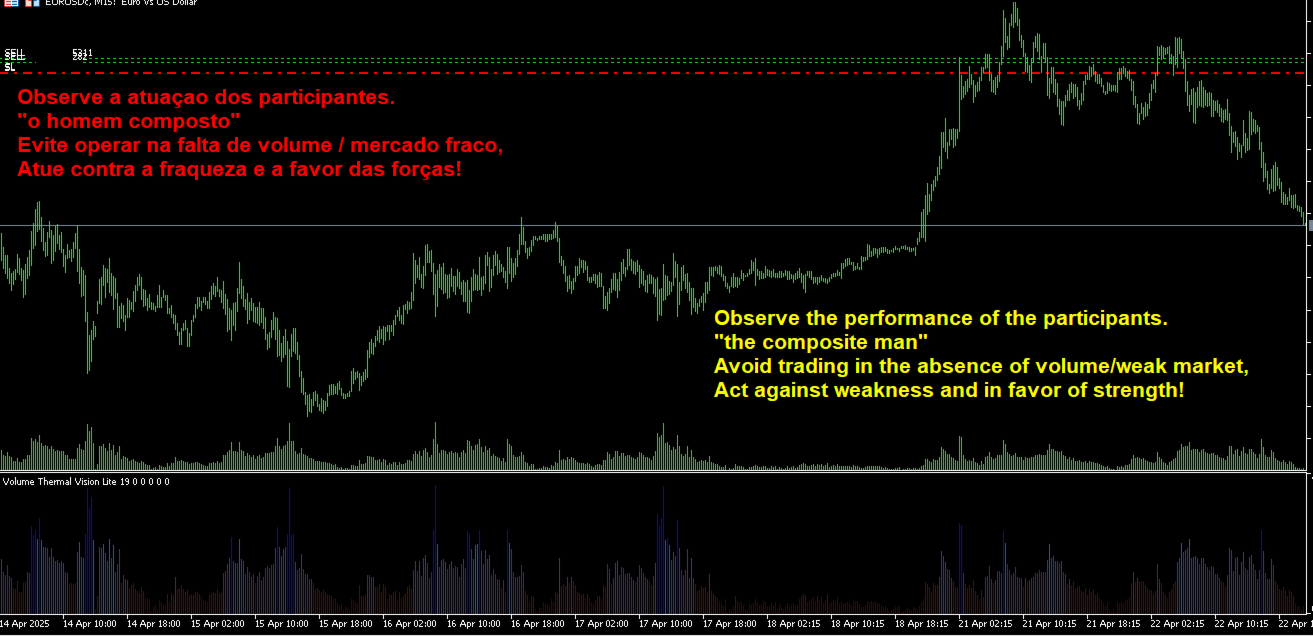
Volume Thermal Vision - Advanced Volume Analysis for MetaTrader 4

Unlock the power of volume analysis with Volume Thermal Vision, a sophisticated indicator designed to enhance your trading decisions. Developed by Jean Roso, this tool provides a dynamic visualization of volume intensity through a customizable heatmap, empowering traders to identify market trends and potential reversals with precision.

Key Features:

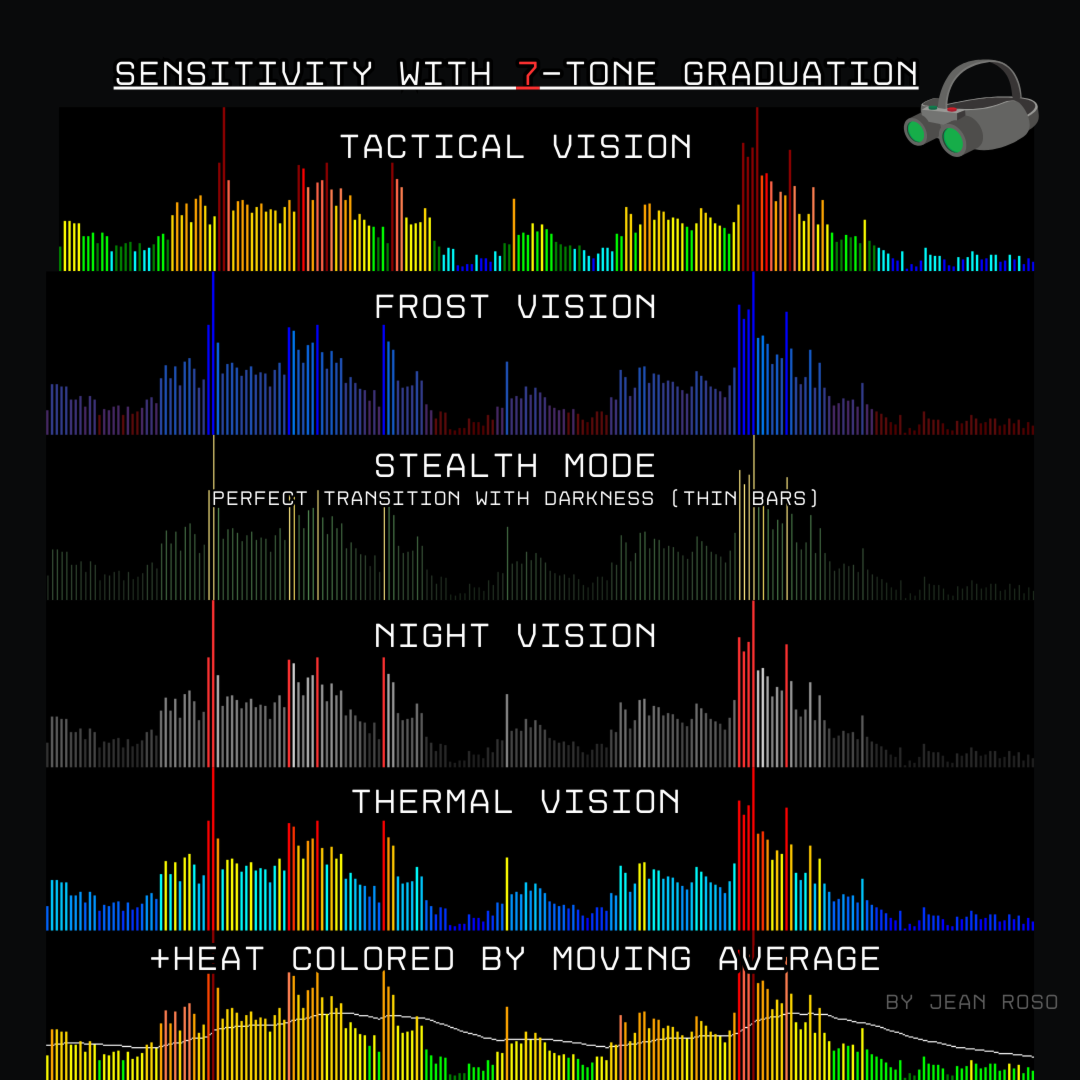
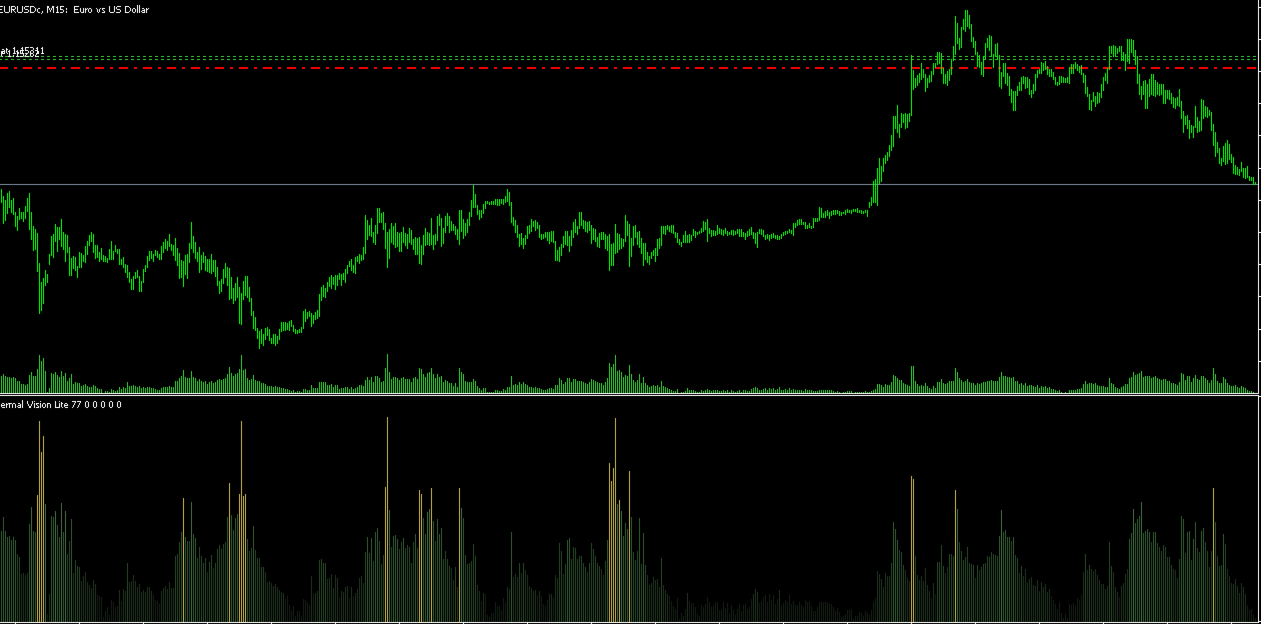
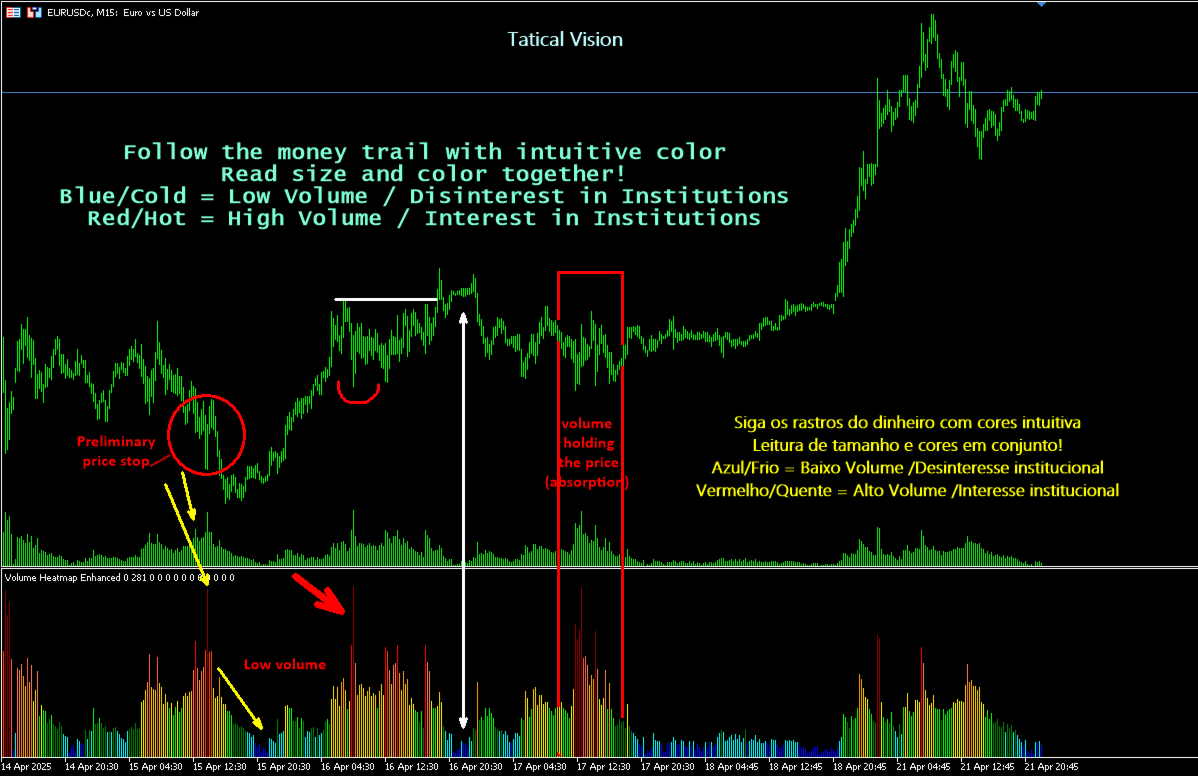
  • Multi-Protocol Visualization: Choose from five distinct protocols—Tactical, StealthMode, ThermalVision, NightVision, and FrostVision—to adapt the indicator's color scheme to your preferred style. Each protocol offers a unique gradient to highlight volume intensity, from subtle dark tones to vibrant thermal scales.
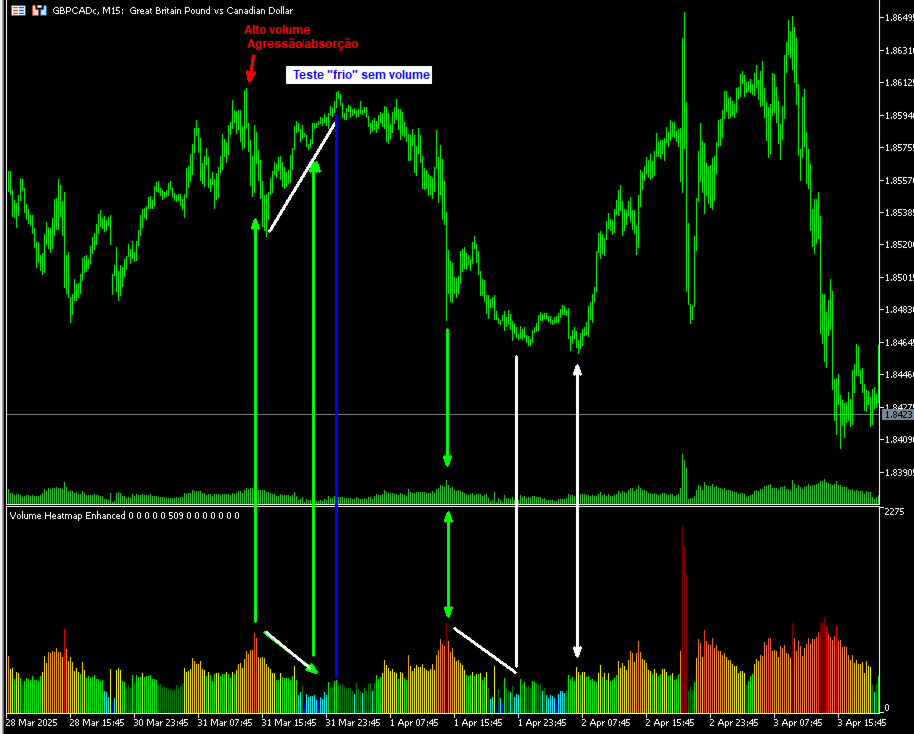
  • Volume Heatmap with Eight Levels: The indicator categorizes volume into eight distinct levels, each represented by a different color, allowing you to quickly assess market activity. From low to high volume, the gradient provides an intuitive understanding of market dynamics.
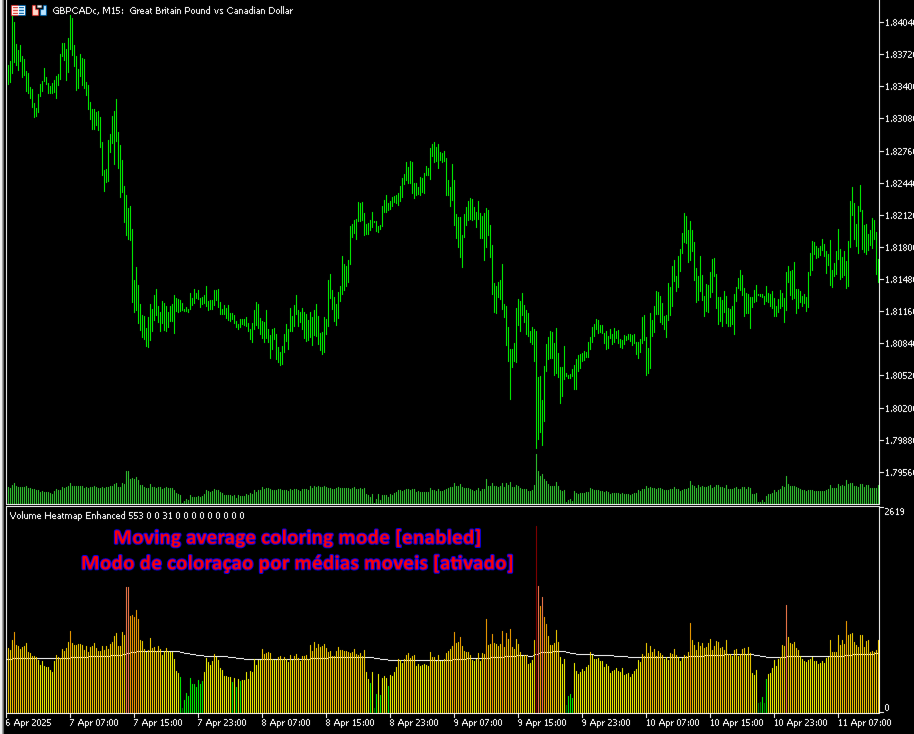
  • EMA Integration: Enable the Exponential Moving Average (EMA) scan to smooth volume data and detect significant deviations. Optionally deploy the EMA as a visual overlay with customizable width and color for deeper trend analysis.
  • Red Alert System: Activate the Red Alert feature to receive notifications when volume exceeds a user-defined threshold, ensuring you never miss critical market movements.
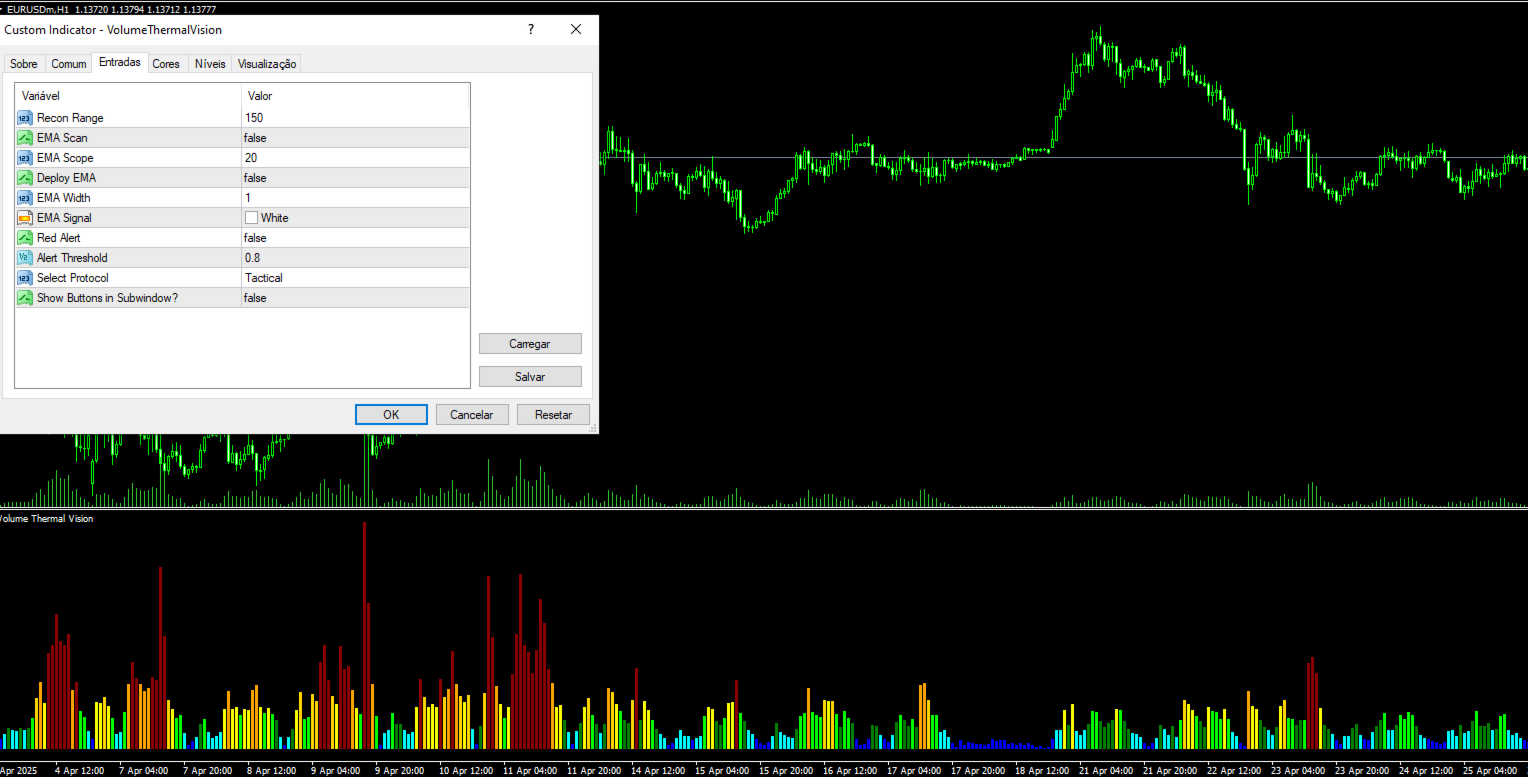
  • Interactive Controls: Display on-chart buttons to dynamically adjust the Recon Range and EMA Scope, providing real-time control over the indicator's sensitivity without needing to reopen the settings.
  • Customizable Appearance: Fine-tune the indicator to your preferences with adjustable parameters, including Recon Range, EMA settings, and alert thresholds, ensuring it aligns perfectly with your trading strategy.

Why Choose Volume Thermal Vision?

Volume Thermal Vision is designed for traders who demand precision and flexibility. Whether you're a scalper, day trader, or long-term investor, this indicator offers actionable insights into market volume, helping you anticipate price movements with confidence. Its advanced features, combined with an intuitive interface, make it an essential tool for any MetaTrader 4 user.

Contact Information:

For support or inquiries, please reach out to Jean Roso at jeantw7@gmail.com, or mensagem

Elevate your trading with Volume Thermal Vision—your ultimate companion for volume-based market analysis.


추천 제품
MT Scanner
Niravkumar Maganbhai Patel
4 (2)
This indicator helps you to Scan symbols which are in the Market Watch Window  and filter out trends with alerts. It works based on the effective indicator "SUPERTREND" which is used by many traders for trading: When box color changes to " Green " or " Red " color, it indicates you for trend change for long and short entry. And also you will get alerted on screen. When it changes to " Green ", it indicates you that trend is going upwards, and you can take the long entry. If the color changes to
FREE
MACD Scanner With Alerts
Niravkumar Maganbhai Patel
4 (2)
MACD Dashboard Panel   This indicator helps you to scan symbols which are in the Market Watch window and filter out a trend according to MACD. Moving Average Convergence Divergence (MACD) is a trend-following momentum indicator that shows the relationship between two moving averages of a security’s price. The MACD is calculated by subtracting the 26-period Exponential Moving Average (EMA) from the 12-period EMA. The result of that calculation is the MACD line. A nine-day EMA of the MACD called
FREE
RSI with Bands
Amirhossein Ghasemi Moroodi
7년의 개발 끝에 제가 개인적으로 만든 일부 지표와 전문가 어드바이저(EA)를 무료로 공개하기로 결정했습니다. 유용하다고 생각되면 5성급 평가로 지원해 주세요! 여러분의 피드백이 무료 도구를 계속 제공하는 원동력입니다. 저의 다른 무료 도구들도 여기 에서 확인해 보세요. _________________________________ "RSI 밴드" 지표 – 더 나은 거래 결정 "RSI 밴드" 지표는 클래식 RSI에 단순한 밴드를 결합하여 매수 또는 매도할 최적의 시기를 더 명확하게 보여줍니다. 시장에 진입하고 탈출하는 최적의 타이밍을 포착하는 데 도움을 주도록 설계되었습니다. 주요 혜택: 정밀한 과매수 & 과매도 분석 : 진정한 시장의 극단을 부각시켜 공통적인 가짜 신호의 함정을 피하는 밴드가 추가된 RSI를 향상시킵니다. 명확한 신호 : 가격이 너무 높거나 낮을 때 쉽게 볼 수 있어 거래 결정을 내릴 수 있습니다. 더 나은 타이밍 : 밴드는 기존
FREE
NIGHTCrusher Lite FREE
Christian Opperskalski
4.5 (2)
NIGHTCRUSHER is a fully automated expert advisor, designed for scalping on quite market situation. The Lite - Version is limited to minimal Lot per Pair and dont has lot mulitplier and dynamic function you can also run different strategies like swing trading or grid different Trade Entry Signals different Exit Strategies included (MA Cut / Signal Change / Trailing TP) clever Risk & Money management - Balance based - Longrun trades tracking You can also use a Grid function or Lot multipier, if ne
FREE
QuantumAlert Stoch Navigator is a free indicator available for MT4/MT5 platforms, its work is to provide "alerts" when the market is inside "overbought and oversold" regions in the form of "buy or sell" signals. This indicator comes with many customization options mentioned in the parameter section below, user can customise these parameters as needful. Join our   MQL5 group , where we share important news and updates. You are also welcome to join our private channel as well, contact me for the p
FREE
ATR Stops MTF
Marcio Jose Da Silva Pereira
ATR Stops MTF is a trend indicator based on ATR (Average True Range) that provides dynamic stop levels, helping traders identify the prevailing market direction and potential trend reversals. The indicator supports Multitimeframe (MTF) analysis, includes a moving average filter , and features an ON/OFF button directly on the chart for quick visual control. Main features Dynamic stops based on ATR Clear identification of the current trend Multitimeframe (MTF) support Configurable movin
FREE
Volume MA
Amirhossein Ghasemi Moroodi
After 7 years I decided to release some of my own indicators and EAs for free. If you find them useful please  Show support with a 5-star rating! Your feedback keeps the free tools coming! See other my free tools as well here _________________________________ Volume Moving Average (Volume MA) Indicator for Advanced Forex Market Analysis Introducing the Volume Moving Average (Volume MA) Indicator, meticulously developed in MQL4, a pivotal tool for enhancing your forex trading strat
FREE
QuantumAlert RSI Navigator is a free indicator available for MT4/MT5 platforms, its work is to provide "alerts" when the market is inside "overbought and oversold" regions in the form of "buy or sell" signals. This indicator comes with many customization options mentioned in the parameter section below, user can customise these parameters as needful. Join our   MQL5 group , where we share important news and updates. You are also welcome to join our private channel as well, contact me for the pri
FREE
Lisek Stochastic
Darius Hans Lischka
2.83 (6)
Lisek Stochastic   oscillator indicator with Alarm, Push Notifications and e-mail  Notifications. The Stochastic indicator is a momentum indicator that shows you how strong or weak the current trend is. It helps you identify overbought and oversold market conditions within a trend. The Stochastic indicator is lagging indicator, which means it don't predict where price is going, it is only providing data on where price has been !!! How to trade with Stochastic indicator: Trend following: As long
FREE
이 지표는 실제 거래에 완벽한 자동 파동 분석 지표입니다! 사례... 참고:   웨이브 그레이딩에 서양식 이름을 사용하는 데 익숙하지 않습니다. Tang Lun(Tang Zhong Shuo Zen)의 명명 규칙의 영향으로 기본 웨이브를   펜   으로 명명하고 2차 웨이브 밴드를   세그먼트   로 명명했습니다. 동시에, 세그먼트에는 추세 방향이 있습니다.   주요 추세 세그먼트에는   이름이 지정되지만(이 이름 지정 방법은 향후 노트에서 사용됩니다. 먼저 말씀드리겠습니다.) 알고리즘은 굴곡 이론과 거의 관련이 없으므로 그렇게 해서는 안 됩니다. 이는 나의 시장 분석을   통해 요약된 끊임없이 변화하고 복잡한 운영 규칙을   반영합니다. 밴드는 더 이상 사람마다 다르지 않도록 표준화되고 정의되었습니다. 인위적인 간섭의 드로잉 방법은 시장 진입을 엄격하게 분석하는 데 핵심적인 역할을 합니다. 이 지표를 사용하는 것은 거래 인터페이스의 미학을 개선하고 원래의 K-line 거래를
This Expert advisor does not do any trade, but it scans the whole symbols in your market watch and scan each shares one by one in different timeframes and at the end it shows you which symbol in which timeframe has a powerful engulfing candle. Furthermore, you can define a MA period and a high and low RSI limit, and it shows you which symbols in which timeframe is going to cross the adjusted moving average, and which symbol in which timeframe is going to cross high or low limit of the RSI.  The
FREE
High Low Open Close MT4
Alexandre Borela
4.81 (21)
이 프로젝트를 좋아한다면 5 스타 리뷰를 남겨주세요. 이 지표는 열리고, 높은, 낮은 및 마감 가격을 지정합니다. 기간과 그것은 특정한 시간대를 위해 조정될 수 있습니다. 이들은 많은 기관 및 전문가에 의해 보는 중요한 수준입니다 상인은 당신이 더 많은 것일 수있는 장소를 알고 도움이 될 수 있습니다 이름 * 사용 가능한 기간: 이전 날. 이전 주. 지난 달. 이전 분기. 이전 연도. 또는: 현재 날. 현재 주. 현재 달. 현재 분기. 현재 년.
FREE
** I am currently providing this great EA for free in a limit time. Please download while it is still free ** Tired of emotional trading decisions? Live monitor: TBD Introducing our mql4 Expert Advisor , engineered for stable profit with acceptable risk using a genuinely intelligent Dollar-Cost Averaging (DCA) method. This isn't just another EA; it's a long-time tested solution designed to navigate the forex markets with precision. Whether you trade with a standard USD account or a Cent ac
FREE
RexIIIClaw vs ClusterIIIEA
Niklas Templin
4.75 (4)
THE_____ IIIREX_CLAW_vs_CLUSTER_EAIII______ Set1: Price Offset 100, Stopp Loss 100-1000, Take Profit 2000  Set2: Price Offset 200, Stopp Loss 100-1000, Take Profit 2000 Set3: Price Offset 100, Stopp Loss 100-1000, Take Profit 1000 Set4: Price Offset 200, Stopp Loss 100-1000,  Take Profit 1000 Set5: PriceOffset 100-1000 (Recomment 200) higher is lower Risk, Stopp Loss  500  Take Profit  1000, 2000, or 3000 it is the same Target Set it to your Moneymanagement  Indize: DE40  “IC Market” Recomment
FREE
1.Determine the trend size based on the chart cycle.   An uptrend near the highest price in a period of time.   A trend down near the lowest price in a period of time. 2.   short-term trends.   Oversold and long;   Overbought, short. 3. Unwind positions based on overbought and oversold and profit points. real-time signal: https://www.mql5.com/zh/signals/1538661?source=Site+Signals+My EA Settings: You need to load EA into the currency pair to trade (M15 time range). The best performing symbol : E
Mr Beast Cross Distance
Luis Mariano Vazquez Marcos
MR BEAST 3 MA CROSS DISTANCE RECOMENDED EUR USD TIMEFRAME H1 Este robot de trading de Forex ha sido desarrollado por MRBEAST como una herramienta para facilitar el trading intradía. Tenga en cuenta que el uso de este robot implica ciertos riesgos y no garantiza ganancias consistentes en el mercado de divisas. El robot de trading se basa en algoritmos y estrategias que he diseñado, los cuales se han creado utilizando mi conocimiento y experiencia en el campo del trading. Sin embargo, el rendimien
The indicator allows you to trade binary options. The recommended time frame is М1 and the expiration time is 1,2,3 minutes. The indicator suitable for auto and manual trading. A possible signal is specified as a arrows above/under a candle. You should wait until the candle closes! Arrows are not re-painted Trade sessions: TOKYO section (Half-end) Currency pairs: USD/JPY Working time frame: M1 Expiration time: 1,2,3 minutes. The indicator also shows good results when using the martingale strateg
FREE
Session Kill zones with panel for quick changes. Asia Killzone London Killzone New York Killzone London Close Killzone In this indicator GMT+2 timings are used that are most common among many brokers. read the image attached in the screenshots to know more about sessions adjustments Session timings can be changed according to your broker timings and day light savings. Thank you :) Always open to feedback and criticism if it helps me provide you more value. - Rahul  My other indicators you may l
Email Drawdown Alert
Roman Starostin
5 (12)
Free informative Indicator-helper. It'll be usefull for traders who trade many symbols or using grid systems (Averaging or Martingale). Indicator counts drawdown as percent and currency separate. It has a number of settings: Count deposite drawdown according equity value and send e-mail or notifications to user if DD more than set; Sending e-mail when max open orders reached; Shows price and remaining pips amount before MarginCall on current chart and Account generally; Display summary trade lot
FREE
The new update makes this indicator a complete tool for studying, analyzing and operating probabilistic patterns. It includes: On-chart Multi-asset percentage monitor. Configurable martingales. Twenty-one pre-configured patterns , including Mhi patterns and C3. An advanced pattern editor to store up to 5 custom patterns. Backtest mode to test results with loss reports. Trend filter. Hit operational filter. Martingale Cycles option. Various types of strategies and alerts. Confluence between patte
Rira VWAP Bands
Vitor Palmeira Abbehusen
VWAP Bands gives you the regular Volume-Weighted Average Price and also the deviation bands. Use this indicator to see the possible amount of market movement, find support and resistance lines, find good spots for entry and exit,  and the most important feature is to find possible pivot points. This indicator has been mathematically improved by Rira team. The calculation begins at the start of each trading day
Extremum Reverse Bar
Yurij Izyumov
2.8 (5)
This indicator has been created for finding the probable reversal points of the symbol price. A small candlestick reversal pattern is used it its operation in conjunction with a filter of extremums. The indicator is not redrawn! If the extremum filter is disabled, the indicator shows all points that have a pattern. If the extremum filter is enabled, the condition works – if the history Previous bars 1 candles back contains higher candles and they are farther than the Previous bars 2 candle, such
FREE
Smart Market Analyser
Elias Mtwenge
5 (1)
REMINDER: Early buyers hot price discount: Price subject to rise after first 20 copies. Starting price $65 and final price will be $1275. Secure your discounted copy Now! Smart Money Analyser Indicator User Manual 1. Introduction Welcome to the   Smart Money Analyser Indicator This powerful tool provides traders with comprehensive market analysis by combining various technical indicators to generate actionable trading signals. Designed to be user-friendly, this indicator helps traders of all
Indicator is used for: defining price probability distributions. This allows for a detailed representation of the channel and its borders and forecast the probability of a price appearing at each segment of its fluctuations; defining the channel change moment.   Operation principles and features Indicator analyzes a quote history on lower timeframes and calculates a price probability distribution on higher ones. Forecast algorithms allow the indicator to calculate probability distributions and m
Hydra Trend Rider
INTRAQUOTES
5 (4)
Hydra Trend Rider is a non-repainting, multi-timeframe trend indicator that delivers precise buy/sell signals and real-time alerts for high-probability trade setups. With its color-coded trend line, customizable dashboard, and mobile notifications, it's perfect for traders seeking clarity, confidence, and consistency in trend trading. Setup & Guide:  Download  MT5 Version here. To learn how to use the Indicator: Indicator Manual & Guide -   Read Here Exclusively for you: It's your chance to st
I speak in Hungarian. Magyarul beszélek benne. - You can find the indicator by my name. Which is in the picture and the video. On mql5.com.  " Utam MA High Low" - Megkeresheti az indikátort a nevemnél. Ami a képen és a videóban van. Az mql5.com-on.  " Utam MA High Low" Első felvétel. https://www.youtube.com/watch?v=YzmcyO50YdM&amp ;ab_channel=GyulaKlein (Első felvétel.   https://www.youtube.com/watch?v=FfqvT-i9TPk&feature=youtu.be Első felvétel. https://www.youtube.com/watch?v=MapbQrJ0uPU&t=
Voorloper MT4
Pradana Novan Rianto
4.5 (18)
Voorloper Expert Advisor: Revolutionizing Trading with DDR System Introducing Voorloper, an innovative Expert Advisor that blends Moving Average (MA) and Relative Strength Index (RSI) indicators to redefine your trading experience. Voorloper stands out from the crowd with its unique feature: the Drawdown Reduction (DDR) System. Key Features: MA and RSI Integration:   Voorloper utilizes a powerful combination of Moving Average and Relative Strength Index indicators to identify optimal entry and
FREE
Middle Volume
Stefan Stoyanov
3.5 (2)
The indicator measures volumes on different charts and instruments. Its main advantage is the ability to compare separate brokers. The less Middle Volume and Tick / Second , the more reliable is the broker. There is a comment in the upper left corner Comment data: Tick/Second — number of ticks per second for a selected instrument Middle Volume — average volumes in the penultimate bar This indicator allows tracking a relative market activity for different timeframes. If the volumes are lower than
FREE
Cleopatra EA
Nestor Alejandro Chiariello
5 (1)
안녕하세요 트레이더 여러분! EA는 3.5년 동안 낮은 손실률로 안정적인 거래를 한 라이브 실적을 보유하고 있습니다. 라이브 공연 MT4 버전은 여기에서 찾을 수 있습니다. "클레오파트라 EA" 전략을 제시합니다. 클레오파트라는 아름답고 지능적인 디자인으로, 그 힘이 다재다능한 곳에서 지속적으로 적응하는 회복 형태를 가지고 있습니다. 그것의 주요 전략은 탄력성으로 시장을 읽는 것입니다. 우리는 진입 범위를 다양한 방식으로 분석할 수 있을 것입니다. 이는 시장 뉴스에 대한 쿼리 처리와 함께 다양한 tf 및 다양한 범위에서와 같이 매우 역동적일 수 있습니다. 클레오파트라는 시장 회복에 적응할 수 있는 큰 힘을 가지고 있으며, 그녀의 패턴은 고정되어 있지 않으며, 특정 계정이나 mff 등의 규칙에 따라 작업할 수 있도록 백분율 또는 변동 여부에 관계없이 다양한 유형의 보호 기능도 있습니다. EURUSD에 최적화되어 있지만 전체 시장을 다룰 수 있으므로 필요한 시장에 적응시키는 문
Long Waiting MT4
Aleksandr Davydov
Expert description Algorithm optimized for Nasdaq trading The Expert Advisor is based on the constant maintenance of long positions with daily profit taking, if there is any, and temporary interruption of work during the implementation of prolonged corrections The Expert Advisor's trading principle is based on the historical volatility of the traded asset. The values of the Correction Size (InpMaxMinusForMarginCallShort) and Maximum Fall (InpMaxMinusForMarginCallLong) are set manually. Recomme
FREE
이 제품의 구매자들이 또한 구매함
Smc Blast Signal
Mohit Dhariwal
5 (4)
NEW YEAR 2026 SALE OFFER PRICE AT JUST 99 DOLLARS FEW COPIES ONLY AT This price From 10th Jan -20th Jan MIDNIGHT Final offer GRAB YOUR COPY ON THIS New Year EVE Prices will be increased to 150 after the offer period ends Full Fledged EA and Alert plus for alerts will also be provided in this offer along with the purchase of Indicator. Limited copies only at this price and Ea too. Grab your copy soon Alert plus for indicator with set file is kept in comment section with the image  SMC Blast Signa
현재 20% 할인 ! 초보자 또는 전문가 트레이더를 위한 최고의 솔루션! 이 대시보드 소프트웨어는 28개의 통화 쌍에서 작동합니다. 2가지 주요 지표(Advanced Currency Strength 28 및 Advanced Currency Impulse)를 기반으로 합니다. 전체 Forex 시장에 대한 훌륭한 개요를 제공합니다. 고급 통화 강도 값, 통화 이동 속도 및 모든(9) 시간대의 28 Forex 쌍에 대한 신호를 보여줍니다. 추세 및/또는 스캘핑 기회를 정확히 파악하기 위해 차트의 단일 지표를 사용하여 전체 시장을 볼 수 있을 때 거래가 어떻게 개선될지 상상해 보십시오! 잠재적인 거래를 식별하고 확인하면서 강력한 통화와 약한 통화를 더욱 쉽게 식별할 수 있도록 이 지표에 기능을 내장했습니다. 이 표시기는 통화의 강세 또는 약세가 증가 또는 감소하는지 여부와 모든 시간대에서 수행되는 방식을 그래픽으로 보여줍니다. 추가된 새로운 기능은 현재 시장 조건 변화에 적응하는
Scalper Inside PRO
Alexey Minkov
4.74 (69)
An exclusive indicator that utilizes an innovative algorithm to swiftly and accurately determine the market trend. The indicator automatically calculates opening, closing, and profit levels, providing detailed trading statistics. With these features, you can choose the most appropriate trading instrument for the current market conditions. Additionally, you can easily integrate your own arrow indicators into Scalper Inside Pro to quickly evaluate their statistics and profitability. Scalper Inside
GOLD Impulse with Alert
Bernhard Schweigert
4.64 (11)
이 지표는 Advanced Currency IMPULSE with ALERT  +   Currency Strength Exotics  의 2가지 제품의 슈퍼 조합입니다. 그것은 모든 시간 프레임에 대해 작동하며 8개의 주요 통화와 하나의 기호에 대한 강약의 충동을 그래픽으로 보여줍니다! 이 표시기는 금, 이국적인 쌍, 상품, 지수 또는 선물과 같은 기호에 대한 통화 강도 가속을 표시하는 데 특화되어 있습니다. 금, 은, 오일, DAX, US30, MXN, TRY, CNH 등의 진정한 통화 강도 가속(충동 또는 속도)을 표시하기 위해 9번째 줄에 모든 기호를 추가할 수 있습니다. 새로운 기본 알고리즘을 기반으로 구축되어 잠재적인 거래를 훨씬 더 쉽게 식별하고 확인할 수 있습니다. 이는 통화의 강세 또는 약세가 가속되는지 여부를 그래픽으로 표시하고 가속 속도를 측정하기 때문입니다. 자동차의 속도계처럼 생각하면 됩니다. 가속화할 때 Forex 시장에서 동일한 일이 분명히 더 빠르
Volatility Trend System - a trading system that gives signals for entries. The volatility system gives linear and point signals in the direction of the trend, as well as signals to exit it, without redrawing and delays. The trend indicator monitors the direction of the medium-term trend, shows the direction and its change. The signal indicator is based on changes in volatility and shows market entries. The indicator is equipped with several types of alerts. Can be applied to various trading ins
Currency Strength Exotics
Bernhard Schweigert
4.88 (33)
현재 20% 할인! 초보자 또는 전문가 트레이더를 위한 최고의 솔루션! 이 표시기는 Exotic Pairs Commodities, Indexes 또는 Futures와 같은 기호에 대한 통화 강도를 표시하는 데 특화되어 있습니다. 금, 은, 석유, DAX, US30, MXN, TRY, CNH 등의 진정한 통화 강도를 보여주기 위해 9번째 줄에 모든 기호를 추가할 수 있습니다. 이것은 독특하고 고품질이며 저렴한 거래 도구입니다. 우리는 많은 독점 기능과 새로운 공식을 통합했습니다. 새로운 추세 또는 스캘핑 기회의 정확한 트리거 포인트를 정확히 찾아낼 수 있기 때문에 거래가 어떻게 개선될지 상상해 보십시오. 사용 설명서: 여기를 클릭 https://www.mql5.com/en/blogs/post/708876 모든 시간대에 작동합니다. TREND를 빠르게 확인할 수 있습니다! 새로운 기본 알고리즘을 기반으로 설계되어 잠재적인 거래를 더욱 쉽게 식별하고 확인할 수 있습니다. 8개의
Miraculous Indicator – Gann Square of Nine 기반 100% 비리페인트 Forex 및 바이너리 도구 이 영상은 Miraculous Indicator 를 소개합니다. 이 지표는 Forex 및 바이너리 옵션 트레이더를 위해 특별히 개발된 매우 정확하고 강력한 트레이딩 도구입니다. 이 지표가 독특한 이유는 전설적인 **Gann Square of Nine(Gann 9의 사각형)**과 **Gann's Law of Vibration(Gann 진동의 법칙)**에 기반을 두고 있기 때문입니다. 이는 현대 트레이딩에서 가장 정밀한 예측 도구 중 하나로 손꼽힙니다. Miraculous Indicator는 완전히 비리페인트(non-repaint) 됩니다. 즉, 캔들이 마감된 후에도 신호가 변경되거나 사라지지 않습니다. 보이는 것이 곧 결과입니다. 이는 트레이더가 자신감을 가지고 거래에 진입하고 청산할 수 있는 신뢰할 수 있고 일관된 기반을 제공합니다. 주요 특징: Gann
Trend Lines PRO
Roman Podpora
5 (1)
트렌드 라인즈 프로       이 지표는 시장이 실제로 어떤 방향으로 전환되는지 파악하는 데 도움이 됩니다. 실제 추세 반전 지점과 주요 시장 참여자들이 다시 진입하는 지점을 보여줍니다. 보시다시피       BOS 라인       복잡한 설정이나 불필요한 노이즈 없이 더 높은 시간대의 추세 변화와 주요 레벨을 확인할 수 있습니다. 신호는 차트에 다시 그려지지 않고 캔들이 마감된 후에도 계속 표시됩니다. 지표가 보여주는 내용: 실제 변화       추세(BOS 라인) 한 번 신호가 나타나면 그 신호는 계속 유효합니다! 이는 신호를 발생시킨 후 변경될 수 있는 리페인팅 방식의 지표와 중요한 차이점입니다. 리페인팅 방식의 지표는 잠재적으로 자금 손실로 이어질 수 있습니다. 이제 더욱 높은 확률과 정확도로 시장에 진입할 수 있습니다. 또한 화살표가 나타난 후 목표가(익절)에 도달하거나 반전 신호가 나타날 때까지 캔들스틱 색상이 계속 바뀌는 기능도 있습니다. 반복 항목          
Dynamic Forex28 Navigator
Bernhard Schweigert
4.43 (7)
Dynamic Forex28 Navigator - 차세대 외환 거래 도구. 현재 49% 할인. Dynamic Forex28 Navigator는 오랫동안 인기 있는 지표의 진화형으로, 세 가지의 힘을 하나로 결합했습니다. 고급 통화 Strength28 지표(695개 리뷰) + 고급 통화 IMPULSE with ALERT(520개 리뷰) + CS28 콤보 신호(보너스). 지표에 대한 자세한 정보 https://www.mql5.com/en/blogs/post/758844 차세대 Strength 지표는 무엇을 제공합니까?  원래 지표에서 좋아했던 모든 것이 새로운 기능과 더 높은 정확도로 강화되었습니다. 주요 기능: 독점적인 통화 Strength 공식.  모든 시간대에 걸쳐 부드럽고 정확한 강도선. 추세와 정확한 진입을 식별하는 데 이상적입니다. 역동적인 시장 피보나치 수준(시장 피보나치).  이 지표에만 있는 고유한 기능. 가격 차트가 아닌 통화 강도에 피보나치가 적용됩니다.
Supply and Demand Dashboard PRO
Bernhard Schweigert
4.8 (20)
현재 20% 할인! 이 대시보드는 여러 기호와 최대 9개의 타임프레임에서 작동하는 매우 강력한 소프트웨어입니다. 주요 지표(최상의 리뷰: 고급 공급 수요)를 기반으로 합니다.   Advanced Supply Demand 대시보드는 훌륭한 개요를 제공합니다. 다음과 같이 표시됩니다.  영역 강도 등급을 포함하여 필터링된 공급 및 수요 값, 영역에 대한/및 영역 내 Pips 거리, 중첩된 영역을 강조 표시하고 모든 (9) 시간 프레임에서 선택한 기호에 대해 4가지 종류의 경고를 제공합니다. 그것은 당신의 개인적인 필요에 맞게 고도로 구성 가능합니다! 당신의 혜택! 모든 트레이더에게 가장 중요한 질문: 시장에 진입하기에 가장 좋은 수준은 무엇입니까? 최고의 성공 기회와 위험/보상을 얻으려면 강력한 공급/수요 영역 내 또는 그 근처에서 거래를 시작하십시오. 손절매를 위한 최적의 장소는 어디입니까? 가장 안전하려면 강력한 수요/공급 구역 아래/위에 정류장을 두십시오.
Atomic Analyst
Issam Kassas
5 (3)
우선적으로 언급할 점은이 거래 지표가 다시 그리지 않고 지연되지 않으며 이를 통해 수동 및 로봇 거래 모두에 이상적이라는 점입니다. 사용자 매뉴얼: 설정, 입력 및 전략. Atomic Analyst는 가격의 강도와 모멘텀을 활용하여 시장에서 더 나은 이점을 찾는 PA Price Action Indicator입니다. 고급 필터를 장착하여 잡음과 거짓 신호를 제거하고 거래 잠재력을 높이는 데 도움이 됩니다. 복잡한 지표의 다중 레이어를 사용하여 Atomic Analyst는 차트를 스캔하고 복잡한 수학적 계산을 간단한 신호와 색상으로 변환하여 초보 트레이더가 이해하고 일관된 거래 결정을 내릴 수 있도록합니다. "Atomic Analyst"는 새로운 및 경험이 풍부한 트레이더를위한 종합적인 거래 솔루션입니다. 프리미엄 지표와 최고 수준의 기능을 하나의 거래 전략에 결합하여 모든 종류의 트레이더에 대한 다재다능한 선택지가되었습니다. 인트라데이 거래 및 스캘핑 전략 : 빠르고 정확한 일일
The Super Arrow Indicator provides non-repainting buy and sell signals with exceptional accuracy. Key Features No repainting – confirmed signals remain fixed Clear visual arrows: green for buy, red for sell Real-time alerts via pop-up, sound, and optional email Clean chart view with no unnecessary clutter Works on all markets: Forex, gold, oil, indices, crypto Adjustable Parameters TimeFrame Default: "current time frame" Function: Sets the time frame for indicator calculation Options: Can be set
Basic Harmonic Patterns Dashboard
Mehran Sepah Mansoor
5 (3)
이 대시보드는 선택한 심볼에 대해 사용 가능한 최신 고조파 패턴을 표시하므로 시간을 절약하고 더 효율적으로 사용할 수 있습니다 / MT5 버전 . 무료 인디케이터: Basic Harmonic Pattern 인디케이터 열 Symbol : 선택한 심볼이 나타납니다 Trend : 강세 또는 약세 Pattern : 패턴 유형(가틀리, 나비, 박쥐, 게, 상어, 사이퍼 또는 ABCD) Entry : 진입 가격 SL: 스톱로스 가격 TP1: 1차 테이크프로핏 가격 TP2: 2차 테이크프로핏 가격 TP3: 3차 테이크프로핏 가격 Current price: 현재 가격 Age (in bars): 마지막으로 그려진 패턴의 나이 주요 입력 Symbols : "28개 주요 통화쌍" 또는 "선택한 심볼" 중에서 선택합니다. Selected Symbols : 쉼표로 구분하여 모니터링하려는 원하는 심볼("EURUSD,GBPUSD,XAUUSD")을 선택합니다. 브로커에 쌍에 접미사 또는 접두사가 있는
F-16 비행기 지표를 소개합니다. 이것은 귀하의 거래 경험을 혁신하도록 설계된 최첨단 MT4 도구입니다. F-16 전투기의 비할 데 없는 속도와 정밀성에 영감을 받아이 지표는 고급 알고리즘과 최첨단 기술을 결합하여 금융 시장에서 압도적인 성능을 제공합니다. F-16 비행기 지표를 사용하면 실시간 분석을 제공하고 매우 정확한 거래 신호를 생성하여 경쟁을 앞서갈 수 있습니다. 다양한 자산 클래스에서 수익 기회를 식별하는 데 필요한 동적 기능을 갖추고 있어 확신을 가지고 정보에 근거한 결정을 내릴 수 있습니다. 사용자 친화적인 인터페이스로 구성된 F-16 비행기 지표는 인기있는 MetaTrader 4 플랫폼과 완벽하게 통합되어 원활하고 효율적인 거래 과정을 보장합니다. 초보자 트레이더든 경험 많은 전문가든 이 지표를 쉽게 사용자 정의하여 고유한 거래 스타일과 선호도에 맞출 수 있습니다. F-16 비행기 지표의 강력함을 경험해 보세요. 이 지표는 시장 트렌드를 정확하고 민첩하게 탐색하며
RFI levels PRO
Roman Podpora
사전 지표       시장 반전 수준과 영역을 파악하여   가격이 해당 수준으로 되돌아올 때까지 기다렸다가 새로운 추세의 시작점에서 진입할 수 있도록 해줍니다. 즉, 추세의 끝에서 진입하는 것이 아닙니다. 그는 보여준다       반전 수준       시장이 방향 전환을 확인하고 추가적인 움직임을 형성하는 지점입니다. 이 지표는 차트를 다시 그릴 필요 없이 작동하며, 모든 금융 상품에 최적화되어 있고, 특정 금융 상품과 함께 사용할 때 최대의 잠재력을 발휘합니다.       트렌드 라인즈 프로       지시자. 모든 계측기에 적용 가능한 가역 구조 스캐너 모든 거래 상품을 자동으로 추적하고 모든 R-반전 패턴을 즉시 식별하여 LOGIC AI 신호가 이미 존재하는 위치와 기타 유용한 정보를 표시합니다. 로직 AI – 진입점을 표시해주는 도우미 시장 진입에 가장 적합한 시점을 판단하는 지능형 신호입니다. TPSproSYSTEM 알고리즘을 사용하여 가격 변동, 추세 및 주요 시장 참
Friends, we present to your attention our new Forex Gump Laser indicator. Since there are no designers in our team, but mainly mathematicians, financiers, programmers and traders, we did not make any special changes in the indicator design. In appearance, it resembles the usual Forex Gump. On the other hand, Forex Gump has become not just the name of an indicator, it is a brand. And we try to preserve the corporate identity in all its varieties. The whole essence of the indicator in its operatio
Shogun Trade
Yuki Miyake
5 (1)
SHOGUN Trade - Strategic Market Structure & Multi-Timeframe Dashboard Concept: The Commander’s Perspective In the battlefield of trading, getting lost in localized price fluctuations (noise) is the most significant risk to capital. SHOGUN Trade is engineered to elevate a trader's perspective from "reactive" to "strategic," providing a comprehensive overview of market structures across multiple time horizons. This system monitors seven timeframes (M1 to D1) simultaneously, quantifying market m
Gold Channel XAUUSD
Paulo Rocha
5 (4)
Gold Channel is a volatility-based indicator, developed with a specific timing algorithm for the XAUUSD pair, which consists of finding possible corrections in the market. This indicator shows two outer lines, an inner line (retracement line) and an arrow sign, where the theory of the channel is to help identify overbought and oversold conditions in the market. The market price will generally fall between the boundaries of the channel. If prices touch or move outside the channel it is a tradi
Adaptive Volatility Range
Stanislav Konin
5 (3)
Adaptive Volatility Range [AVR] is a powerful tool for identifying key trend reversal points. AVR accurately reflects the Average True Range (ATR) of volatility, taking into account the Volume-Weighted Average Price (VWAP). The indicator adapts to any market volatility by calculating the average volatility over a specific period, ensuring a stable rate of profitable trades. You receive not just an indicator but a professional automated trading system , AVR-EA . Advantages: Automated Trading Sys
Entry Points Pro
Yury Orlov
4.6 (173)
다시 색을 칠하지 않고 거래에 진입할 수 있는 정확한 신호를 제공하는 MT4용 지표입니다. 외환, 암호화폐, 금속, 주식, 지수 등 모든 금융 자산에 적용할 수 있습니다. 매우 정확한 추정값을 제공하고 매수와 매도의 가장 좋은 시점을 알려줍니다. 하나의 시그널로 수익을 내는 지표의 예와 함께 비디오 (6:22)시청하십시오! 대부분의 거래자는 Entry Points Pro 지표의 도움으로 첫 거래 주 동안 트레이딩 결과를 개선합니다. 저희의   Telegram Group 을 구독하세요! Entry Points Pro 지표의 좋은점. 재도색이 없는 진입 신호 신호가 나타나고 확인되면(시그널 캔들이 완성된 경우) 신호는 더 이상 사라지지 않습니다. 여타 보조지표의 경우 신호를 표시한 다음 제거되기 때문에 큰 재정적 손실로 이어집니다. 오류 없는 거래 게시 알고리즘을 통해 트레이드(진입 또는 청산)를 할 이상적인 순간을 찾을 수 있으며, 이를 통해 이를 사용하는 모든 거래자의 성공률이
Hidden Cycles
Lev Vladimirovic Marushkin
5 (1)
The Only 100% Universal Tool! Stop trading against nature! This is your chance to secure the only indicator rooted in the absolute laws that govern the entire universe. Most tools guess—this one reveals the truth. Buy another toy or buy the truth. Your choice... Based on Universal Laws — NOT Some Guy’s Algorithm: Let the market adjust to the Hidden Cycles Geometry — not the other way around. Most indicators are based on a man-made formula. They often lag, fail over time, or need constant re-o
Quantum Trend Sniper Indicator MT4
Bogdan Ion Puscasu
4.69 (42)
소개       Quantum Trend Sniper Indicator는   추세 반전을 식별하고 거래하는 방식을 변화시키는 획기적인 MQL5 지표입니다! 13년 이상의 거래 경험을 가진 숙련된 트레이더 팀이 개발한       Quantum Trend Sniper 표시기       매우 높은 정확도로 추세 반전을 식별하는 혁신적인 방법으로 거래 여정을 새로운 차원으로 끌어올리도록 설계되었습니다. ***Quantum Trend Sniper Indicator를 구입하면 Quantum Breakout Indicator를 무료로 받을 수 있습니다!*** Quantum Trend Sniper Indicator는 추세 반전을 식별하고 세 가지 이익실현 수준을 제안할 때 경고, 신호 화살표를 제공합니다. 초보자 거래자와 전문 거래자 모두에게 적합합니다. Quantum EA 채널:       여기를 클릭하세요 MT5 버전:       여기를 클릭하세요 추천: 기간: 모든 기간
PROFESSIONAL FOOTPRINT CHART INDICATOR A Footprint Chart is an advanced order flow visualization tool that displays the volume traded at each price level within a candlestick. Unlike traditional candlestick charts that only show open, high, low, and close prices, footprint charts reveal the  battle between buyers and sellers  at every price level. KEY CONCEPT:   Footprint charts show WHERE volume occurred, not just HOW MUCH volume occurred. This is critical for understanding institutional activ
Quantum Breakout Indicator PRO
Bogdan Ion Puscasu
4.96 (26)
소개       Quantum Breakout PRO   , 브레이크아웃 존 거래 방식을 변화시키는 획기적인 MQL5 지표! 13년 이상의 거래 경험을 가진 숙련된 트레이더 팀이 개발한   Quantum Breakout PRO는   혁신적이고 역동적인 브레이크아웃 영역 전략으로 거래 여정을 새로운 차원으로 끌어올리도록 설계되었습니다. Quantum Breakout Indicator는 5개의 이익 목표 영역이 있는 브레이크아웃 영역의 신호 화살표와 브레이크아웃 상자를 기반으로 한 손절 제안을 제공합니다. 초보자 거래자와 전문 거래자 모두에게 적합합니다. Quantum EA 채널:       여기를 클릭하세요 MT5 버전 :   여기를 클릭하세요 중요한! 구매 후 설치 매뉴얼을 받으려면 개인 메시지를 보내주십시오. 추천: 기간: M15 통화쌍: GBPJPY, EURJPY, USDJPY,NZDUSD, XAUUSD 계정 유형: 스프레드가 매우 낮은 ECN, Raw 또는 Razo
이 지표를 구매하면 제 프로페셔널 트레이드 매니저를 무료로 드립니다. 우선 이 거래 시스템이 리페인팅, 리드로잉 및 레이그 인디케이터가 아니라는 점을 강조하는 것이 중요합니다. 이는 수동 및 로봇 거래 모두에 이상적인 것으로 만듭니다. 온라인 강좌, 설명서 및 프리셋 다운로드. "스마트 트렌드 트레이딩 시스템 MT5"은 새로운 및 경험이 풍부한 트레이더를 위해 맞춤형으로 제작된 종합적인 거래 솔루션입니다. 10개 이상의 프리미엄 인디케이터를 결합하고 7개 이상의 견고한 거래 전략을 특징으로 하여 다양한 시장 조건에 대한 다목적 선택이 가능합니다. 트렌드 추종 전략: 효과적인 트렌드 추이를 타기 위한 정확한 진입 및 손절 관리를 제공합니다. 반전 전략: 잠재적인 트렌드 반전을 식별하여 트레이더가 범위 시장을 활용할 수 있게 합니다. 스캘핑 전략: 빠르고 정확한 데이 트레이딩 및 단기 거래를 위해 설계되었습니다. 안정성: 모든 인디케이터가 리페인팅, 리드로잉 및 레이그가 아니므로 신뢰
OrderFlow Absorption – MT4용 전문 델타 & 흡수 신호 인디케이터 OrderFlow Absorption으로 진정한 오더플로우 분석의 힘을 경험하세요. MetaTrader 4를 위한 궁극의 델타 히스토그램 및 흡수 신호 인디케이터입니다. 가격 움직임의 이면에서 실제로 무슨 일이 일어나는지 알고 싶은 트레이더를 위해 설계된 이 도구는, 시장을 움직이는 숨겨진 매수/매도 압력과 흡수 이벤트를 드러냅니다. 주요 기능 델타 히스토그램 시각화:   매수와 매도 압력을 색상별 히스토그램으로 즉시 확인할 수 있습니다. 흡수 신호 감지:   고급 로직으로 강세 및 약세 흡수 이벤트를 식별하여 반전 신호를 미리 알려줍니다. 차트 마커:   흡수 신호가 차트에 직접 표시되어 시각적으로 쉽게 확인할 수 있습니다. 팝업 알림:   새로운 흡수 신호가 발생하면 실시간으로 알림을 받을 수 있습니다. 사용자 지정 임계값:   약한 신호는 필터링하고, 확률이 높은 기회에 집중할 수 있습니다.
추세 지표는 금융시장 거래에 사용되는 기술 분석 분야 중 하나입니다. Angular Trend Lines - 추세 방향을 종합적으로 판단하고 진입 신호를 생성합니다. 캔들의 평균 방향을 매끄럽게 하는 것 외에도 또한 추세선의 경사각도 사용합니다. 갠 각도를 구성하는 원리는 경사각의 기초로 사용되었습니다. 기술 분석 지표는 촛대 평활화와 차트 기하학을 결합한 것입니다. 트렌드 라인과 화살표에는 두 가지 유형이 있습니다. 강세 방향의 빨간색 선과 화살표. 약세 방향의 보라색 선과 화살표. 표시기 기능 이 지표는 사용하기 쉽고 매개변수를 구성할 수 있으며, 추세 분석과 주문 개시를 위한 신호 수신에 사용할 수 있습니다. 지표는 다시 그려지지 않고, 화살표는 캔들 마감 시점에 나타납니다. 신호가 발생하면 여러 유형의 알림을 제공합니다. 모든 금융 상품(외환, 암호화폐, 금속, 주식, 지수)에 사용할 수 있습니다. 해당 지표는 모든 시간 범위와 차트에서 작동할 수 있습니다. 이 지표는
Have you ever asked yourself why your supply and demand zones fail , even when everything looks “perfect”? The truth is, you're not wrong — you're just watching the reaction, not the reason. It's not like those random currency strength meters that rely on lagging indicators like RSI, CCI, or similar tools mashed together to guess strength or weakness. That approach reacts to the past — not the cause. Pairs like EURUSD or USDJPY are just the outcomes . The real drivers? Currency indices and inst
현재 26% 할인!! 이 지표는 두 주요 지표( Advanced Currency Strength 28   &  Advanced Currency IMPULSE with ALERT )의 슈퍼 조합입니다. TICK-UNITS에 대한 통화 강도 값과 28개 Forex 쌍에 대한 경고 신호를 보여줍니다. 11개의 다른 틱 단위를 사용할 수 있습니다. 1, 2, 3, 4, 5, 6, 10, 12, 15, 20, 30초입니다. 두 번째 타이머 내에 최소 1틱이 있으면 하위 창의 Tick-Unit 막대가 표시되고 왼쪽으로 이동합니다. 단 하나의 차트로 28 Forex 페어를 스캘핑할 수 있습니다! 스캘핑 기회의 정확한 트리거 포인트를 정확히 찾아낼 수 있기 때문에 스캘핑이 어떻게 개선될지 상상해 보십시오. 그것은 1분보다 낮은 기간에 작동하는 시장의 첫 번째 통화 강도 지표입니다! 그것은 시장에 빠르게 들어오고 나가고 시장에서 작은 핍을 잘라내기를 원하는 빠른 스캘퍼를 위한 것입니다. 사
유동성 충격 감지기 (XAUUSD 1분봉 버전) ====================================================== 간략 설명: ----------------------------------- 급격한 가격 변동으로 생성되는 기관 유동성 영역을 감지하고 다중 시간대 추세 분석을 제공합니다. 상세 설명: ----------------- 유동성 충격 감지기는 기관 활동을 나타내는 중요한 가격 변동을 식별합니다. 대규모 시장 참여자가 포지션을 진입하거나 청산할 때 가격이 자주 재진입하는 유동성 영역이 생성됩니다. 이 지표는 이러한 영역을 자동으로 감지하고 여러 시간대에 걸쳐 실시간 추세 분석을 제공합니다. 작동 방식 이 지표는 가격 변동 속도와 캔들 크기를 모니터링하여 급격한 움직임을 감지합니다. 중요한 변동이 발생하면 검증 기간을 통해 해당 영역이 유효한지 확인합니다. 검증된 영역은 차트에 명확한 시각적 표시와 함께 표시되어 영역의 강도와 방향을
제작자의 제품 더 보기
Weis Wave Scouter Basic
Jean Carlos Martins Roso
5 (1)
Weis Wave Scouter Basic은 MetaTrader 5용으로 설계된 당사의 유명한 인디케이터의 기본 버전으로, Wyckoff 방법론과 VSA(Volume Spread Analysis) 개념을 쉽고 효율적으로 탐색하려는 트레이더를 위해 설계되었습니다. 볼륨 파동 읽기를 기반으로 하여 시장 움직임을 명확하게 식별할 수 있으며, Richard Wyckoff가 가르친 노력 대 결과 및 수요 공급 원칙에 중점을 둡니다. Weis Wave Scouter Basic을 사용하면 기본 색상 테마(Classic)로 상승 및 하락 파동을 직관적인 히스토그램으로 시각화할 수 있어 트렌드 및 반전 해석이 쉬워집니다. Brick Size 및 Volume Scale Factor와 같은 기본 조정을 지원하며, 틱 볼륨 또는 실제 볼륨을 사용할 수 있는 옵션을 제공하여 Forex, 주식, 암호화폐 등 다양한 시장에 적합합니다. 초보자나 간단한 도구를 원하는 트레이더에게 완벽한 Weis Wave Sco
FREE
Volume Thermal Vision Basic
Jean Carlos Martins Roso
Volume Thermal Vision Basic은 널리 알려진 Volume Thermal Vision 지표의 간소화된 버전으로, 거래량 강도를 실용적이고 효율적으로 분석하려는 트레이더를 위해 설계되었습니다. 총 6가지 생생한 색상 수준을 제공하며, StealthMode, NightVision, FrostVision 모드를 통해 거래량 데이터를 명확하고 전략적으로 시각화할 수 있습니다. 이 인디케이터는 가볍고 직관적인 인터페이스로 초보자에게 이상적이며, 숙련된 트레이더의 분석 도구로도 매우 유용합니다. MQL5 Market에서 전체 버전으로 업그레이드하면, 고급 기능과 다양한 시각화 옵션을 통해 트레이딩 결정을 보다 효과적으로 내릴 수 있습니다. 거래 전략 최적화에 유용한 도구입니다.
FREE
WeisWaveScouter
Jean Carlos Martins Roso
WeisWaveScouter is a powerful and accurate indicator designed to help traders detect key market movements based on price and volume waves. Built for the MetaTrader 4 platform, WeisWaveScouter provides detailed analysis of bullish and bearish waves, as well as highlighting volume spikes, giving you a clear view of market conditions. Key Features: Bullish and Bearish Waves: Easily identify bullish and bearish movements with waves clearly differentiated by customizable colors. Volume Spikes: Det
Volume Thermal Vision
Jean Carlos Martins Roso
Volume Thermal Vision으로 볼륨의 힘을 경험하세요 트레이딩을 한 단계 업그레이드할 준비가 되셨나요? MetaTrader 5용 궁극의 볼륨 지표인 Volume Thermal Vision을 소개합니다. 볼륨 분석을 전략적 우위로 전환시켜 주는 이 지표는 높은 확률의 기회를 식별하려는 트레이더를 위해 개발되었으며, VSA(Volume Spread Analysis), ICT(Inner Circle Trader), SMC(Smart Money Concepts), Wyckoff 등 방법론에 최적화되어 EURUSD, GBPUSD, US30 등 페어의 시장 행동을 해독하는 데 도움을 줍니다. 왜 Volume Thermal Vision인가? 고급 볼륨 분석: 12단계 컬러 레벨로 볼륨 강도를 시각화하여 축적, 분배 및 기관 움직임을 명확하게 식별합니다. 독점 시각 프로토콜: Tactical, StealthMode, ThermalVision, NightVision 4가지 모드를 선택해
Weis Wave Scouter
Jean Carlos Martins Roso
Weis Wave Scouter는 MetaTrader 5용으로 개발된 혁신적인 지표로, Wyckoff 방법론과 VSA(Volume Spread Analysis)의 검증된 원칙을 결합했습니다. 높은 정확성과 깊이 있는 분석을 원하는 트레이더를 위해 설계되었으며, 누적 거래량 파동 분석을 통해 시장을 전술적으로 읽고 추세 반전 및 지속의 핵심 포인트를 식별하는 데 도움을 줍니다. 이 지표는 선명한 시각적 인터페이스를 제공하며, Classic, NightVision, OceanBreeze 등 다양한 테마의 사용자 지정 가능한 색상 히스토그램을 통해 상승 및 하락 파동을 시각화합니다. 주요 기능에는 거래량 급증 감지, 낮은 활동 영역(DeadZone) 식별, 거래량 기반 파동 반전 경고 설정이 포함되어 있습니다. 또한 노력 대비 결과 분석, 원인과 결과 분석, 수요와 공급 분석 등 Wyckoff 및 VSA 이론의 핵심 요소를 지원합니다. Brick Size, Volume Scale Fact
Result Wave Recon
Jean Carlos Martins Roso
Result Wave Recon Indicator Description Overview The Result Wave Recon indicator for MetaTrader 5 (MT5) is a sophisticated technical analysis tool designed to visualize accumulated price movements in the form of waves, combined with volume peak analysis. It offers customizable visual themes to suit various trading styles and preferences, making it a versatile addition to any trader's toolkit. The indicator plots bullish and bearish waves as histograms in a separate window, with volume peaks hig
필터:
리뷰 없음
리뷰 답변