Volatility Analytics Pro
- 지표
-
Pavel Malyshko
 나는 정직하고 매우 중요한 단어를 말하고 싶다:마지막 돈으로 거래하지 마십시오,이것은 매우 큰 스트레스이며,이 투자와 관련된 가장 중요한 규칙 중 하나입니다.
네가 나에게서 아무것도 사지 못하게 하라,그러나 나는 네가 마지막 돈을 주지 않는다는 것을 알게 될 것이다.
획기적인 거래 전략은 이미 진행 중이며 정기적으로 업데이트 될 것입니다. 놓치지 않기 위해,내 계정을 추적하고 친구를 추가 할 수 있습니다.
내 새로운 제품을 놓치지 않기 위해 내 전보를 구독하십시오. - 버전: 11.0
- 활성화: 20
The edge most traders ignore
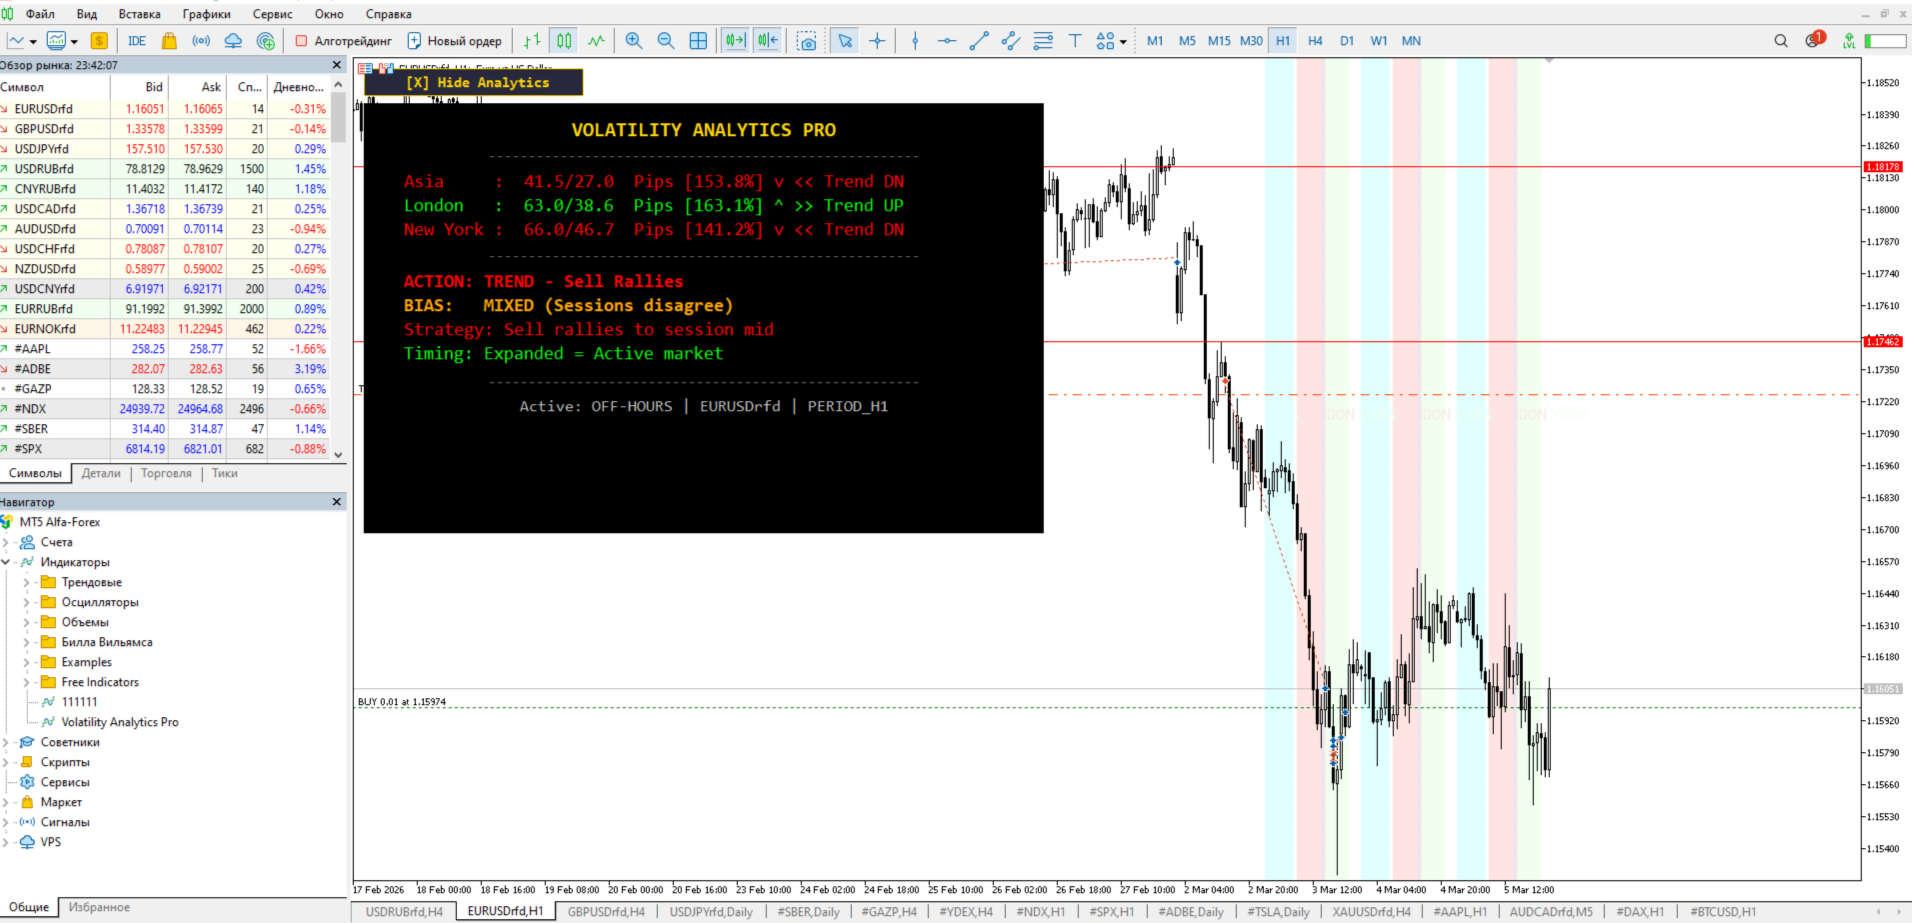
Every trading session has a measurable rhythm.For example Asia moves an average of 27 pips. London pushes 38. New York delivers 46. These numbers shift daily — and when they compress below 50% of their average, an explosive breakout follows within hours. This is not a theory. This is statistical mechanics applied to price.
Most traders stare at lagging indicators while the answer sits in the raw price data. Volatility Analytics Pro extracts this data in real time and tells you exactly what to do with it.
What this indicator actually does
It measures the current range of each trading session and compares it to the 20-day historical average. From this single calculation, it derives four actionable states:
Compression — current range is below 50% of average. The market is coiling. Energy is building. A directional breakout is statistically imminent. This is where pending orders above and below the range produce the highest reward-to-risk entries.
Normal — range sits between 50% and 120% of average. Standard price action setups apply. No special edge from volatility.
Expansion — range exceeds 120% of average. A trend is active. The indicator reads session direction (bullish or bearish) and tells you whether to buy pullbacks or sell rallies.
Overextension — range blows past 180% of average. The move is exhausted. Chasing here is how accounts blow up. The indicator warns you to wait for a reversal pattern instead.
What appears on your chart
A compact dashboard in the top-left corner displays three lines — one for each session. Each line shows:
- Current session range in pips
- Average range over the selected period
- Percentage of average consumed
- Direction arrow (bullish or bearish)
- State label (squeeze, normal, trending, overextended)
Below the data, four recommendation lines appear:
- Action — what to do right now (buy pullback, sell rally, wait, prepare for breakout)
- Bias — overall market direction based on session agreement
- Strategy — specific entry method for the current state
- Timing — why this moment matters statistically
The dashboard updates every minute. A toggle button lets you hide or show it with one click.
On the chart itself, colored vertical zones mark each session boundary. Dotted vertical lines mark exact start and end times. Text labels above the candles identify Asia, London, and New York at a glance. The last three days of sessions are drawn by default.
Alerts that matter
When compression appears in one or more sessions, the indicator fires a popup alert, plays a sound, and optionally sends a push notification to your phone. A cooldown timer prevents alert spam — by default, the same signal type will not repeat for one hour.
Overextension alerts work the same way. You get warned before exhaustion, not after.
Settings reference
Panel position
- X margin from left edge (default 10)
- Y margin from top edge (default 10)
Panel colors
- Board background, title, bullish, bearish, neutral, warning, context, and separator colors are all individually adjustable
Session hours (server time)
- Asia start/end (default 01:00–08:00)
- London start/end (default 09:00–16:00)
- New York start/end (default 15:00–22:00)
- Adjust these to match your broker’s server timezone
Analysis settings
- Average period in days (default 20) — how far back to calculate normal range
- Draw days (default 3) — how many days of session zones appear on the chart
- Compression threshold (default 50%) — below this percentage triggers squeeze state
- Expansion threshold (default 120%) — above this triggers trending state
- Overextension threshold (default 180%) — above this triggers exhaustion warning
Alerts
- Popup alert on/off
- Sound alert on/off
- Push notification on/off
- Cooldown between repeated alerts in seconds (default 3600)
Why this works when indicators fail
Moving averages, RSI, MACD — they all derive from price with a delay. By the time they signal, the move is half over.
Volatility Analytics Pro does not predict direction from a formula. It measures the physical energy state of the market. When a spring is compressed, you do not need an indicator to know it will expand. You need to know it is compressed. That is what this tool provides — the measurement that precedes the move.
The compression-to-breakout pattern has been documented in academic research on financial time series since the 1990s. Bollinger himself built his career on this principle. This indicator strips that concept to its mathematical core and applies it across three sessions simultaneously.
Who this is for
Scalpers who need to know when volatility is about to spike. Swing traders who want confirmation that a trend has room to run — or is about to reverse. Session traders who build their entire strategy around London open or New York overlap. Anyone who has been burned by entering a move that was already overextended.
Technical specifications
- Platform: MetaTrader 5
- Type: custom indicator (chart window)
- Dependencies: none — no external libraries, no DLLs, no other indicators
- Calculations: pure price mathematics — no volume data required
- Resource usage: minimal — updates once per minute, not every tick
- Compatibility: all forex pairs, metals, indices, crypto — any instrument with session-based activity