End Flow Momentum
- 지표
-
Nestor Jose Mendez Boza
 퀀트 트레이딩 시스템 디자이너 및 시계열 분석 연구원
저는 알고리즘 트레이딩 시스템의 연구와 개발에 지난 7년간 헌신해온 다학제적 개인입니다. 고급 수학, 데이터 과학, 그리고 혁신적인 시장 분석 접근법을 융합하여 국제적인 경쟁 환경에서 구체적인 성과를 달성해왔습니다.
주요 성과:
Robotrader 2023 (Interactive Brokers): Python 전략으로 3위 수상
Robotrader 2025 (Darwinex): MQL5 및 적응형 위험 관리 기술로 3위 수상 - 버전: 3.0
- 업데이트됨: 13 8월 2026
- 활성화: 10
END FLOW MOMENTUM
Capital Flow Analysis with a Geometric Approach
Overview
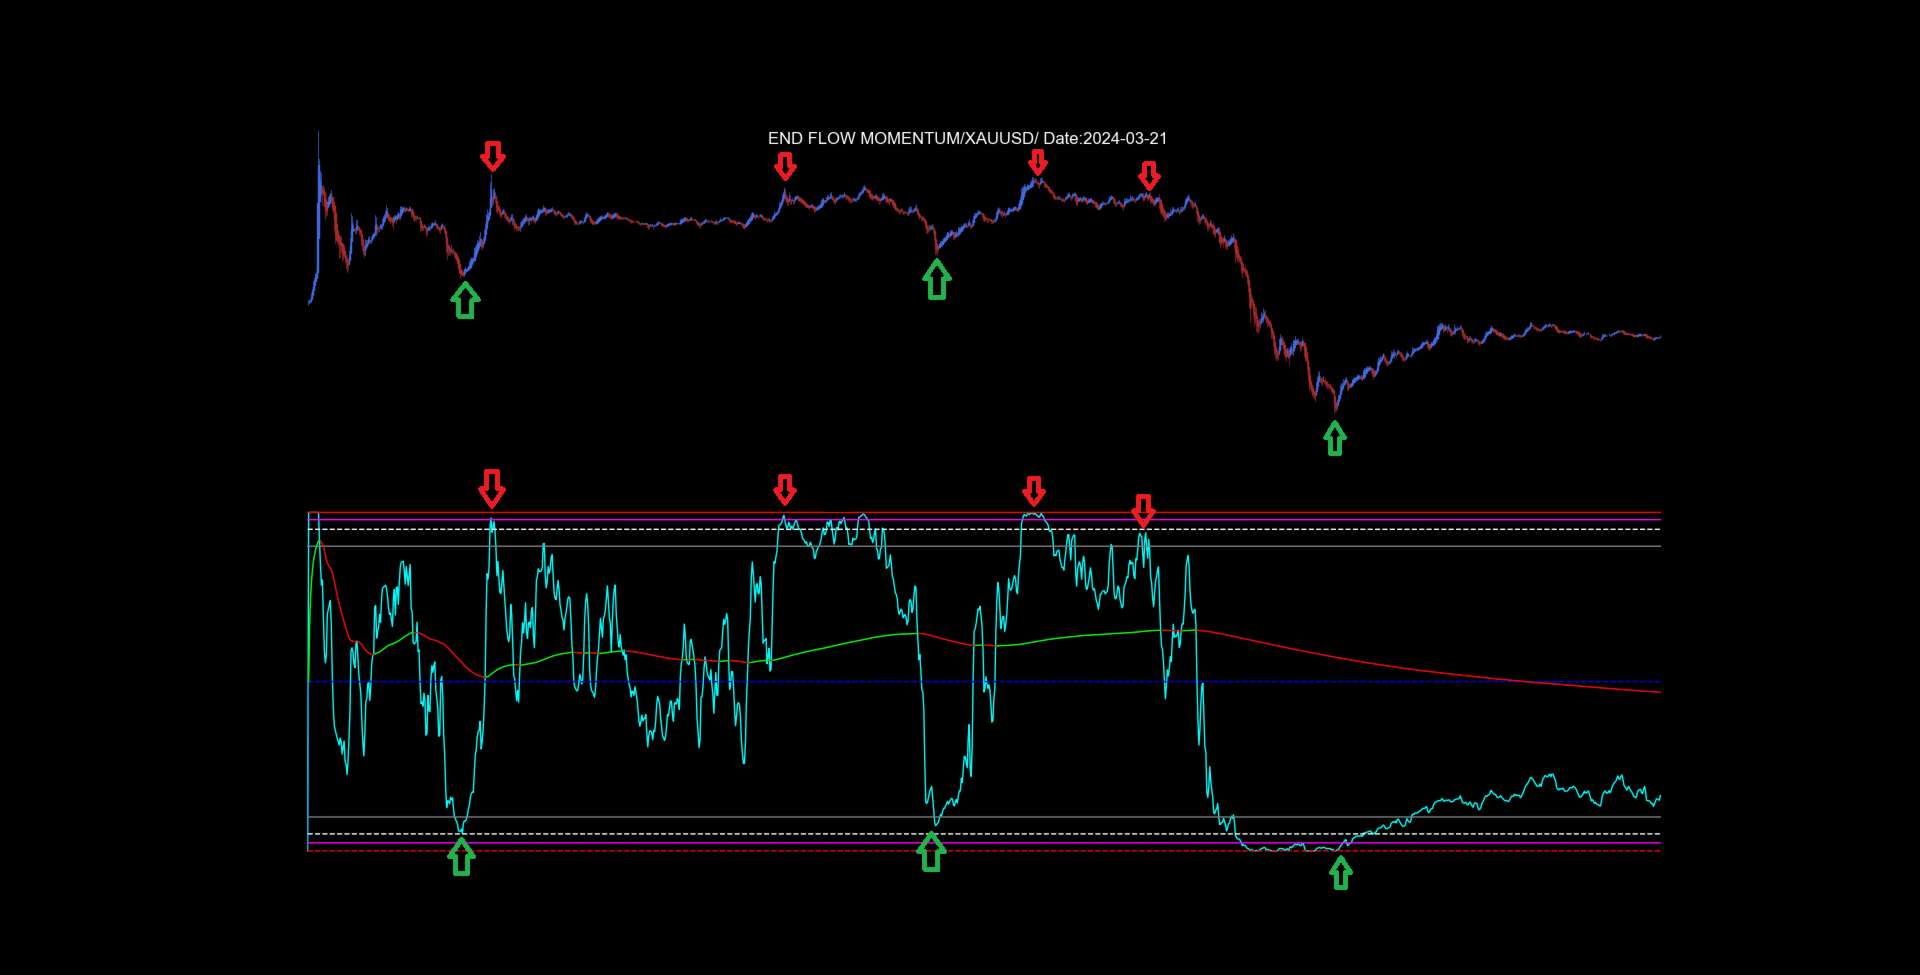
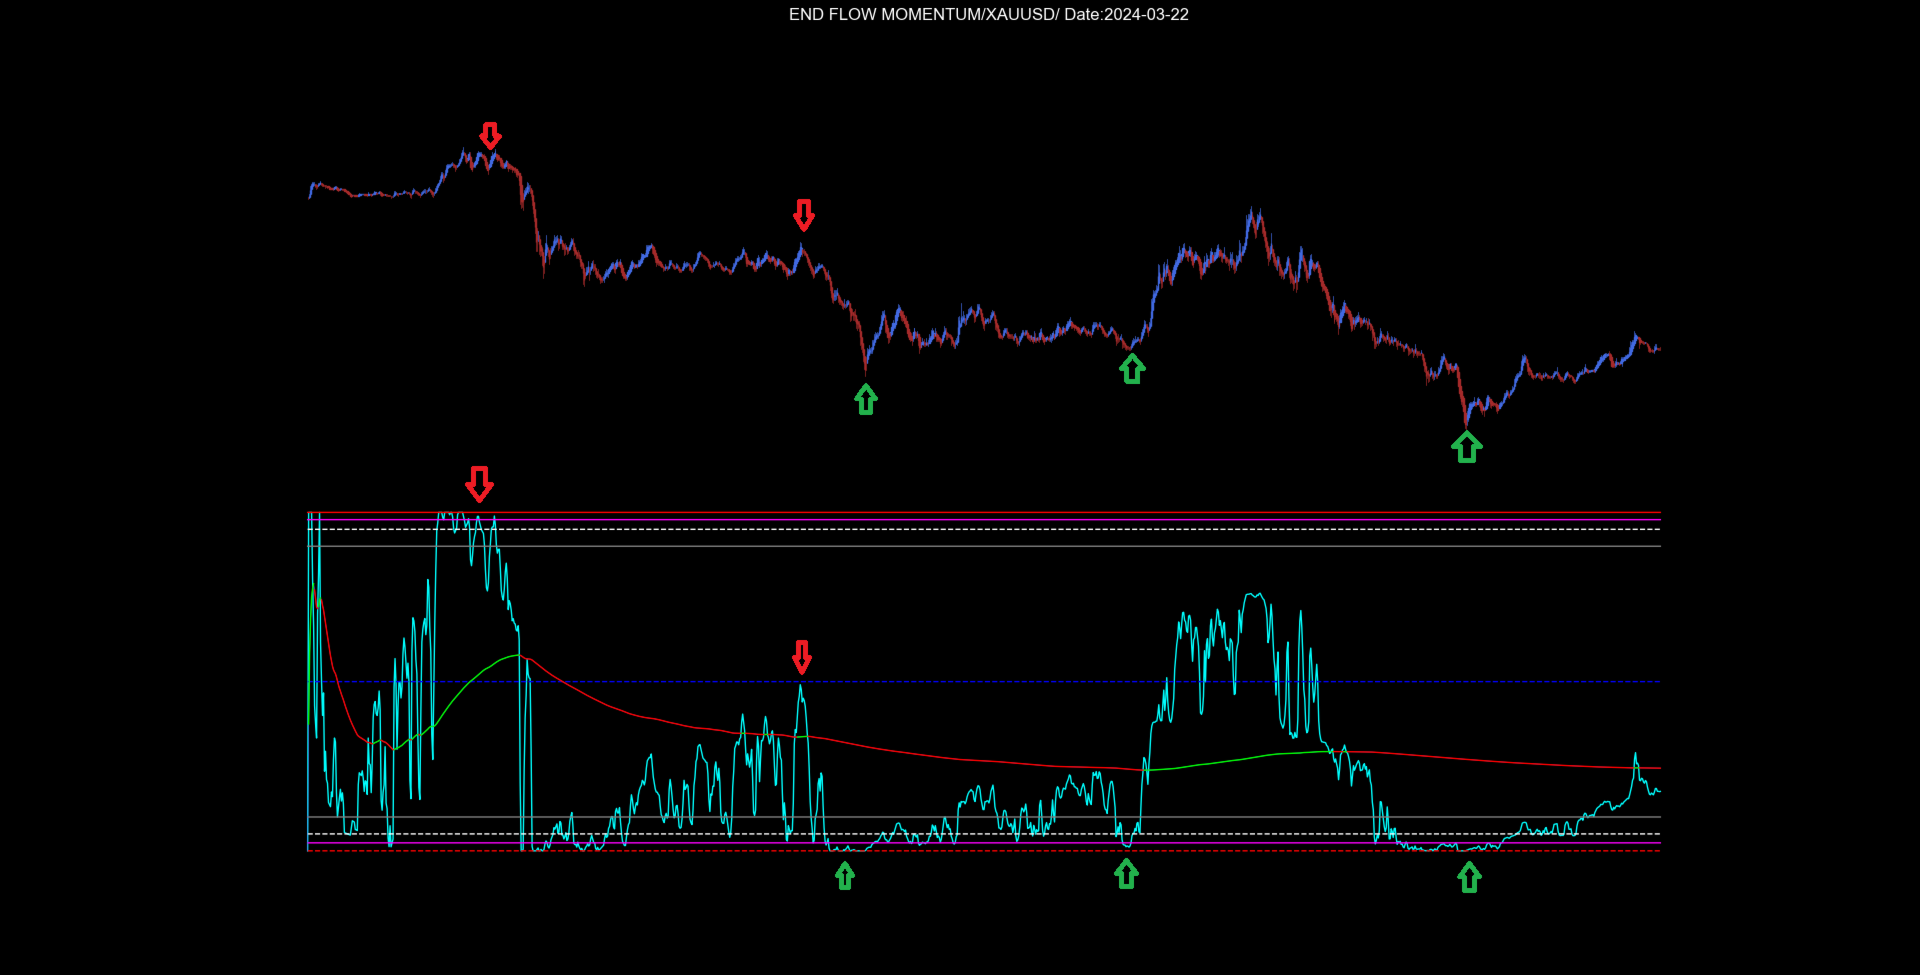
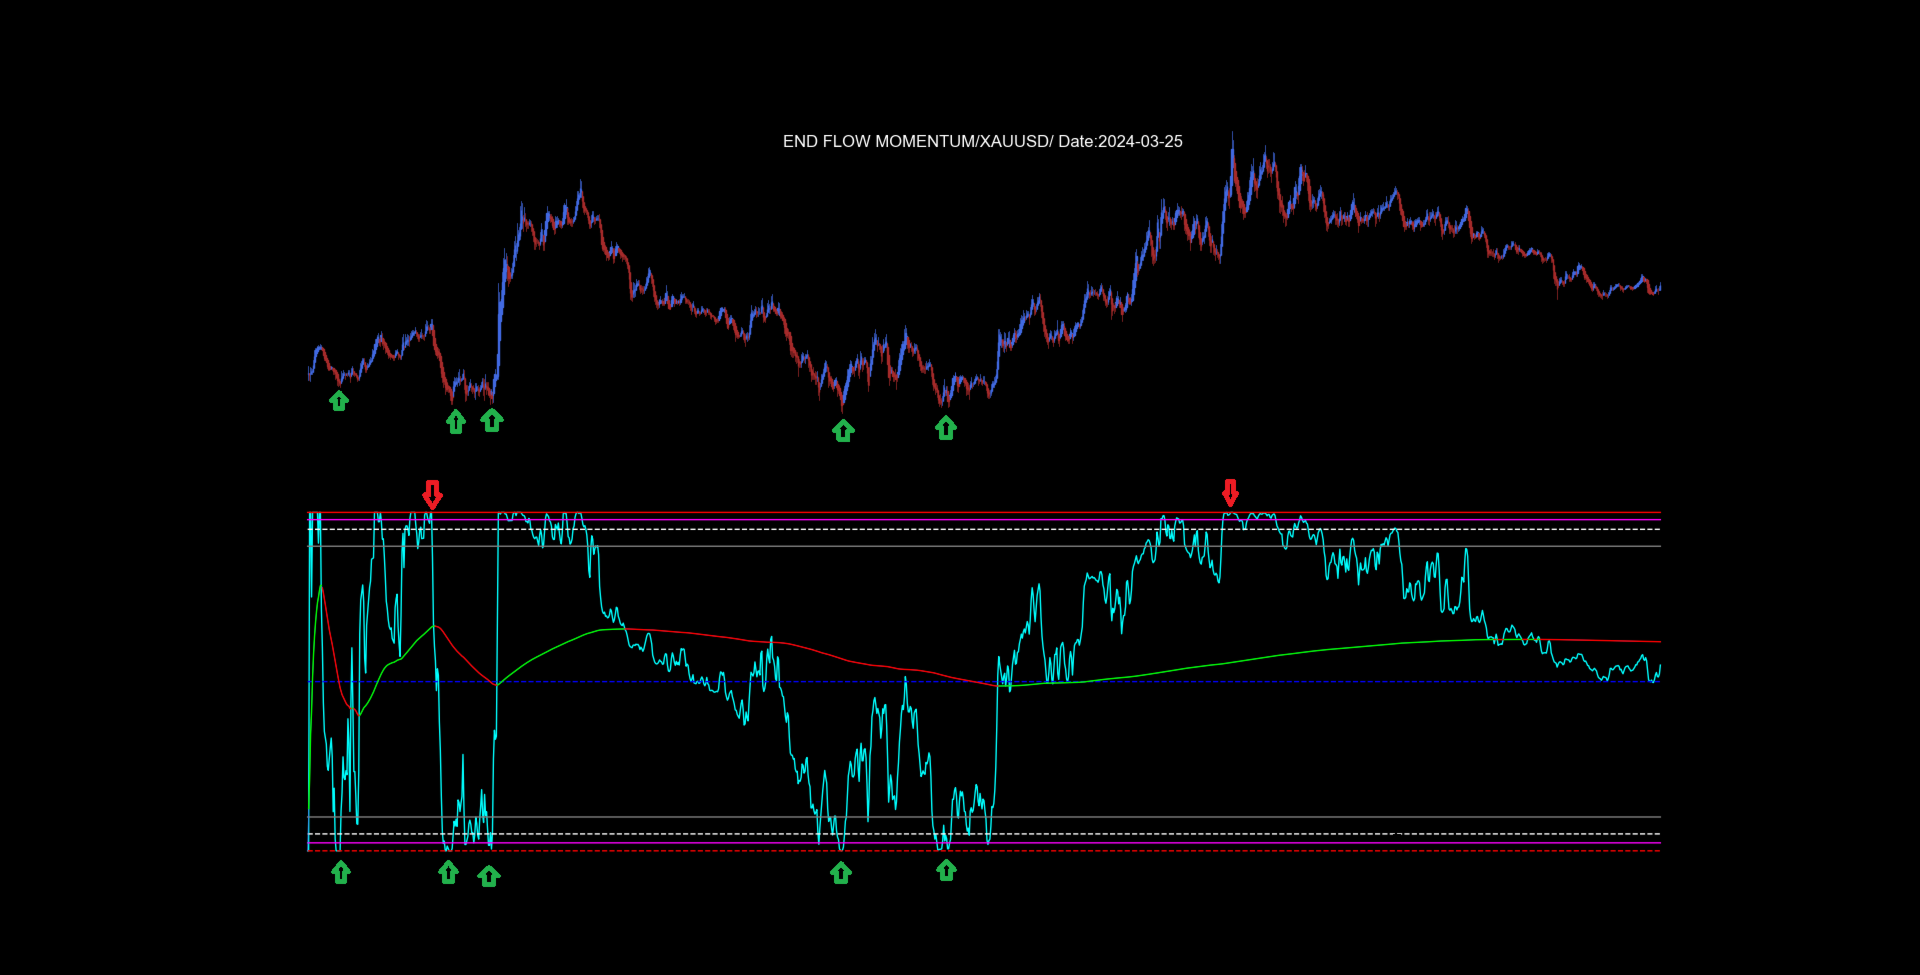
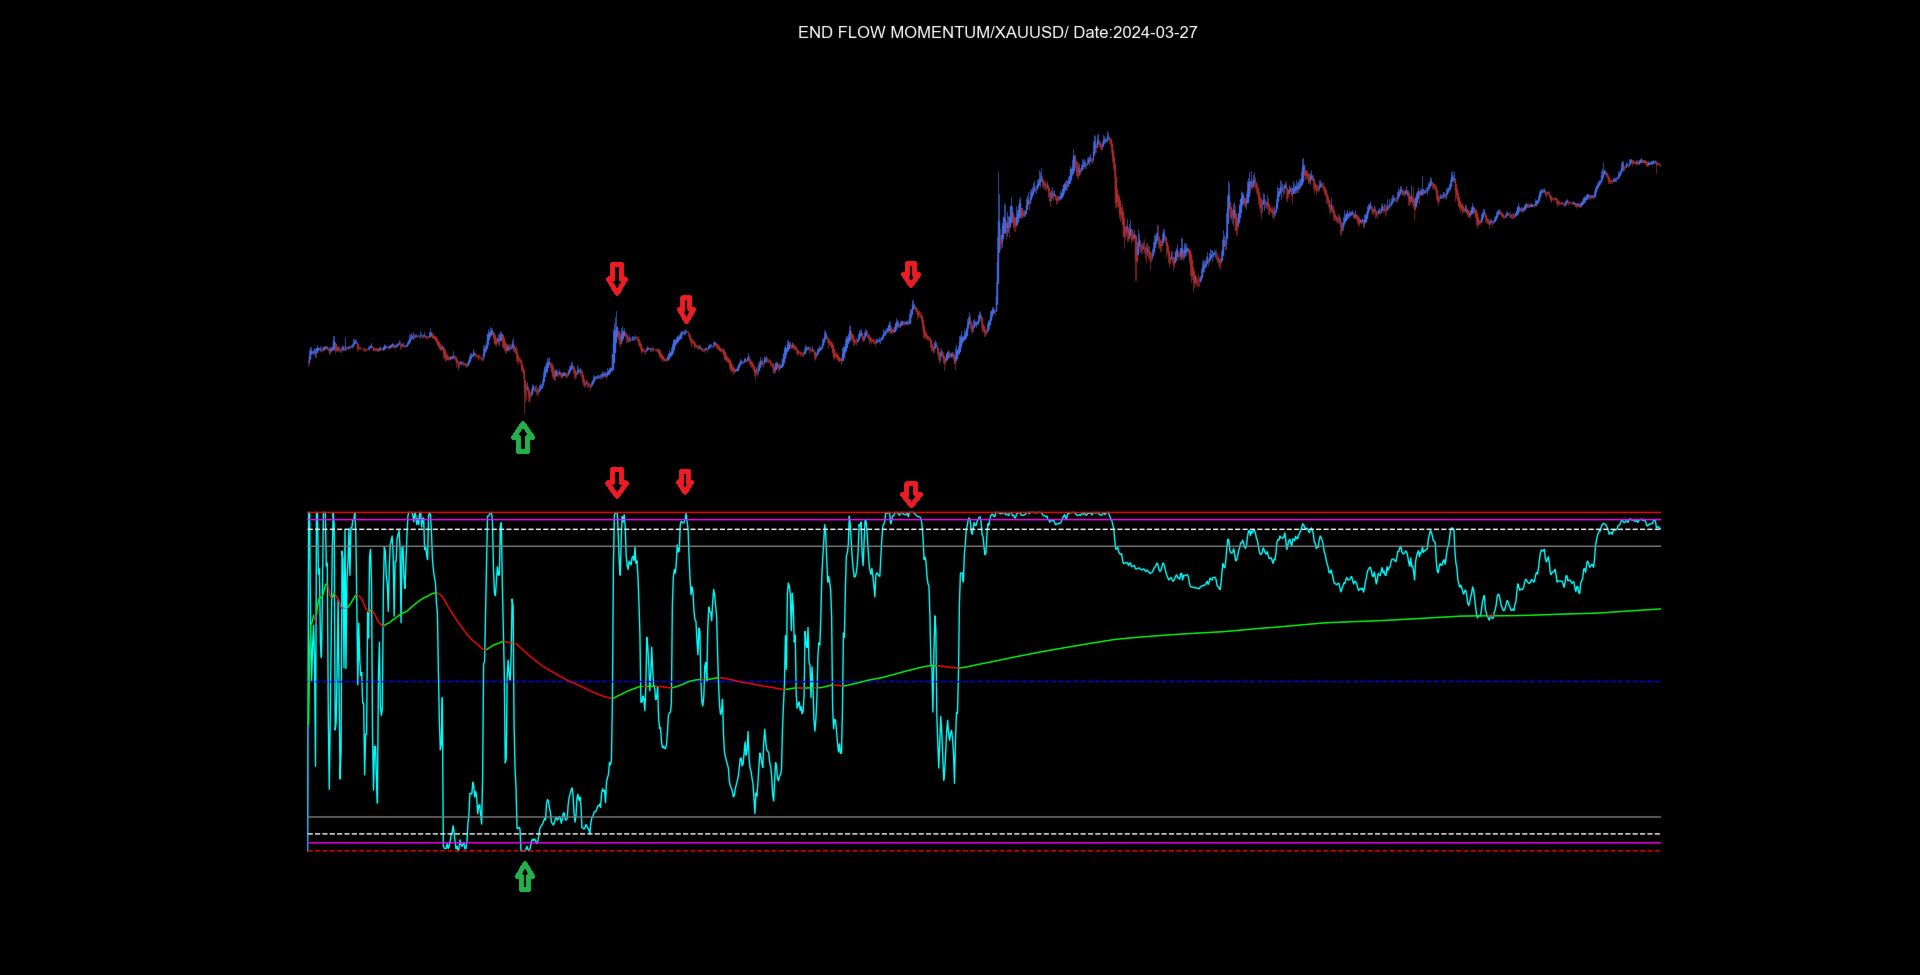
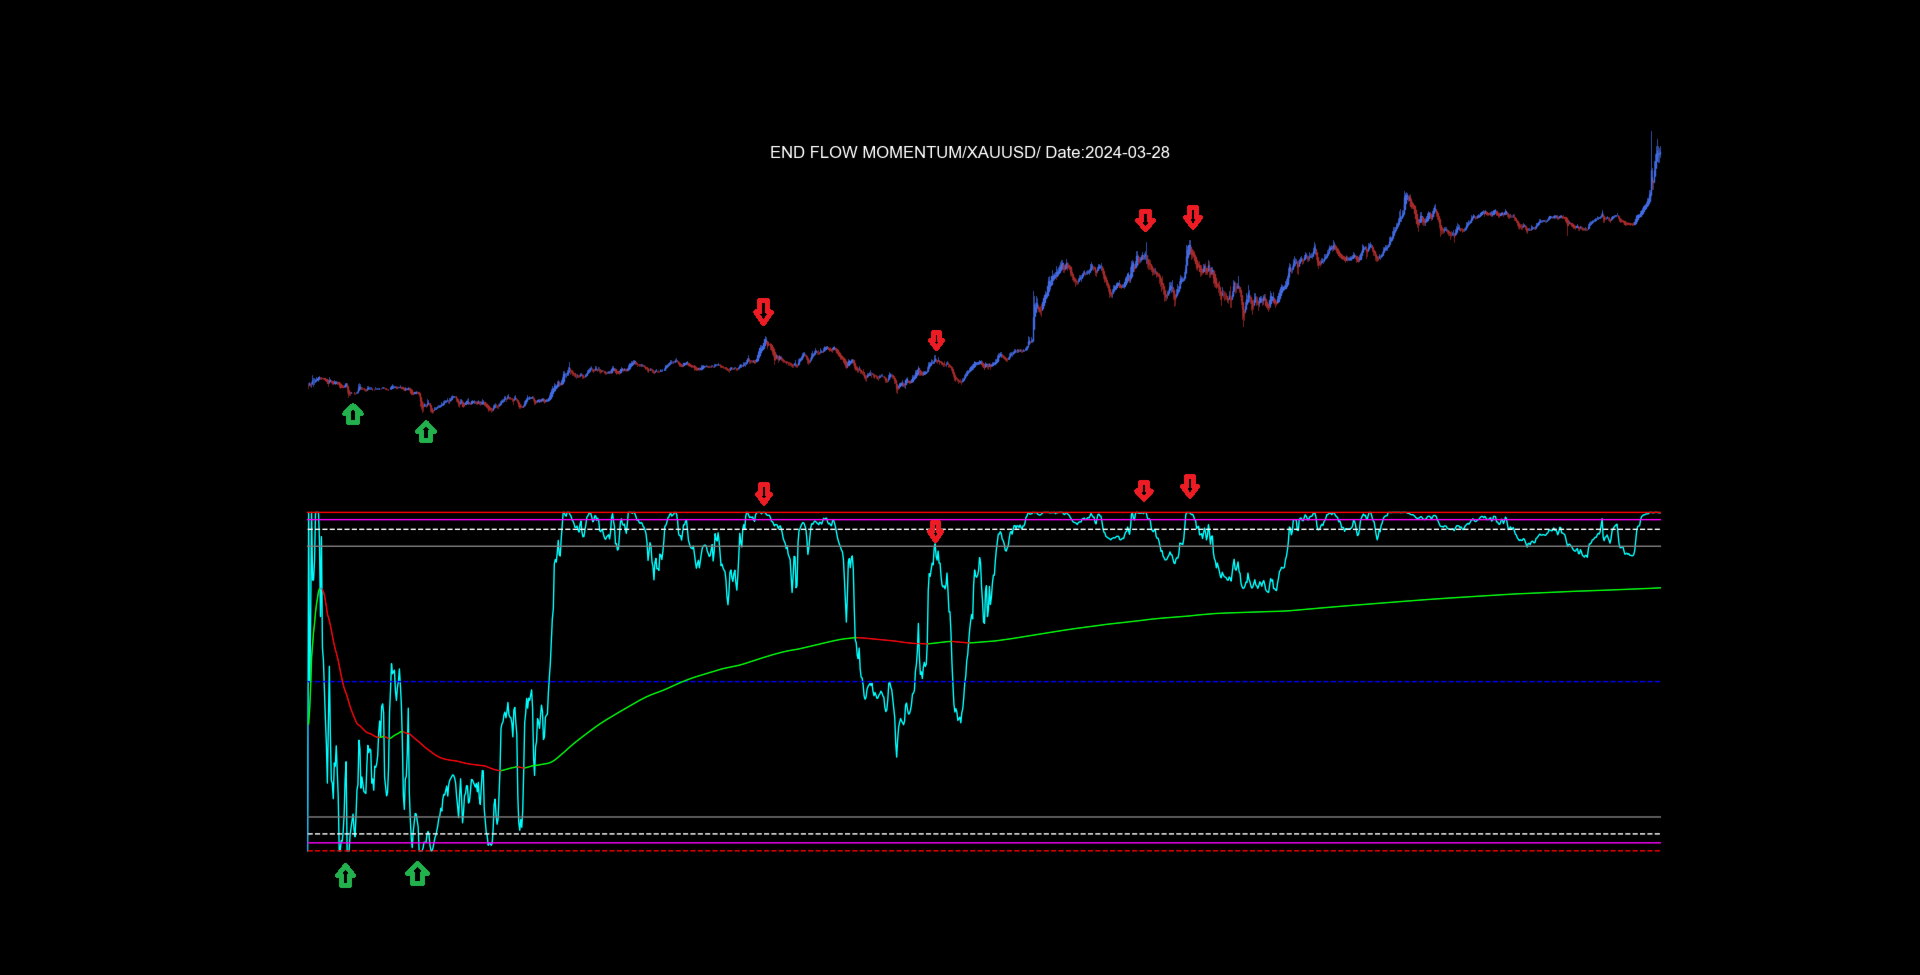
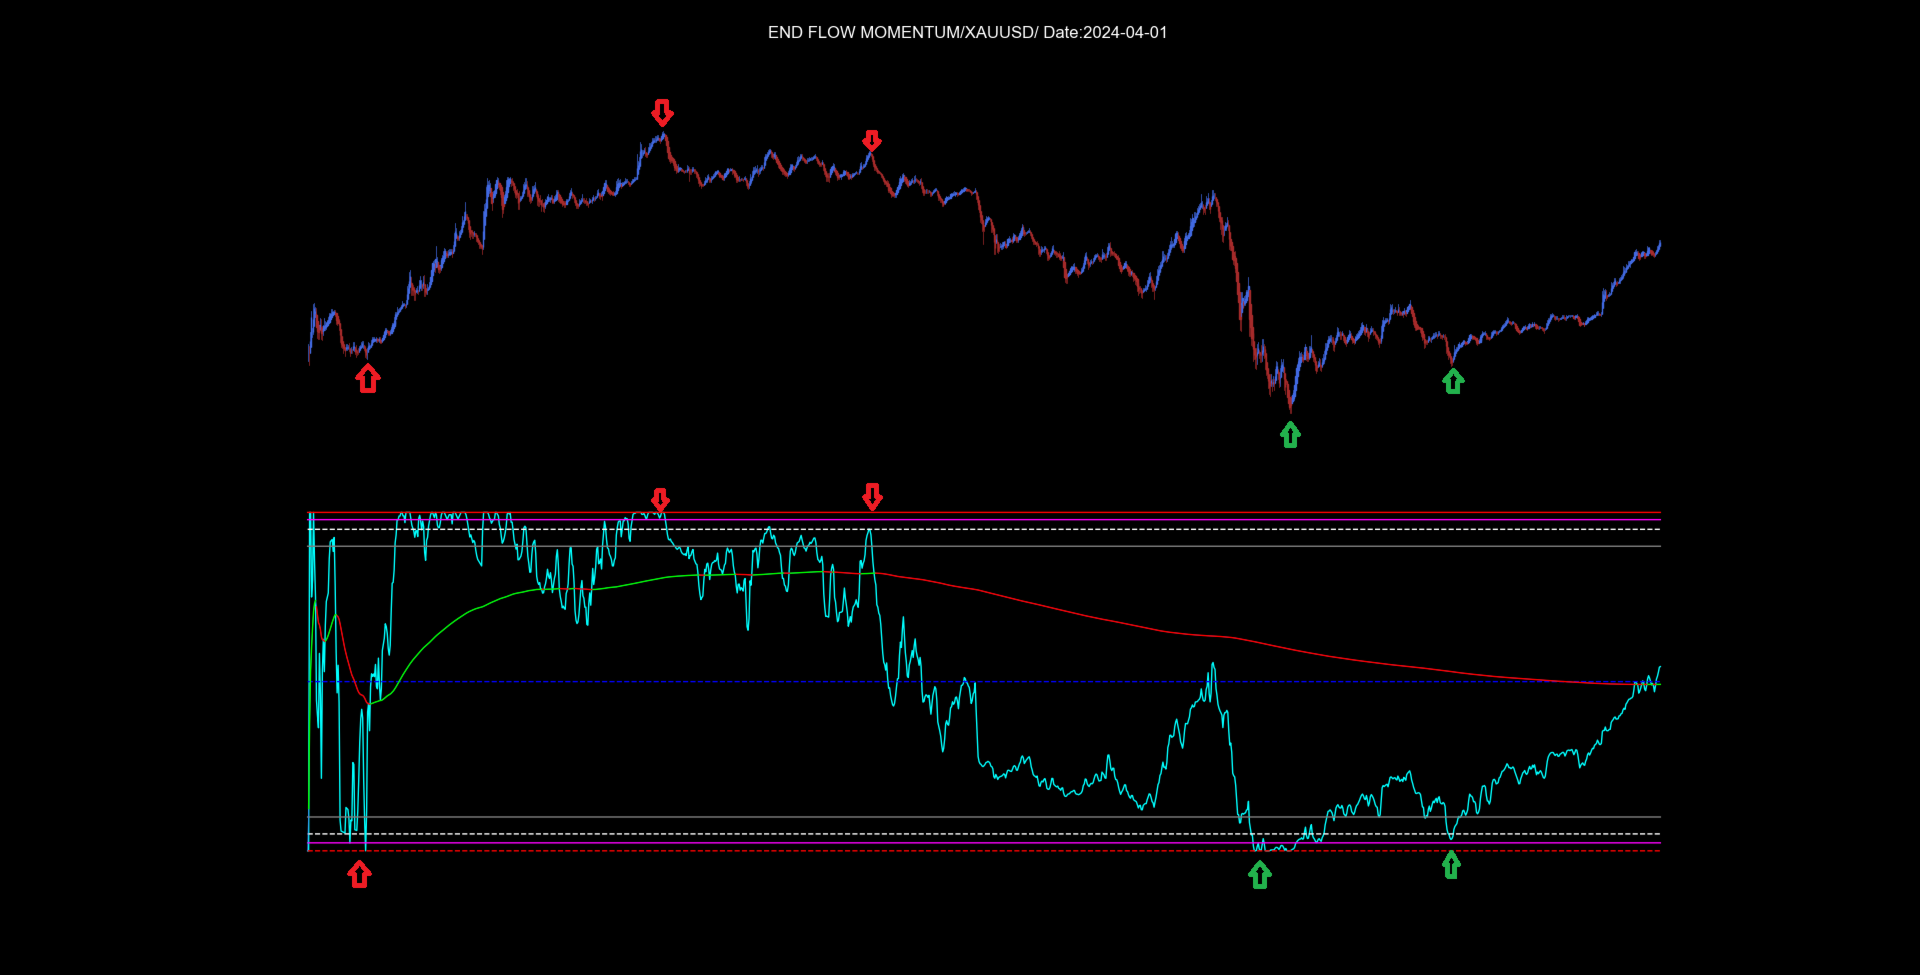
End Flow Momentum is a technical indicator that blends volume, price, and volatility analysis into a visual tool. Designed for traders seeking an alternative capital flow analysis tool.
Key Features
1. Mathematical Foundation
-
Proprietary Calculation Model: Uses a mathematical core that serves as a dynamic central reference point.
-
Volatility-Adaptive Scaling: Utilizes the asset's inherent volatility as the primary scalar, allowing automatic adaptation across different instruments.
-
Geometric Structure: Incorporates geometric proportions to define support and resistance level structures.
2. Dual Signal Trading System
A) Real-Time Capital Flow Signals
-
1. Instant Flow Signal: Cyan Line. Represents money/volume flow in real-time, showing the market's immediate intention.
-
2. Cumulative Momentum Signal: Dynamic Lime Green (bullish) or Red (bearish) Line. Represents the accumulation of money/volume flow, showing market momentum.
B) 9-Level Trading System (Price Ranges)
The indicator defines nine critical levels that form a framework for market analysis:
| Lvl | Name | Type | Description |
|---|---|---|---|
| a | Buy Exhaustion - Upper Limit | Solid Red Line | Zone where buying pressure exhausts; may suggest a reversal or distribution. |
| b | Impulse Validation Level (Buy Side) | Solid Magenta Line | Critical point that may indicate the strength of a bullish impulse. |
| c | Mid-Point Validation Level | White Dotted-Dashed Line | Intermediate equilibrium level acting as dynamic support/resistance. |
| d | Retracement Zone (Buy Side) | Solid Gray Line | Base of the bullish move; origin of demand and defense for buyers. |
| e | General Average Level | Blue Dashed Line | Theoretical global equilibrium point of the indicator. |
| f | Retracement Zone (Sell Side) | Solid Gray Line | Base of the bearish move; origin of supply and defense for sellers. |
| g | Mid-Point Validation Level (Sell Side) | White Dotted-Dashed Line | Intermediate point of the bearish trajectory. |
| h | Impulse Validation Level (Sell Side) | Solid Magenta Line | Level that may confirm or invalidate the bearish impulse. |
| i | Sell Exhaustion - Lower Limit | Solid Red Line | Zone where selling pressure exhausts; may suggest a bearish climax. |
3. Capital Flow Algorithm
-
Tick-by-Tick or Closed Bar Analysis: Processes tick-level volume data to analyze market intention.
-
Intention Detection: Distinguishes between accumulation/distribution and market movements.
4. Technical Implementation
-
Language: Developed in MQL5 for integration with MetaTrader 5.
-
Optimization: Coded for maximum efficiency.
5. Compatibility
-
Universal Application: Compatible with all financial instruments.
-
Recommended Timeframe: Works on M1 to M5 timeframes.
Advantages
-
Dual Signals: Provides readings for both Capital Flow direction and Accumulation/Distribution phases.
-
Automatic Adaptability: Self-adjusts to any asset.
-
Visual Clarity: The 9-level system provides a visualization of market dynamics.
Interpretation Guide
-
Cumulative Signal (Lime Green/Red) above Central Equilibrium (Blue Line): May suggest a bullish bias.
-
Cumulative Signal (Lime Green/Red) below Central Equilibrium (Blue Line): May suggest a bearish bias.
-
Rejection at Exhaustion Levels (Red Lines): May suggest a potential reversal.
-
Hold at Demand/Supply Origin (Gray Lines): May indicate the strength of the current trend.
-
Instant Flow Signal (Cyan): May provide real-time confirmation of capital flow direction.
Important Note
End Flow Momentum is a decision-support tool. It does not guarantee trading results. The indicator should be used as part of a comprehensive strategy that includes risk management. Always backtest and forward-test any strategy before using it with real capital.