ScannerX
- 지표
- Pawel Drucis
- 버전: 1.0
Hi Guys!
Today I want to share with you some usefull indicator that can help you with overall market overview.
How it works?
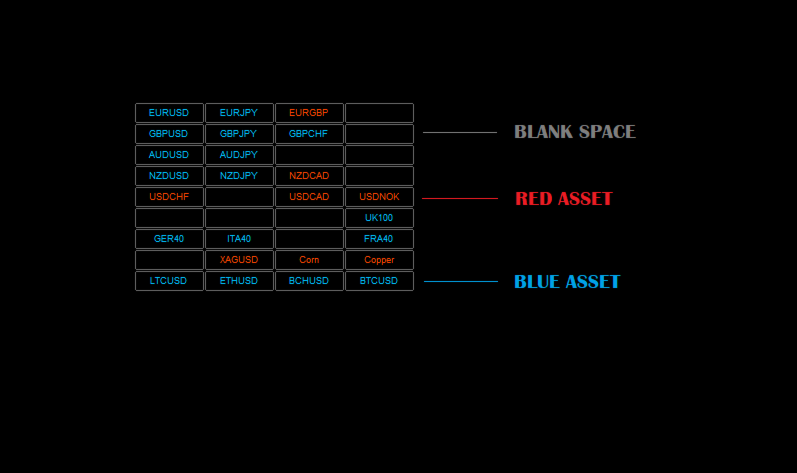
Indicator works as a dashboard that will show you list of assets (you can pick any you like)
and provides simple visual information:
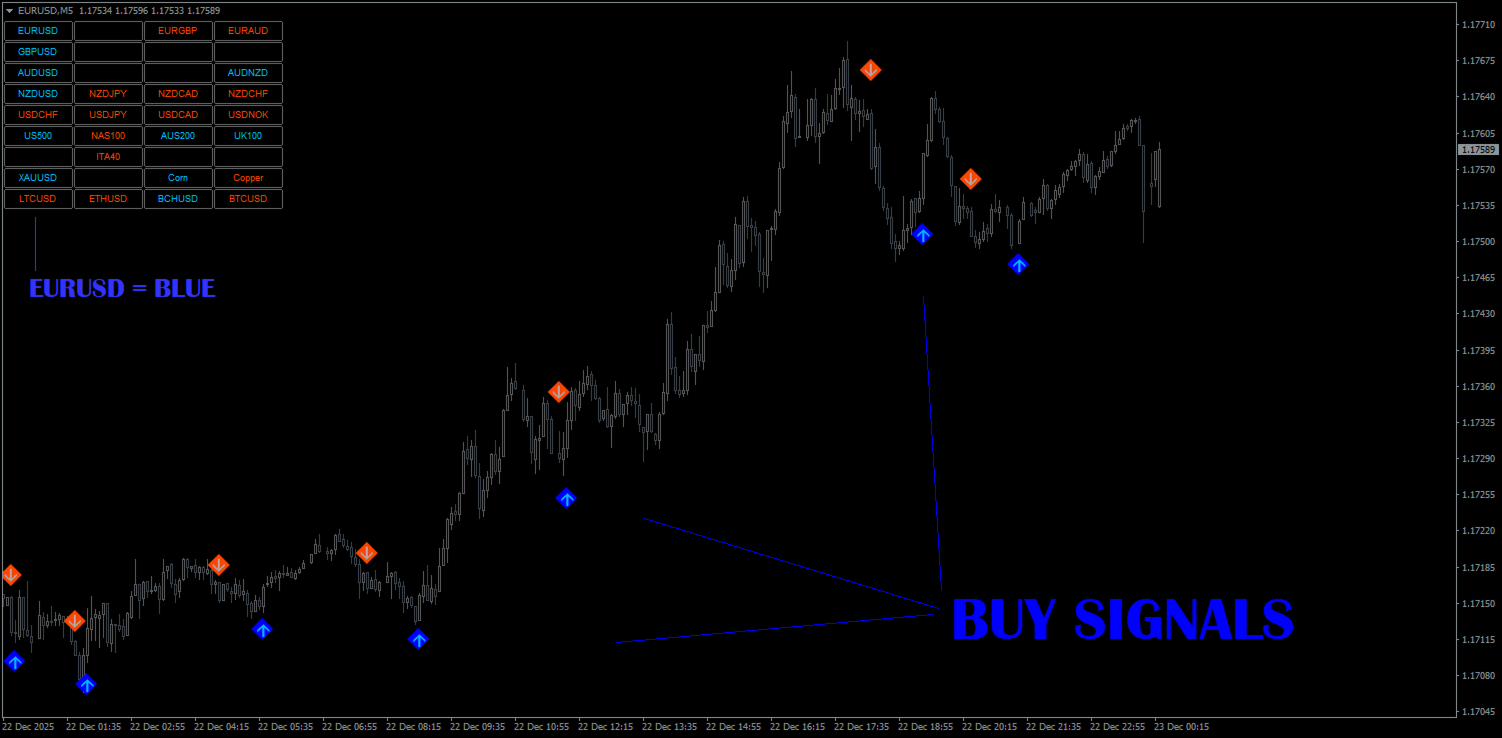
Blue asset - means that the instrument is in the UP trend
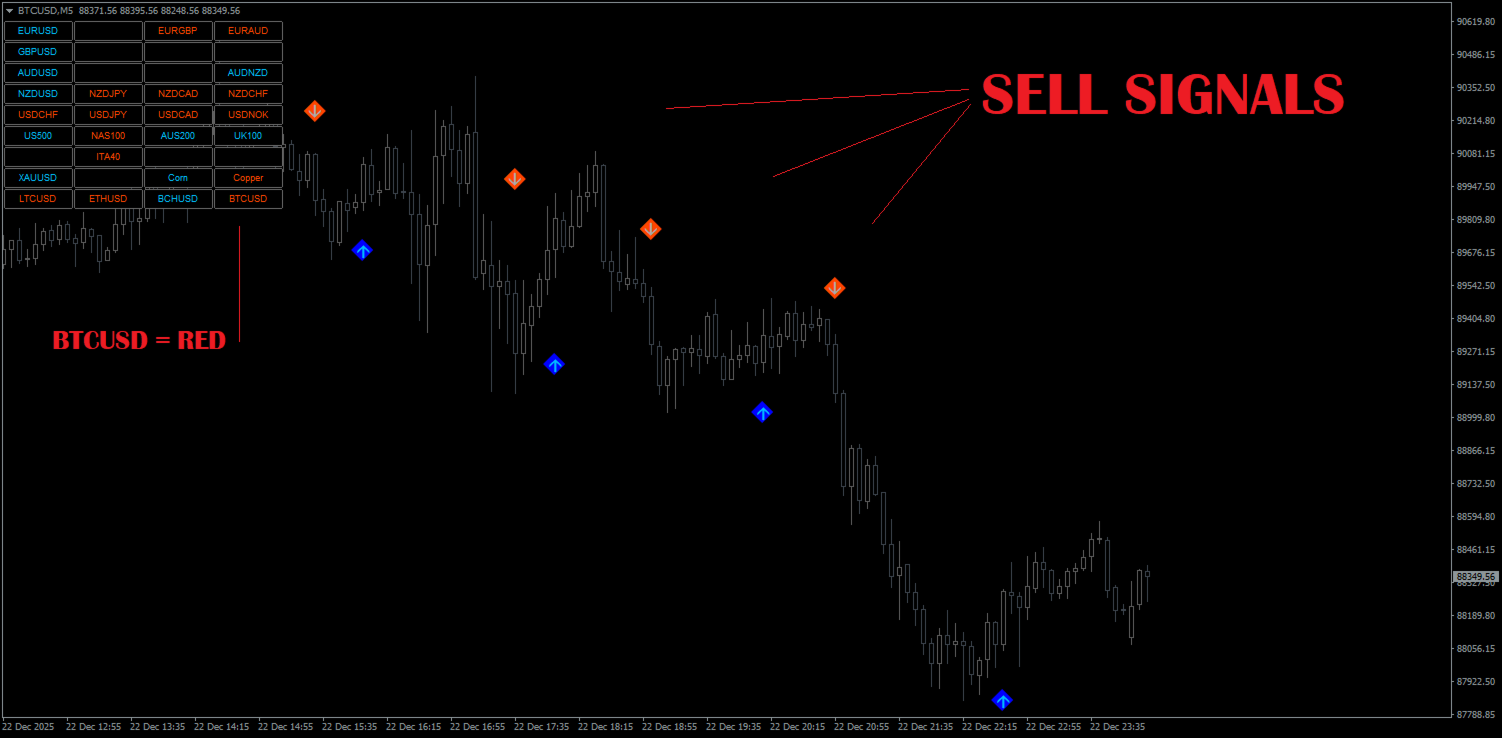
Red asset - means that the instrument is in the DOWN trend
Black space - means that instrument is in a range or it's changing it's current direction
How to use it?
- place your favourite trading instruments into the settings
- you will see whole market analysis in one place
- combine it with your favourite entry indicator for signals in line with the market
- you can switch the charts easily, just by clicking the instrument name on the dashboard
Hope you will find it usefull!
Best regards
Pawel