Turtle Trade Channels Indicator

1. Overview

The Turtle Trade Channels is a comprehensive technical analysis tool for MetaTrader 5, based on the core principles of the classic Turtle Trading system. This indicator is designed to help traders identify significant price movements by plotting dynamic price channels that highlight potential channel breakouts and reversals.

The methodology is based on channel breakouts:

  • An upward channel breakout is indicated when the price breaks above the upper channel.
  • A downward channel breakout is indicated when the price breaks below the lower channel.

This tool enhances the basic channel breakout concept with integrated volatility reference levels (ATR-based), a real-time information dashboard, and a flexible alert system to keep you informed of key market events.

2. Features

  • Dynamic Price Channels: Automatically plots the upper and lower price channels based on user-defined periods.
  • Trend and Exit Lines: Includes a main trend line and an exit line to provide context for the current market structure and potential reversal areas.
  • ATR-based Volatility Reference: Displays a reference level based on the Average True Range (ATR) at the moment of a channel breakout. This helps in understanding market volatility.
  • Multi-Alert System: Receive timely notifications for channel breakout and reversal events. Alerts can be configured for on-screen pop-ups, sound, push notifications to your mobile device, and email.
  • On-Screen Dashboard: A convenient information panel that displays the current channel state (Upward Momentum, Downward Momentum, Neutral), key channel price levels, and the current volatility reference value.
  • Customizable Visuals: Clear, non-intrusive arrows on the chart indicate significant channel breakout or reversal events.

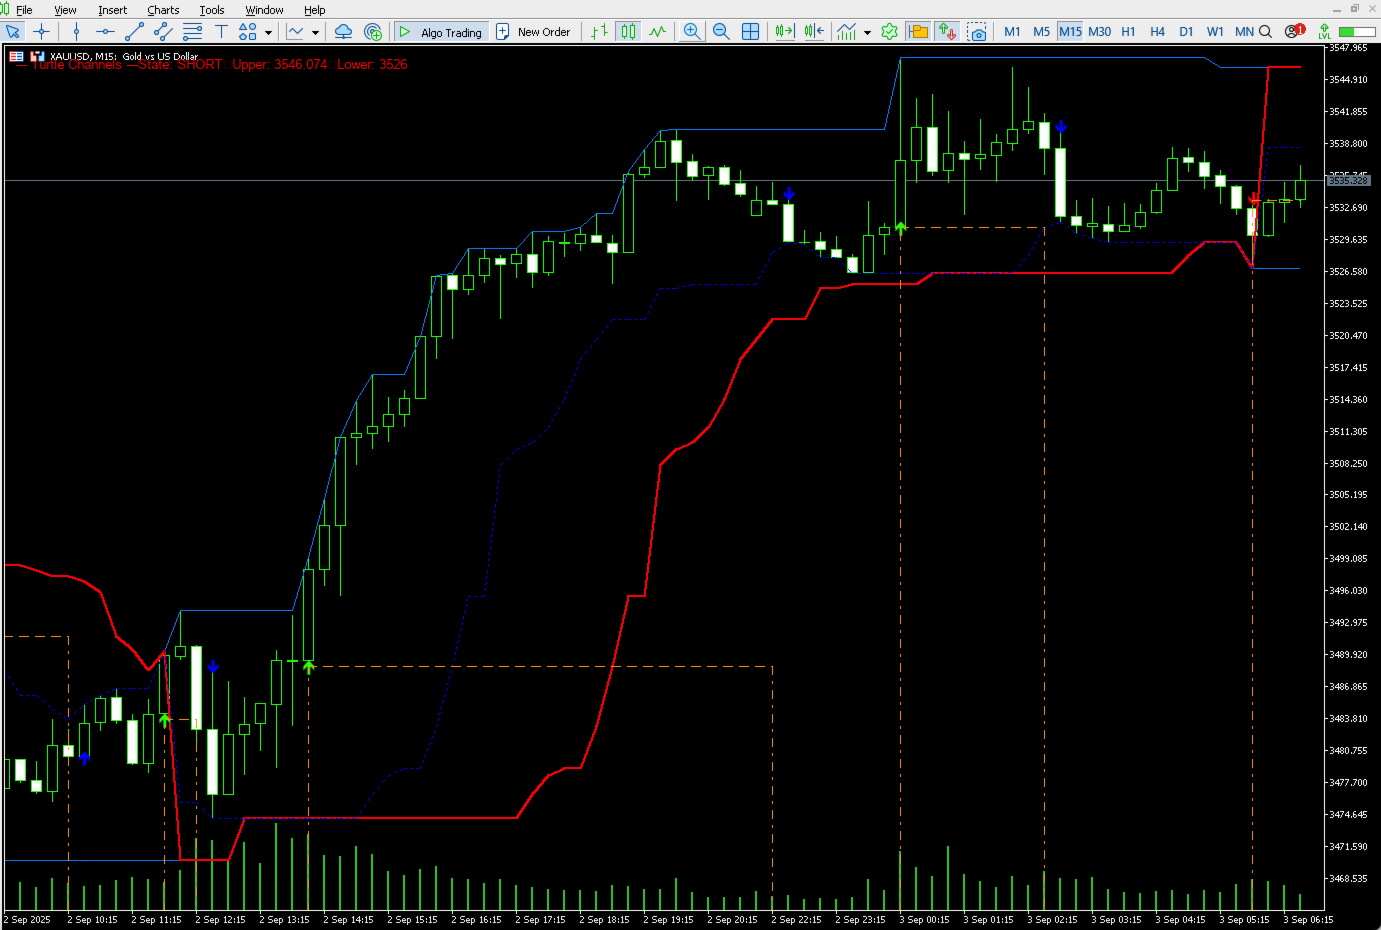
3. Interpreting the Indicator's Visuals

This indicator provides visual cues and data to assist in technical analysis. It does not provide trading advice or recommendations.

Channel Breakout Visuals

  • Upward Breakout (Green Arrow): A green arrow pointing up appears when the high of a candle breaks above the upper channel. This visual indicates strong upward momentum and a potential start of an uptrend.
  • Downward Breakout (Red Arrow): A red arrow pointing down appears when the low of a candle breaks below the lower channel. This visual indicates strong downward momentum and a potential start of a downtrend.

Trend Reversal Visuals

  • Upward Trend Reversal (Blue 'x' symbol): A blue 'x' symbol appears, indicating a potential reversal of upward momentum. This visual suggests that the current upward movement may be losing strength.
  • Downward Trend Reversal (Blue 'x' symbol): A blue 'x' symbol appears, indicating a potential reversal of downward momentum. This visual suggests that the current downward movement may be losing strength.

ATR-based Volatility Reference Line

When the ShowATRStopLoss feature is enabled, a dash-dot line will appear following a channel breakout.

  • For an upward breakout, the line appears below the breakout price.
  • For a downward breakout, the line appears above the breakout price.

This line represents a volatility reference level calculated using the ATR. It provides a visual representation of market volatility relative to the breakout point. It is a reference for analytical purposes only.

The Dashboard

The on-screen dashboard provides a quick summary of the indicator's status:

  • State: Shows if the indicator's logic is currently in an UPWARD MOMENTUM, DOWNWARD MOMENTUM, or NEUTRAL state. The color of the dashboard text will change to reflect this.
  • Upper/Lower: Displays the current price values for the main channels.
  • Exit: Displays the current price value of the exit line.
  • Volatility Reference: Shows the calculated volatility reference price. Displays "---" if no breakout is active.
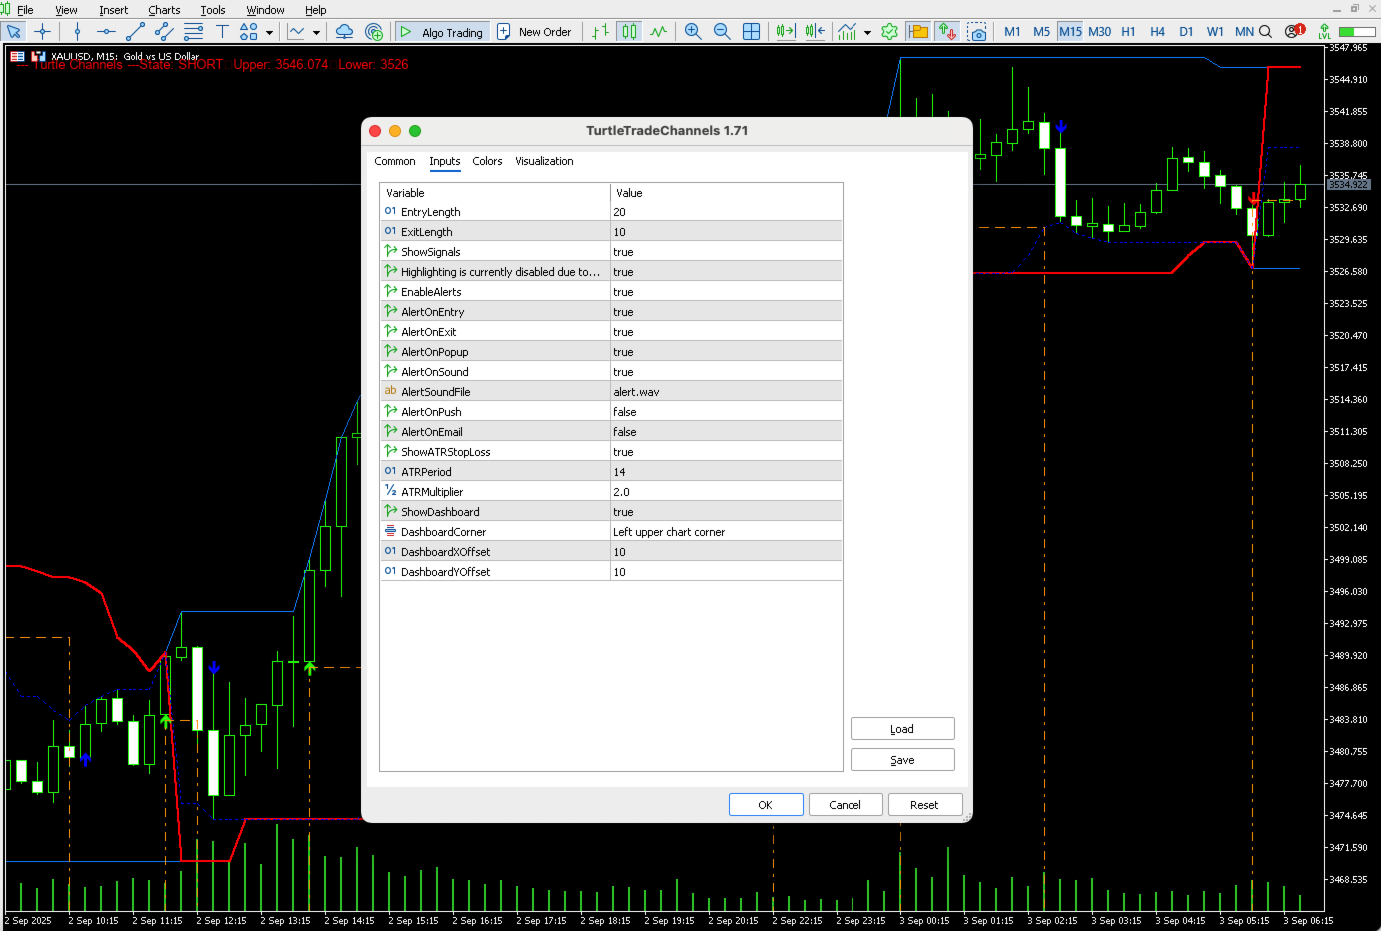
4. Input Parameters

The indicator is highly customizable. Below is a detailed description of each parameter.

General Settings

  • EntryLength : The lookback period (in bars) for calculating the upper and lower channels. Default is 20.
  • ExitLength : The lookback period for calculating the exit line. Default is 10.
  • ShowVisuals : (true/false) Toggles the visibility of the channel breakout and trend reversal arrows on the chart.

Alert Settings

  • EnableAlerts : (true/false) The master switch to turn all alerts on or off.
  • AlertOnChannelBreakout : (true/false) Enables alerts specifically for channel breakout events.
  • AlertOnTrendReversal : (true/false) Enables alerts specifically for trend reversal indications.
  • AlertOnPopup : (true/false) Enables the standard MetaTrader pop-up alert window.
  • AlertOnSound : (true/false) Enables a sound alert.
  • AlertSoundFile : The name of the sound file to be played (e.g., "alert.wav").
  • AlertOnPush : (true/false) Sends a push notification to your connected mobile device. Requires MetaQuotes ID to be configured in MT5 settings.
  • AlertOnEmail : (true/false) Sends an alert via email. Requires email to be configured in MT5 settings.

ATR-based Volatility Reference Settings

  • ShowATRVolatilityReference : (true/false) Toggles the visibility of the ATR-based volatility reference line.
  • ATRPeriod : The lookback period for the ATR calculation. Default is 14.
  • ATRMultiplier : The value to multiply the ATR by to determine the volatility reference distance. Default is 2.0.

Dashboard Settings

  • ShowDashboard : (true/false) Toggles the visibility of the on-screen information panel.
  • DashboardCorner : Sets the corner of the chart where the dashboard will be displayed (e.g., CORNER_LEFT_UPPER).
  • DashboardXOffset : The horizontal distance (in pixels) from the corner.
  • DashboardYOffset : The vertical distance (in pixels) from the corner.

Disclaimer

This indicator is a tool to assist with technical analysis. It does not provide financial advice or guarantee any trading outcomes. All trading involves risk, and past performance is not indicative of future results. Please use this tool as part of a comprehensive trading plan that includes your own risk management rules.

추천 제품
TradeInfos
Dustin Ricardo Pierenz
Track your spread and all position PnLs (Buy & Sell) in real-time – stay in control of your trades at a glance! Features: Real-time spread display (in pips) Total Buy position PnL Total Sell position PnL Clean, non-intrusive display layout Works with all symbols and timeframes Perfect for: Scalpers needing quick spread awareness Day traders monitoring long/short performance Risk managers optimizing exposure No need to switch tabs or rely on external tools — everything you need is visible at
FREE
Average Session Range: Calculate and Average the Sessions High-Low Range of Specific Time Sessions Over Multiple Days. The Session Average Range is a sophisticated and precise tool designed to calculate the volatility of specific time sessions within the trading day. By meticulously analyzing the range between the high and low prices of a defined trading session over multiple days, this tool provides traders with a clear and actionable average range. **Note:** When the trading platform is closed
FREE
Ultimate Candle Patterns
Wojciech Daniel Knoff
Check out my TRADE PLANNER MT5 – strongly recommended to anticipate account scenarios before risking any money. This is a multi-symbol, multi-timeframe, table-based indicator for MetaTrader 5 that identifies 46 types of candlestick formations. Each formation has its own image for easier recognition. The indicator includes popular patterns such as Engulfing, Hammer, Three Line Strike, Piercing, and Doji-like candles. You can check the full list of patterns in the screenshots below. Also you can
Please download version 3.0 ! The Fundamental Fast Signal EA is a non-trading signal generator for MT5 , designed to provide traders with high-accuracy buy/sell alerts based on the EMA (9, 21) crossover on the 5-minute timeframe . This indicator empowers traders by offering precise entry signals while keeping full trade execution control in their hands. Key Features: EMA (9, 21) Crossover-Based Signals – Identifies momentum shifts for strategic trade entries. 5-Minute Timeframe Optimization – Id
FREE
안녕하세요. 12point입니다. 인디케이터가 손쉽게 원하는 통화차트로 변경해줍니다.  굳이 듀얼모니터 사용하실 필요없습니다. 창 두개 띄어놓고도 변경가능합니다. 이건 무료 버전이고,  무료 버전에는 메이져 통화들만 적용됩니다. ( AUDUSD,EURUSD,GBPUSD,USDCHF,USDCAD,USDJPY,NZDUSD) 유료 버전에는 원하시는 통화,지수 및 금 처럼 추가하셔서 목록을 만드실수있습니다. 풀버전: https://www.mql5.com/en/market/product/71173?source=Site+Market+MT5+Indicator+New+Rating005#description 원하시는 타임프레임도 변경가능합니다. 통화는 무조건  Market Watch 목록에 활성화가 되어있어야합니다. 그래야 정상작동이 되요.  파라미터 값: ratio - 사이즈 조절 LineNumber - 각 라인당 몇개의 통화버튼을 지정할것인가 입니다. 감사합니다.
FREE
Market Session and Custom Session draws market session zones (Asia, London, New York) plus a user-defined session directly on your chart — including session highs/lows, optional filled areas, labels and hover tooltips. Built for intraday traders, scalpers and analysts who need to spot session structure and recurring levels quickly. Highlights Immediate visual reference for major trading sessions. Automatic session High/Low markers — great for breakout setups and volatility analysis. User-definab
FREE
ZigZag Profile
Nguyen Thanh Cong
Introducing the ZigZag Profile — a powerful tool designed to identify high-probability pivot zones where price action frequently reverses. This indicator analyzes historical price data to pinpoint key areas where price has pivoted multiple times, providing traders with actionable insights into potential support and resistance levels. The ZigZal Profile  indicator continuously scans for zones where price has reversed direction the most, highlighting these critical areas on your chart. By focusing
FREE
Overview Unlock a fresh perspective on your charts with the KS Invert Chart Pro Indicator – a powerful, zero-lag tool designed exclusively for MetaTrader 5. This innovative indicator inverts bars or candles mathematically (by multiplying price data by -1), revealing hidden patterns, contrarian opportunities, and inverse correlations that traditional views might miss. Perfect for advanced traders employing correlation strategies, multi-timeframe analysis, or hedge monitoring. Whether you're spott
FREE
Phoenix Vision
Nigel Nii Darku Narnor Darko
1 (1)
The Phoenix Vision indicator is a sophisticated High-Frequency HUD (Heads-Up Display) and Price Projection Tool designed for MetaTrader 5. It transforms a standard chart into a data-rich command centre by merging real-time candle analytics with automated mathematical forecasting. 1. Trader Benefits & Strategic Advantages Eliminates Analysis Paralysis: By centralising Tick Volume, Pip Range, and EMA-based Trend Direction into a single black-box HUD, it prevents you from constantly switching betw
FREE
Multi Currency Strength Dashboard Mini (무료) – MetaTrader 5 통화 강도(Strength) 지표 Multi Currency Strength Dashboard Mini 는 MetaTrader 5 용 무료 인디케이터로, 8개 주요 통화 (USD, EUR, GBP, JPY, CHF, CAD, AUD, NZD)의 상대적인 강도를 실시간으로 대시보드 형태로 표시합니다. 목적: 몇 초 만에 강한 통화 와 약한 통화 를 파악하여 워치리스트를 효율적으로 구성하고, 강세 vs 약세 조합의 통화쌍을 더 빠르게 선택하도록 돕습니다. 주요 기능 (Mini 무료 버전) 8개 주요 통화 강도를 한 패널에서 확인. 강도 바(Bar) + 퍼센트 값으로 시각화. 자동 실시간 업데이트(가벼운 갱신). 모든 타임프레임 에서 사용 가능(계산은 선택한 타임프레임 기준). 대부분의 브로커와 호환(일반적인 심볼 접미사 지원). 작동 방식 Market Watch 에서 사용 가능한 주
FREE
Currency Strength Chart MT5
Nguyen Thanh Cong
5 (1)
Currency Strength Chart is a powerful Forex indicator designed to track and visually represent the strength of individual currencies within a basket of the 8 major currencies: USD, EUR, GBP, JPY, AUD, NZD, CAD, and CHF. By calculating the relative strength of each currency, the indicator provides traders with a comprehensive overview of how each currency is performing against the others in real-time. This indicator helps traders identify potential trading opportunities by highlighting strong cur
FREE
DRX SPREAD MONITOR 는 브로커의 스프레드를 실시간으로 시각화하고 분석하기 위해 설계된 전문 유틸리티입니다. 뉴스 이벤트, 롤오버 또는 유동성이 낮은 세션 동안 스프레드 확대로 인한 숨겨진 비용을 식별하는 데 도움을 줍니다. 이 도구는 실행 품질을 보장하고 거래 비용이 통계적으로 너무 높을 때 진입을 피해야 하는 스캘퍼(Scalpers)와 골드 트레이더에게 필수적입니다. 주요 기능 실시간 히스토그램: 별도의 창에 스프레드 기록을 표시하며 정상, 높음, 극단적 수준을 색상으로 구분합니다. 동적 이동 평균(MA): 평균 스프레드 추세를 계산하여 일시적인 급등과 구조적인 스프레드 증가를 구별할 수 있게 합니다. 시각적 "이퀄라이저" 모드: 차트를 복잡하게 하지 않으면서 시장 유동성 상태에 대한 즉각적인 피드백을 제공하는 독특한 막대 차트 시각화입니다. 라이브 데이터 패널: 차트상의 컴팩트한 대시보드로 다음을 표시합니다: 현재 스프레드 평균 스프레드 (시간 기준) 최소/최대 기
FREE
멀티 타임프레임 지원, 맞춤형 시각 신호 및 구성 가능한 알림 시스템을 갖춘 Balance of Power(BOP) 지표. 프리랜서 프로그래밍 서비스, 업데이트 및 기타 TrueTL 제품은 제 MQL5 프로필 에서 이용하실 수 있습니다. 피드백과 리뷰를 대환영합니다! BOP란 무엇인가요? Balance of Power(BOP)는 가격 변화를 바의 범위와 비교하여 매수자 대 매도자의 강도를 측정하는 오실레이터입니다. 지표는 (종가 - 시가) / (고가 - 저가)로 계산된 후 단순 이동 평균(SMA)으로 평활화됩니다. BOP 값은 -1과 +1 사이에서 변동합니다. 양수 값은 매수자가 더 강함을 나타내고(종가가 시가보다 높음), 음수 값은 매도자가 더 강함을 나타냅니다(종가가 시가보다 낮음). 값의 크기는 움직임의 강도를 나타냅니다. BOP는 매수 압력과 매도 압력 사이의 균형을 보여줌으로써 시장 강도와 잠재적인 반전을 식별하는 데 도움이 됩니다. 특징: 화살표 및 수직선을 이용한
FREE
POscillator
Arya Tavakol
The most sensitive indicator you've ever seen . . . POscillator is a sensitive indicator to find each trend direction change in every timeframe. It shows price variations and reveals up or down trends. POscillator makes a price curve based on frequency filters. The procedure makes two price functions by using high-frequency and low-frequency filters separately. Then it adds them together to create a smoothed price curve. The final stage of the indicator converts this smoothed curve to an oscil
FREE
Hi Traders, I coded a free analysis tool for you to use for your trading accounts, because there is nothing more important than tracking and understanding results.  Trade Statistics Dashboard Pro is a real-time on-chart performance analytics panel that gives you instant visibility into your trading results. Built with an institutional-grade dark interface, it displays every critical metric a serious trader needs — without leaving the chart. Whether you are running Expert Advisors, trading man
FREE
My Fibonacci MT5
Ahmad Aan Isnain Shofwan
My Fibonacci MT5 An automated Fibonacci indicator for MetaTrader 5 that combines ZigZag swing detection with comprehensive Expert Advisor integration through a 20-buffer system. More details about data specification and EA integration: https://www.mql5.com/en/blogs/post/764114 Core Features Automated Fibonacci Detection The indicator identifies swing points using configurable ZigZag parameters and draws Fibonacci retracements and extensions automatically. It updates levels as new swing formatio
FREE
Trading Sessions by Mahefa R is an indicator for MetaTrader 5 that visually identifies the four main trading sessions: New York, London, Tokyo, and Sydney . Designed to provide a clean, intuitive, and professional market view, it highlights the most active periods of the Forex market using smart visualization of session ranges , session-specific candle colors , and daily separators . Main Features: Automatic detection of the 4 major sessions New York London Tokyo Sydney Each session is fully c
FREE
AI Volatility Map
Deyna Kurniawan
AI Volatility Map The AI Volatility Map is a professional indicator designed to analyze market activity by measuring spread and tick velocity. It provides traders with a clear view of market energy levels, helping to identify periods of high volatility, low activity, or sudden changes in momentum. This indicator is especially useful for spotting potential breakouts, trend continuations, or dead market conditions. Key Features: Volatility Score (Blue Line): Represents the normalized market volat
FREE
EPoCreW Super ORB H4 Indicator
Livhuwani Neville Ramovha
EPo-CreW Forex Super ORB-H4 지표에 오신 것을 환영합니다! 이 가이드는 시장의 첫 번째 4시간 오프닝 레인지를 기반으로 높은 확률의 거래 기회를 식별하는 이 강력한 도구의 사용 방법을 설명합니다. 초보자든 숙련된 트레이더든, 이 시스템은 보다 자신감 있고 일관된 트레이딩을 할 수 있도록 도와줍니다. 이 제품은 데모 제품이며, 설치일로부터 30일 후에 만료됩니다. 전체 버전은 여기서 확인: https://www.mql5.com/en/market/product/160926?source=Site OR https://t.me/Fundamental_fx 거래: 모든 통화, 금(GOLD) 및 BTCUSD NB: M5 타임프레임으로 전환했는지 확인하세요. 이 인디케이터를 사용하는 데 최적의 타임프레임입니다 트레이딩 전략 전략 1: 브레이크아웃 & 되돌림 (메인 전략) SELL(매도) 설정: 가격이 파란색 라인을 상향 돌파한다 (고점 돌파) 금색 BREAKOUT 화살표가 나
FREE
Andean Oscillator
Leonardo Daniel Isaia
Andean Oscillator – 추세 변동 오실레이터 시장 강도와 방향을 명확하게 보여줍니다. Andean Oscillator 는 각 자산의 상승 및 하락 변동을 측정하는 고급 오실레이터 로, 주요 구성 요소인 Bull(상승) , Bear(하락) 및 신호를 필터링하고 추세를 확인하는 Signal Line 을 포함합니다. 지수 엔벨로프 와 이동 평균을 사용하여 Andean Oscillator는 추세 강도와 가능한 변화를 명확하고 안정적으로 제공하여 거래에서 유리하게 활용할 수 있습니다. 주요 특징 Bull과 Bear 구성 요소: 가격의 상승 및 하락 변동을 반영. 신호선: 잘못된 신호를 필터링하고 추세를 확인. 간단한 해석: 상승 구성 요소가 하락을 초과 → 상승 추세, 하락 구성 요소가 상승을 초과 → 하락 추세. 반응형 오실레이터: 최대 반응성을 위해 지수 엔벨로프와 이동 평균 기반 계산. 모든 자산과 타임프레임에 호환 가능. 사용 방법 추세 식별: Bull > Bear → 시
FREE
SessionMA
Denis Kislicyn
Session MA Created by Denis Kislitsyn | denis@kislitsyn.me | [ kislitsyn.me ]( https://kislitsyn.me/personal/algo ) Version: 1.0 SessionMA is a specialized Moving Average (MA) indicator for MetaTrader 5 that calculates the MA only on bars that fall within a specified session time window. Unlike standard MA indicators that calculate across all available bars, SessionMA filters calculations to include only the data points that occur during your defined trading session. This indicator is particu
FREE
IQuantum
Evgeniy Scherbina
The indicator IQuantum shows trading signals for 10 symbols in the daily chart: AUDCAD, AUDUSD, EURUSD, GBPCAD, GBPCHF, GBPUSD, NZDUSD, USDCAD, USDCHF, and USDJPY. Signals of the indicator are produced by 2 neural models which were trained independently from one another. The inputs for the neural models are normalised prices of the symbols, as well as prices of Gold, Silver and markers of the current day. Each neural model was trained in 2 ways. The Ultimate mode is an overfitted neural model
FREE
A simple indicator showing the size of the spread at the current time, the maximum for the day and the maximum for the entire duration of the indicator. Daily statistics of the maximum spread are also displayed, indicating the time when this spread was fixed. The location of the display of the received information can be changed depending on your preferences and positioned anywhere on the screen. It is possible to output alerts about exceeding the size of the spread specified in the input pa
FREE
Session Break Out
Ashkan Hazegh Nikrou
세션 브레이크 아웃 지표 – 세션 기반 거래를 위한 궁극적인 도구 세션 브레이크 아웃 지표 는 트레이더가 시장 세션을 모니터링하고 시간 기반 거래 전략을 효과적으로 활용할 수 있도록 설계된 최첨단 도구입니다. 전문 트레이더는 시간이 외환 시장에서 중요한 역할을 하며, 거래 세션마다 통화 강도와 변동성이 다르다는 것을 이해합니다. 이 강력한 지표를 통해: 시장 세션 추적 – 활성화된 세션과 열린 시장을 즉시 확인. 세션 고점 & 저점 모니터링 – 돌파 및 반전의 주요 수준을 감시. 새로운 돌파 포착 – 세션의 고점 또는 저점이 돌파될 때 실시간 알림 수신. 모든 시간대에 적응 – 지표를 현지 GMT 설정에 쉽게 맞춤. 세션 겹침 시각화 – 아름다운 그래픽 디스플레이로 세션 전환 명확하게 표시. 과거 세션 박스 – 간단한 체크박스로 과거 차트에서 세션 구조 보기. 즉각적인 매수 & 매도 신호 – 돌파가 발생하면 화면 알림 및 화살표 표시. 왜 세션 브레이크 아웃 지표를 선택해야 할까요?
FREE
Moving Spread
Jose Maria Molina Sanchez
Moving Spread – 실시간 시장 비용 모니터 평균 스프레드를 실시간으로 모니터링하고 고비용 기간의 거래를 피하세요. 이 지표의 기능 Moving Spread 는 시간이 지남에 따라 시장의 평균 스프레드(포인트 단위) 를 측정하여 그 변동을 보여줍니다. 이는 진입 비용이 너무 높을 때를 파악하는 데 필수적인 도구입니다. 이러한 상황에서는 거래 시작 전에 이미 수익이 줄어들 수 있습니다. 왜 이것이 중요한가요? 높은 스프레드는 시장 진입 및 청산 시 더 많은 비용을 지불한다는 것을 의미합니다. 이 지표는 이러한 순간을 식별하고 비용이 과도할 때 거래를 피하는 데 도움을 줍니다. 작동 방식 별도의 창에서 현재 스프레드를 표시 하며, 평균값을 나타내는 빨간색 선이 있습니다. 스프레드가 정의된 임계값(예: > 0)을 초과하면 자동 알림 을 제공합니다. 스캘퍼 및 당일 트레이더에게 이상적 이며, "블리딩"(지속적인 손실)로 인한 숨겨진 손실을 방지하는 데 도움이 됩니
FREE
AZ session scalper
Yurii Shvechikov
AZ session scalper A small but useful session indicator, designed primarily for scalping. Enable the session you plan to trade, watch the reaction of the M5/M15 candlesticks to the level of the previous trading session, and enter. We always look at the reaction of the current session to the previous one. For example, if you trade the Americas, enable the European session, and watch how one session takes away liquidity from another. Important: adjust the time to your broker's time zone in the i
FREE
Visual correlation MT5
Andrey Tatarinov
5 (4)
친애하는 친구, 나는 당신의 관심에 지표   Visual Correlation   를 제시합니다. 서로 다른 통화 쌍의 동작은 서로 연결되어 있습니다.   Visual Correlation   표시기를 사용하면 척도를 유지하면서 하나의 차트에 다른 상품을 표시할 수 있습니다. 양의 상관 관계, 음의 상관 관계 또는 상관 관계 없음을 정의할 수 있습니다. 일부 악기는 다른 악기보다 먼저 움직이기 시작합니다. 이러한 순간은 그래프를 오버레이하여 확인할 수 있습니다. 차트에 상품을 표시하려면 Symbol 필드에 상품 이름을 입력합니다. 서로 다른 통화 쌍의 동작은 서로 연결되어 있습니다.   Visual Correlation   표시기를 사용하면 척도를 유지하면서 하나의 차트에 다른 상품을 표시할 수 있습니다. 양의 상관 관계, 음의 상관 관계 또는 상관 관계 없음을 정의할 수 있습니다. 일부 악기는 다른 악기보다 먼저 움직이기 시작합니다. 이러한 순간은 그래프를 오버레이하
FREE
Apex Dashboard MT5
Carl Christian Nyberg
Transform your MetaTrader 5 chart into a professional trading cockpit. Apex Dashboard   is a high-performance utility designed for serious traders who need complete situational awareness. It moves beyond simple monitoring by providing a comprehensive overview of your account's solvency, performance, and risk exposure in real-time. Unlike standard indicators, Apex Dashboard features a   Persistent Data Engine . It records your historical Peak Drawdown to a local file, ensuring your risk metrics r
FREE
1. What It Does OrderByMagic is a display-only Indicator for MT5. It reads all open positions on your account and shows them grouped by Magic Number directly on the chart — updated every 2 seconds. It never opens, closes, or modifies any trade. 2. Why You Need It The Magic Number collision problem Every EA stamps a Magic Number on the orders it opens so it can identify and manage them later. When you run multiple EAs at the same time, each one must have a unique Magic Number. In practice this o
FREE
이 제품의 구매자들이 또한 구매함
SuperScalp Pro
Van Minh Nguyen
5 (9)
SuperScalp Pro – 고급 다중 필터 스캘핑 인디케이터 시스템 SuperScalp Pro는 클래식 Supertrend와 여러 지능형 확인 필터를 결합한 고급 스캘핑 인디케이터 시스템입니다. 해당 인디케이터는 M1부터 H4까지 모든 타임프레임에서 효율적으로 작동하며, 특히 XAUUSD, BTCUSD 및 주요 외환 통화쌍에 적합합니다. 독립형 시스템으로 사용하거나 기존 거래 전략에 유연하게 통합할 수 있습니다. 이 인디케이터는 11개 이상의 필터를 통합하며, 빠른/느린 EMA, 추세 판별용 3개의 EMA, EMA 기울기(EMA slope), RSI, ADX, 거래량(Volume), VWAP, 볼린저 밴드 돌파(Bollinger Bands Breakout) 및 MACD 다이버전스 필터 등을 포함합니다. 스마트 캔들 필터는 캔들 종가를 확인하여 약한 신호를 제거하고, 3 EMA와 MACD 다이버전스 필터를 결합한 추세 인식 메커니즘은 더 높은 승률의 신호를 선별하는 데 도움을 줍니
Divergence Bomber
Ihor Otkydach
4.89 (83)
이 지표를 구매하신 분께는 다음과 같은 혜택이 무료로 제공됩니다: 각 거래를 자동으로 관리하고, 손절/익절 수준을 설정하며, 전략 규칙에 따라 거래를 종료하는 전용 도우미 툴 "Bomber Utility" 다양한 자산에 맞게 지표를 설정할 수 있는 셋업 파일(Set Files) "최소 위험", "균형 잡힌 위험", "관망 전략" 모드로 설정 가능한 Bomber Utility의 셋업 파일 이 전략을 빠르게 설치, 설정, 시작할 수 있도록 돕는 단계별 영상 매뉴얼 주의: 위의 모든 보너스를 받기 위해서는 MQL5 개인 메시지 시스템을 통해 판매자에게 연락해 주세요. 독창적인 커스텀 지표인 “Divergence Bomber(다이버전스 봄버)”를 소개합니다. 이 지표는 MACD 다이버전스(괴리) 전략을 기반으로 한 올인원(All-in-One) 거래 시스템입니다. 이 기술 지표의 주요 목적은 가격과 MACD 지표 간의 다이버전스를 감지하고, **향후 가격이 어느 방향으로 움직일지를 알려주는
이 지표를 구매하면 제 프로페셔널 트레이드 매니저를 무료로 드립니다. 우선 이 거래 시스템이 리페인팅, 리드로잉 및 레이그 인디케이터가 아니라는 점을 강조하는 것이 중요합니다. 이는 수동 및 로봇 거래 모두에 이상적인 것으로 만듭니다. 온라인 강좌, 설명서 및 프리셋 다운로드. "스마트 트렌드 트레이딩 시스템 MT5"은 새로운 및 경험이 풍부한 트레이더를 위해 맞춤형으로 제작된 종합적인 거래 솔루션입니다. 10개 이상의 프리미엄 인디케이터를 결합하고 7개 이상의 견고한 거래 전략을 특징으로 하여 다양한 시장 조건에 대한 다목적 선택이 가능합니다. 트렌드 추종 전략: 효과적인 트렌드 추이를 타기 위한 정확한 진입 및 손절 관리를 제공합니다. 반전 전략: 잠재적인 트렌드 반전을 식별하여 트레이더가 범위 시장을 활용할 수 있게 합니다. 스캘핑 전략: 빠르고 정확한 데이 트레이딩 및 단기 거래를 위해 설계되었습니다. 안정성: 모든 인디케이터가 리페인팅, 리드로잉 및 레이그가 아니므로 신뢰
Entry In The Zone and SMC Multi Timeframe is a real-time market analysis tool developed based on Smart Money Concepts (SMC). It is designed to analyze market structure, price direction, reversal points, and key zones across multiple timeframes in a systematic way. The system displays Points of Interest (POI) and real-time No Repaint signals, with instant alerts when price reaches key zones or when signals occur within those zones. It functions as both an Indicator and a Signal System (2-in-1), c
FX Trend MT5 NG
Daniel Stein
5 (4)
FX Trend NG: 차세대 멀티 마켓 트렌드 인텔리전스 개요 FX Trend NG 는 다중 시간 프레임 기반의 전문 트렌드 분석 및 시장 모니터링 도구입니다. 몇 초 만에 전체 시장 구조를 파악할 수 있도록 설계되었습니다. 여러 차트를 일일이 전환할 필요 없이, 어떤 종목이 추세에 있는지, 어디에서 모멘텀이 약화되고 있는지, 그리고 어떤 시간 프레임이 서로 정렬되어 있는지 즉시 확인할 수 있습니다. 출시 기념 특별 혜택 – FX Trend NG 를 $30 (6개월) 또는 $80 평생 라이선스 로 이용할 수 있습니다. 이미 Stein Investments 고객이신가요? -> 메시지를 보내 전용 고객 그룹에 참여하세요. 설정이나 사용 방법이 필요하신가요? -> Stein Investments 공식 페이지 를 방문하세요. 1. FX Trend NG가 특별한 이유 3단계 추세 로직 – 단순한 Buy / Sell이 아닙니다 • 대부분의 지표는 Buy 또는 Sell 두 가지 상태만 제
ARICoins
Temirlan Kdyrkhan
ARICoin is a powerful trading companion designed to generate high-probability entry signals with dynamic TP/SL/DP levels based on volatility. Built-in performance tracking shows win/loss stats, PP1/PP2 hits, and success rates all updated live. Key Features: Buy/Sell signals with adaptive volatility bands Real-time TP/SL/DP levels based on ATR Built-in MA Filter with optional ATR/StdDev volatility Performance stats panel (Success, Profit/Loss, PP1/PP2) Alerts via popup, sound, push, or email Cust
Grabber System MT5
Ihor Otkydach
4.82 (22)
탁월한 기술적 지표인 Grabber를 소개합니다. 이 도구는 즉시 사용 가능한 “올인원(All-Inclusive)” 트레이딩 전략으로 작동합니다. 하나의 코드 안에 강력한 시장 기술 분석 도구, 매매 신호(화살표), 알림 기능, 푸시 알림이 통합되어 있습니다. 이 인디케이터를 구매하신 모든 분들께는 다음의 항목이 무료로 제공됩니다: Grabber 유틸리티: 오픈 포지션을 자동으로 관리하는 도구 단계별 영상 매뉴얼: 설치, 설정, 그리고 실제 거래 방법을 안내 맞춤형 세트 파일: 인디케이터를 빠르게 자동 설정하여 최고의 성과를 낼 수 있도록 도와줍니다 다른 전략은 이제 잊어버리세요! Grabber만이 여러분을 새로운 트레이딩의 정점으로 이끌어 줄 수 있습니다. Grabber 전략의 주요 특징: 거래 시간 프레임: M5부터 H4까지 거래 가능한 자산: 어떤 자산이든 사용 가능하지만, 제가 직접 테스트한 종목들을 추천드립니다 (GBPUSD, GBPCAD, GBPCHF, AUDCAD, AU
Gold Entry Sniper
Tahir Mehmood
5 (5)
Gold Entry Sniper – 골드 스캘핑 & 스윙 트레이딩을 위한 전문 다중 시간 프레임 ATR 대시보드 Gold Entry Sniper 는 XAUUSD 및 기타 종목에 대해 정확한 매수/매도 신호 를 제공하는 고급 MetaTrader 5 지표입니다. ATR 트레일링 스톱 로직 과 다중 시간 프레임 분석 을 기반으로 설계되어 스캘핑과 스윙 트레이딩 모두에 적합합니다. 주요 기능 및 장점 다중 시간 프레임 분석 – M1, M5, M15 추세를 한눈에 확인. ATR 기반 트레일링 스톱 – 변동성에 따라 자동 조정. 전문 차트 대시보드 – 신호 상태, ATR 레벨, 회귀선, 매매 방향 표시. 명확한 매수/매도 마커 – 자동 화살표와 텍스트 라벨. 종료 알림 & 거래 관리 – 수익 보호를 위한 자동 종료 감지. 완전 사용자 설정 가능 – 대시보드 위치, 색상, ATR/회귀선 파라미터 조정. 골드(XAUUSD) 최적화 – M1~M15 스캘핑에 완벽, 외환/지수/암호화폐에도 적용 가능.
Quantum TrendPulse
Bogdan Ion Puscasu
5 (22)
SuperTrend   ,   RSI   ,   Stochastic   의 힘을 하나의 포괄적인 지표로 결합하여 트레이딩 잠재력을 극대화하는 궁극의 트레이딩 도구   인 Quantum TrendPulse를   소개합니다. 정밀성과 효율성을 추구하는 트레이더를 위해 설계된 이 지표는 시장 추세, 모멘텀 변화, 최적의 진입 및 종료 지점을 자신 있게 식별하는 데 도움이 됩니다. 주요 특징: SuperTrend 통합:   주요 시장 추세를 쉽게 따라가고 수익성의 물결을 타세요. RSI 정밀도:   매수 과다 및 매도 과다 수준을 감지하여 시장 반전 시점을 파악하는 데 적합하며 SuperTrend 필터로 사용 가능 확률적 정확도:   변동성이 큰 시장에서 숨겨진 기회를 찾기 위해 확률적 진동   을 활용하고 SuperTrend의 필터로 사용 다중 시간대 분석:   M5부터 H1 또는 H4까지 다양한 시간대에 걸쳐 시장을 최신 상태로 유지하세요. 맞춤형 알림:   맞춤형 거래 조건이 충족되면
AriX
Temirlan Kdyrkhan
1 (4)
AriX Indicator for MT5 A powerful trend-following and signal-evaluation tool AriX is a custom MT5 indicator that combines Moving Averages and ATR-based risk/reward logic to generate clear buy/sell signals. It visualizes dynamic SL/TP levels, evaluates past trade outcomes, and displays win/loss statistics in a clean on-chart panel. Key features include: Buy/Sell signals based on MA crossovers ATR-based SL/TP1/TP2/TP3 levels with visual lines and labels Signal outcome tracking with real-time stat
Atomic Analyst MT5
Issam Kassas
4.03 (30)
우선적으로 언급할 점은이 거래 지표가 다시 그리지 않고 지연되지 않으며 이를 통해 수동 및 로봇 거래 모두에 이상적이라는 점입니다. 사용자 매뉴얼: 설정, 입력 및 전략. Atomic Analyst는 가격의 강도와 모멘텀을 활용하여 시장에서 더 나은 이점을 찾는 PA Price Action Indicator입니다. 고급 필터를 장착하여 잡음과 거짓 신호를 제거하고 거래 잠재력을 높이는 데 도움이 됩니다. 복잡한 지표의 다중 레이어를 사용하여 Atomic Analyst는 차트를 스캔하고 복잡한 수학적 계산을 간단한 신호와 색상으로 변환하여 초보 트레이더가 이해하고 일관된 거래 결정을 내릴 수 있도록합니다. "Atomic Analyst"는 새로운 및 경험이 풍부한 트레이더를위한 종합적인 거래 솔루션입니다. 프리미엄 지표와 최고 수준의 기능을 하나의 거래 전략에 결합하여 모든 종류의 트레이더에 대한 다재다능한 선택지가되었습니다. 인트라데이 거래 및 스캘핑 전략 : 빠르고 정확한 일일
Power Candles MT5
Daniel Stein
5 (6)
Power Candles – 모든 시장을 위한 강도 기반 진입 신호 Power Candles 는 Stein Investments의 검증된 강도 분석을 가격 차트에 직접 제공합니다. 가격 움직임에만 반응하는 대신, 각 캔들은 실제 시장 강도를 기준으로 색상화되어 모멘텀 형성, 강도 가속, 명확한 추세 전환을 즉시 파악할 수 있습니다. 모든 시장을 위한 단일 로직 Power Candles는 모든 거래 심볼 에서 자동으로 작동합니다. 현재 심볼이 Forex인지 비-Forex 시장인지 자동으로 감지하여 내부적으로 적절한 강도 모델을 적용합니다. Forex 및 Gold 는 FX Power Delta 값을 사용합니다 (절대값 범위 최대 100) 지수, 크립토 및 CFD 는 IX Power Strength 값을 사용합니다 (절대값 범위 최대 50) 필요한 강도 계산은 Power Candles에 완전히 내장되어 있습니다. 캔들 색상이나 신호 로직을 위해 추가 인디케이터는 필요하지 않습니다. 가격
Game Changer Indicator mt5
Vasiliy Strukov
5 (19)
Game Changer는 모든 금융 상품에 적용 가능한 혁신적인 추세 지표로, MetaTrader를 강력한 추세 분석 도구로 탈바꿈시켜 줍니다. 모든 시간대에서 작동하며 추세 식별, 잠재적 반전 신호 제공, 트레일링 스톱 기능, 그리고 신속한 시장 대응을 위한 실시간 알림 기능을 제공합니다. 숙련된 전문가든 이제 막 시작하는 초보자든, Game Changer는 추세의 역학을 명확하게 이해하고 자신감 있고 규율 있는 거래를 할 수 있도록 도와줍니다. 이 지표는 차트 재구성 기능을 지원합니다. 구매 후 즉시 연락 주시면 특별 보너스를 드립니다. Strong Support 및 Trend Scanner 지표를 무료로 제공해 드립니다. [email protected]으로 메시지를 보내주세요. 참고로, 저는 텔레그램에서 EA나 특별 세트를 판매하지 않습니다. 모든 EA는 MQL5에서만 사용 가능하며, 세트 파일은 제 블로그(여기)에서만 다운로드하실 수 있습니다. 사기꾼을 조심하시고 다른 사
Trend Screener Pro MT5
STE S.S.COMPANY
4.84 (101)
트렌드 표시기, 트렌드 트레이딩 및 필터링을 위한 획기적인 고유 솔루션, 하나의 도구 안에 내장된 모든 중요한 트렌드 기능! Forex, 상품, 암호 화폐, 지수 및 주식과 같은 모든 기호/도구에 사용할 수 있는 100% 다시 칠하지 않는 다중 시간 프레임 및 다중 통화 표시기입니다. Trend Screener는 차트에 점이 있는 화살표 추세 신호를 제공하는 효율적인 지표 추세 추종 지표입니다. 추세 분석기 표시기에서 사용할 수 있는 기능: 1. 트렌드 스캐너. 2. 최대 이익 분석이 있는 추세선. 3. 추세 통화 강도 측정기. 4. 경고가 있는 추세 반전 점. 5. 경고가 있는 강력한 추세 점. 6. 추세 화살표 Trend Screener Indicator가 있는 일일 분석 예, 일일 신호 성능...등은 여기에서 찾을 수 있습니다. 여기를 클릭하십시오. LIMITED TIME OFFER : Trend Screener Indicator는 50$ 및 평생 동안만 사용할 수 있습니다.
소개       Quantum Breakout PRO   , 브레이크아웃 존 거래 방식을 변화시키는 획기적인 MQL5 지표! 13년 이상의 거래 경험을 가진 숙련된 트레이더 팀이 개발한       퀀텀 브레이크아웃 PRO       혁신적이고 역동적인 브레이크아웃 존 전략으로 거래 여정을 새로운 차원으로 끌어올리도록 설계되었습니다. Quantum Breakout Indicator는 5개의 이익 목표 영역이 있는 브레이크아웃 영역의 신호 화살표와 브레이크아웃 상자를 기반으로 한 손절 제안을 제공합니다. 초보자 거래자와 전문 거래자 모두에게 적합합니다. Quantum EA 채널:       여기를 클릭하세요 중요한! 구매 후 설치 매뉴얼을 받으려면 개인 메시지를 보내주십시오. 추천: 기간: M15 통화쌍: GBPJPY, EURJPY, USDJPY,NZDUSD, XAUUSD 계정 유형: 스프레드가 매우 낮은 ECN, Raw 또는 Razor 브로커 시간: GMT +3 중개인 :
Smart Stop Indicator – 차트 위에서 직접 작동하는 지능형 스톱로스 시스템 개요 Smart Stop Indicator는 감이나 추측이 아닌 명확하고 체계적인 방식으로 스톱로스를 설정하고 싶은 트레이더를 위한 맞춤형 솔루션입니다. 이 도구는 클래식 프라이스 액션 논리(고점, 저점 구조)와 현대적인 브레이크아웃 인식을 결합하여 실제로 가장 논리적인 다음 스톱 레벨을 정확히 식별합니다. 추세, 박스권, 빠른 브레이크아웃 상황 등 어떤 시장에서도 인디케이터는 최적의 SL 구역과 상태(“new”, “broken”, “valid”)를 차트에 직접 표시합니다. 새로운 기능으로 SL 거리의 %ADR 표시가 추가되었습니다. 핵심 기능 자동 시장구조 기반 스톱 설정 • 시장 구조와 실시간 가격 움직임을 기반으로 의미 있는 스톱로스 레벨을 자동으로 탐지합니다. 스마트 브레이크아웃 감지 • 빠른 방향 변화나 돌파 상황에서도 불필요한 조기 스톱 조정을 강요하지 않으며 유연하게 반응합
Entry Points Pro for MT5
Yury Orlov
4.48 (138)
다시 색을 칠하지 않고 거래에 진입할 수 있는 정확한 신호를 제공하는 MT5용 지표입니다. 외환, 암호화폐, 금속, 주식, 지수 등 모든 금융 자산에 적용할 수 있습니다. 매우 정확한 추정값을 제공하고 매수와 매도의 가장 좋은 시점을 알려줍니다. 하나의 시그널로 수익을 내는 지표의 예와 함께 비디오 (6:22)시청하십시오! 대부분의 거래자는 Entry Points Pro 지표의 도움으로 첫 거래 주 동안 트레이딩 결과를 개선합니다. 저희의   Telegram Group 을 구독하세요! Entry Points Pro 지표의 좋은점. 재도색이 없는 진입 신호 신호가 나타나고 확인되면(시그널 캔들이 완성된 경우) 신호는 더 이상 사라지지 않습니다. 여타 보조지표의 경우 신호를 표시한 다음 제거되기 때문에 큰 재정적 손실로 이어집니다. 오류 없는 거래 게시 알고리즘을 통해 트레이드(진입 또는 청산)를 할 이상적인 순간을 찾을 수 있으며, 이를 통해 이를 사용하는 모든 거래자의 성공률이
RFI levels PRO MT5
Roman Podpora
3.67 (3)
이 지표는 추세 반전 지점과 가격 반등 영역을 정확하게 보여줍니다.       주요 투자자들   . 새로운 트렌드가 형성되는 곳을 파악하고 최대한 정확하게 의사결정을 내리며 모든 거래를 완벽하게 통제합니다. TREND LINES PRO   지표와 함께 사용할 때 최대의 잠재력을 발휘합니다.  VERSION MT4 지표가 보여주는 내용: 새로운 추세의 시작 시 활성화되는 반전 구조 및 반전 수준. 최소한의 위험 대비 수익률을 갖는 이익 실현   (TAKE PROFIT)   및   손절매(STOP LOSS)   레벨 표시       RR 1:2   . 지능형 손실 감소 로직이 적용된 손절매 기능. 지정된 지표에서 두 가지 추세 유형에 대한 반전 패턴을 표시합니다. 지표: 트렌드를 따라   트렌드 라인 프로   (글로벌 트렌드 변화) 트렌드 프로   (빠른 트렌드 변화) 간단하고 효과적입니다       스캐너       실시간 추세 (신규). 다중 시간 프레임 도구 필터링. 표시하다  
Order Block Pro MT5
N'da Lemissa Kouame
Order Block Pro (MQL5) – 버전 1.0 작성자: KOUAME N'DA LEMISSA 플랫폼: MetaTrader 5 설명: Order Block Pro 는 차트에서 **강세 및 약세 오더 블록(Order Blocks)**을 자동으로 감지하는 고급 지표입니다. 횡보 캔들 이후 강한 상승/하락 캔들을 분석하여 가격이 급격히 움직일 가능성이 있는 주요 구간을 표시합니다. 트레이더에게 적합: 정확한 진입 및 청산 지점을 찾고 싶은 경우 동적 지지 및 저항 구간을 파악하고 싶은 경우 리스크 관리 및 거래 전략을 향상시키고 싶은 경우 주요 기능: 강세 OB 감지: 횡보 캔들 후 강한 상승이 발생하면 차트에 녹색 화살표 표시 약세 OB 감지: 횡보 캔들 후 강한 하락이 발생하면 차트에 빨간 화살표 표시 완전한 사용자 정의 가능: 횡보 캔들의 최대 실체 비율 ( BodyMaxRatio ) 다음 캔들의 최소 비율로 움직임 확인 ( NextCandleMinPct ) 차트 화살표
Trend Lines PRO MT5
Roman Podpora
5 (1)
트렌드 라인즈 프로       이 지표는 시장이 실제로 어떤 방향으로 전환되는지 파악하는 데 도움이 됩니다. 실제 추세 반전 지점과 주요 시장 참여자들이 다시 진입하는 지점을 보여줍니다. 보시다시피       BOS 라인       복잡한 설정이나 불필요한 노이즈 없이 더 높은 시간대의 추세 변화와 주요 레벨을 확인할 수 있습니다. 신호는 차트에 다시 그려지지 않고 캔들이 마감된 후에도 계속 표시됩니다. MT4 버전   -   RFI LEVELS PRO   표시기   와 결합 시 최대 잠재력을 발휘합니다. 지표가 보여주는 내용: 실제 변화       추세(BOS 라인) 한 번 신호가 나타나면 그 신호는 계속 유효합니다! 이는 신호를 발생시킨 후 변경될 수 있는 리페인팅 방식의 지표와 중요한 차이점입니다. 리페인팅 방식의 지표는 잠재적으로 자금 손실로 이어질 수 있습니다. 이제 더욱 높은 확률과 정확도로 시장에 진입할 수 있습니다. 또한 화살표가 나타난 후 목표가(익절)에 도달하거나
ARIPoint
Temirlan Kdyrkhan
ARIPoint is a powerful trading companion designed to generate high-probability entry signals with dynamic TP/SL/DP levels based on volatility. Built-in performance tracking shows win/loss stats, PP1/PP2 hits, and success rates all updated live. Key Features: Buy/Sell signals with adaptive volatility bands Real-time TP/SL/DP levels based on ATR Built-in MA Filter with optional ATR/StdDev volatility Performance stats panel (Success, Profit/Loss, PP1/PP2) Alerts via popup, sound, push, or email Cu
FX Power MT5 NG
Daniel Stein
5 (31)
FX Power: 통화 강세 분석으로 더 스마트한 거래 결정을 개요 FX Power 는 어떤 시장 상황에서도 주요 통화와 금의 실제 강세를 이해하기 위한 필수 도구입니다. 강한 통화를 매수하고 약한 통화를 매도함으로써 FX Power 는 거래 결정을 단순화하고 높은 확률의 기회를 발견합니다. 트렌드를 따르거나 극단적인 델타 값을 사용해 반전을 예측하고자 한다면, 이 도구는 귀하의 거래 스타일에 완벽히 적응합니다. 단순히 거래하지 말고, FX Power 로 더 스마트하게 거래하세요. 1. FX Power가 거래자에게 매우 유용한 이유 통화와 금의 실시간 강세 분석 • FX Power 는 주요 통화와 금의 상대적 강세를 계산하고 표시하여 시장 역학에 대한 명확한 통찰력을 제공합니다. • 어떤 자산이 앞서고 있고 어떤 자산이 뒤처지는지 모니터링하여 보다 현명한 거래 결정을 내릴 수 있습니다. 포괄적인 멀티 타임프레임 뷰 • 단기, 중기 및 장기 타임프레임에서 통화와 금의 강세를
Market Flow Pro
Gabriele Sabatino
4 (1)
Market Flow Pro Market Flow Pro is an intelligent trading advisor for the MetaTrader 5 platform, designed for automatic trading on financial markets using algorithmic analysis and strict risk management. -Key features: - Fully automatic trading 24/5 - Adaptive trend and momentum entry algorithm -  Built-in risk management - Flexible lot settings (fixed/auto-calculation) - Support for major currency pairs and indices - Optimised for operation on various timeframes  How it works Market
Azimuth Pro
Ottaviano De Cicco
5 (4)
LAUNCH PROMO Azimuth Pro price is initially set at 299$ for the first 100 buyers. Final price will be 499$ . THE DIFFERENCE BETWEEN RETAIL AND INSTITUTIONAL ENTRIES ISN'T THE INDICATOR — IT'S THE LOCATION. Most traders enter at arbitrary price levels, chasing momentum or reacting to lagging signals. Institutions wait for price to reach structured levels where supply and demand actually shift. Azimuth Pro maps these levels automatically: swing-anchored VWAP, multi-timeframe structure lines, an
Trend indicator AI mt5
Ramil Minniakhmetov
5 (15)
트렌드 인공 지능 지표는 실행 가능한 진입 점 및 반전 경고와 추세 식별을 결합하여 상인의 시장 분석을 향상시킬 훌륭한 도구입니다. 이 표시기는 사용자가 자신감과 정밀도로 외환 시장의 복잡성을 탐색 할 수 있도록 지원합니다 기본 신호 외에도 트렌드 인공 지능 지표는 풀백 또는 되돌림 중에 발생하는 2 차 진입 점을 식별하여 거래자가 기존 트렌드 내에서 가격 수정을 활용할 수 있도록합니다. 중요한 장점: ·작동 4 및 5 *명확한 구매 또는 판매 신호 *다시 칠하지 않습니다 *모든 자산에서 작동 나는 전보 사기에 개 또는 세트를 판매하지 않도록주의. 모든 설정은 블로그에 여기에 무료.  중요! 지침 및 보너스를 얻기 위해 구입 후 즉시 저에게 연락! 진짜 가동 감시는 뿐 아니라 나의 다른 제품 여기에서 찾아낼 수 있습니다: https://www.mql5.com/en/users/mechanic/seller&nbsp ; 설정 및 입력: 모든 자산에 대해 기본 설정을 권
FX Dynamic MT5
Daniel Stein
5 (5)
FX Dynamic: 맞춤형 ATR 분석으로 변동성과 트렌드를 파악하세요 개요 FX Dynamic 는 Average True Range(ATR) 계산을 활용하여 트레이더에게 일간 및 일중 변동성에 대한 뛰어난 인사이트를 제공하는 강력한 도구입니다. 80%, 100%, 130%와 같은 명확한 변동성 임계값을 설정함으로써 시장이 평소 범위를 초과할 때 빠르게 경고를 받고, 유망한 수익 기회를 재빨리 식별할 수 있습니다. FX Dynamic 는 브로커의 시간대를 인식하거나 수동으로 조정할 수 있으며, 변동성 측정 기준을 일관되게 유지하며, MetaTrader 플랫폼과 완벽하게 연동되어 실시간 분석을 지원합니다. 1. FX Dynamic이 트레이더에게 매우 유용한 이유 실시간 ATR 인사이트 • 하루 및 일중 변동성을 한눈에 모니터링하세요. ATR의 80%, 100%, 130% 임계값이 도달 또는 초과되면, 시장의 중요한 지점에 있음을 알 수 있습니다. • 변동성이 완전히 폭발하기
Market Structure Order Block Dashboard MT5 는 MetaTrader 5용 MT5 인디케이터 로, 시장 구조 및 ICT / Smart Money Concepts에 기반합니다: HH/HL/LH/LL , BOS , ChoCH 뿐 아니라 Order Blocks , Fair Value Gaps (FVG) , 유동성 (EQH/EQL, sweeps), 세션 / Kill Zones , 그리고 Volume Profile 을 통합하여 콤팩트한 컨플루언스 대시보드를 제공합니다. 중요: 본 제품은 분석 도구 입니다. 자동 매매를 실행하지 않습니다( EA가 아님 ). 구매자 보너스 구매 후 제 스토어에서 보너스 인디케이터 2개 를 (선택하여) 무료로 받을 수 있습니다. 보너스 수령 방법: 1) 본 제품에 대한 솔직한 리뷰를 남겨주세요. 2) MQL5 메시지로 BONUS MSOB + 선택한 인디케이터 2개 이름 을 보내주세요. 주요 기능 시장 구조: HH/HL/LH/LL
Trend Forecaster
Alexey Minkov
5 (7)
The Trend Forecaster indicator utilizes a unique proprietary algorithm to determine entry points for a breakout trading strategy. The indicator identifies price clusters, analyzes price movement near levels, and provides a signal when the price breaks through a level. The Trend Forecaster indicator is suitable for all financial assets, including currencies (Forex), metals, stocks, indices, and cryptocurrencies. You can also adjust the indicator to work on any time frames, although it is recommen
FX Levels MT5
Daniel Stein
5 (13)
FX Levels: 모든 시장을 위한 뛰어난 정확도의 지지와 저항 간단 요약 통화쌍, 지수, 주식, 원자재 등 어떤 시장이든 믿을 만한 지지·저항 레벨을 찾고 싶나요? FX Levels 는 전통적인 “Lighthouse” 기법과 첨단 동적 접근을 결합해, 거의 보편적인 정확성을 제공합니다. 실제 브로커 경험을 반영하고, 자동화된 일별 업데이트와 실시간 업데이트를 결합함으로써 FX Levels 는 가격 반전 포인트를 파악하고, 수익 목표를 설정하며, 자신 있게 트레이드를 관리할 수 있게 돕습니다. 지금 바로 시도해 보세요—정교한 지지/저항 분석이 어떻게 여러분의 트레이딩을 한 단계 끌어올릴 수 있는지 직접 확인하세요! 1. FX Levels가 트레이더에게 매우 유용한 이유 뛰어난 정확도의 지지·저항 존 • FX Levels 는 다양한 브로커 환경에서도 거의 동일한 존을 생성하도록 설계되어, 데이터 피드나 시간 설정 차이로 인한 불일치를 해소합니다. • 즉, 어떤 브로커를 사용하
Ultimate SMC Indicator
Hicham Mahmoud Almoustafa
1 (1)
Ultimate SMC PRO – Smart Money Concepts Indicator (Order Blocks, FVG, Liquidity, BOS) for MetaTrader 5 Ultimate SMC PRO is a professional trading indicator designed to visualize Smart Money Concepts directly on the chart. The indicator combines several institutional trading tools in one system to help traders identify potential high-probability trading zones. ULTIMATE SMC INDICATOR — COMPLETE TRADING GUIDE The indicator analyzes market structure, liquidity behavior and price imbalance to highl
제작자의 제품 더 보기
Trend Lines v2 MT5
Quang Huy Quach
5 (1)
Trend Lines v2 MT5 is an intelligent auto trendline indicator that instantly detects key dynamic support and resistance zones. Built on pivot high/low structure, it delivers a clear and accurate view of market trends across all timeframes. Features Fully automatic trendline drawing based on precise pivot points. Filters out noise – only clean and reliable trendlines are shown. Control the number of lines to keep your chart neat and easy to read. Flexible customization: colors, line thickness, ra
FREE
Indicator Guide: Key Price Levels & Structure Shifts 1. Description The indicator is a technical analysis tool for the MetaTrader 5 platform. It is designed to automatically identify specific price movements and to highlight corresponding price zones based on preceding price action. This provides a visualization of key price areas according to the indicator's internal logic. 2. Visual Elements & Their Identification The indicator identifies and draws several types of visual elements on the chart
FREE
Breakout Finder MT5
Quang Huy Quach
5 (1)
The "Breakout Finder" is a technical indicator designed to automatically identify potential price breakouts and breakdowns on a chart. The highlight of this indicator is its robust signal filtering system, which helps traders avoid false signals (fakeouts) and focus on higher-probability trading opportunities. Key Features Automatic Pivot Point Detection: The indicator automatically identifies significant pivot highs and lows on the chart to establish potential support and resistance levels. Bre
FREE
Support Resistance Dynamic
Quang Huy Quach
5 (2)
The "Support Resistance Dynamic" indicator is a powerful technical analysis tool for the MetaTrader 5 platform, designed to automatically identify and plot dynamic Support and Resistance zones on price charts. This indicator helps traders easily recognize important price levels, potential reversal points, or breakout areas, thereby enabling more informed trading decisions. 2. Key Features Dynamic S/R Identification : Automatically identifies support and resistance zones based on an advanced Pivo
FREE
The Linear Regression Channel is a powerful technical analysis tool that helps visually identify the prevailing trend and potential price zones. Essentially, the indicator performs two main functions: It draws a trendline through the center of price action over a specified period. This line is calculated using the linear regression method, which results in the best possible "line of best fit" for the price data. From this center line, the indicator plots two parallel lines above and below, creat
FREE
The Supertrend indicator is a trend-following technical analysis tool designed to help traders identify the direction of market trends and potential entry/exit points. It operates based on price data and Average True Range (ATR) to create a dynamic signal line that changes color depending on the current trend. Green color: Indicates an uptrend. Red color: Indicates a downtrend. Supertrend is a useful indicator for both short-term and long-term trading, helping to filter out market noise and focu
FREE
Scalping PullBack Signal
Quang Huy Quach
5 (1)
1. Overview The Scalping PullBack Signal indicator is a powerful technical analysis tool designed to help traders identify scalping opportunities based on potential pullback and reversal signals. This tool is particularly useful on lower timeframes (below 15 minutes) but can also be applied on higher timeframes for longer-term trades. This indicator integrates several key analytical components, providing a comprehensive view of trends and potential entry/exit points, helping you make quick and e
FREE
RSI Multi Timeframe MT5
Quang Huy Quach
5 (1)
The MultiFrameRSIIndicator is a powerful MetaTrader 5 (MT5) indicator that leverages the Relative Strength Index (RSI) to analyze trends across multiple timeframes. This indicator synchronizes RSI-based trend signals from up to nine timeframes (M1, M5, M15, M30, H1, H4, D1, W1, MN1) and presents them with clear visual feedback, including a colored RSI line, signal arrows, and a customizable dashboard. Ideal for traders seeking momentum-based trend confirmation. Features Multi-Timeframe Analysis
FREE
The Pivot Point Supertrend indicator is a technical analysis tool designed for the MetaTrader 5 (MT5) platform. It combines two popular analytical methods: Pivot Points: Uses significant historical price highs and lows to identify potential support and resistance zones. These points are objective and stable. Supertrend: A well-known trend-following indicator that helps identify the current market trend and provides dynamic stop-loss levels. Indicator's Goal: By using the stability of Pivot Point
FREE
The MTF (Multi-Timeframe) Candles indicator is a powerful tool that allows you to display candles from a higher timeframe (e.g., H1, H4, D1) directly on a lower timeframe chart (e.g., M5, M15, M30). The Problem It Solves: Instead of constantly switching back and forth between charts to analyze the main trend and detailed price action, this indicator merges both perspectives into one. You can instantly see the "big picture" while staying focused on trading signals on your current timeframe. Core
FREE
The MultiFrameTrendAnalyzer is a versatile MetaTrader 5 (MT5) indicator designed to provide multi-timeframe trend analysis using Moving Average (MA) crossovers. This indicator synchronizes trend signals across multiple timeframes (M1, M5, M15, M30, H1, H4, D1, W1, MN1) and displays them with intuitive visual cues, including a colored trend line, signal arrows, and a customizable dashboard. Features Multi-Timeframe Analysis : Evaluates trends across up to nine timeframes, allowing traders to conf
FREE
Welcome to Ultimate MA MTF , a multi-functional Moving Average (MA) indicator converted from the original TradingView version by ChrisMoody and upgraded with many powerful features. This is not just a typical MA line. It is a comprehensive technical analysis tool designed to provide traders with deep insights into trends, volatility, and potential trading signals, all within a single indicator. Key Features 8 Moving Average Types: Full support for the most popular MA types (SMA, EMA, WMA, HullMA
FREE
TMA Overlay
Quang Huy Quach
TMA Overlay Indicator for MT5 - User Guide 1. Introduction TMA Overlay is a versatile technical analysis indicator for the MetaTrader 5 platform. The indicator's goal is to provide traders with a comprehensive overview of the trend, potential entry signals, and key trading sessions, all integrated into a single chart. This is not a trading system, but a comprehensive analysis tool designed to help you make more informed decisions. 2. Core Indicator Components The indicator consists of multiple c
FREE
RSI Ultimate MTF
Quang Huy Quach
5 (1)
1. Introduction The CM_Ultimate_RSI_MTF is a powerful and versatile custom indicator for MetaTrader 5, designed to enhance your Relative Strength Index (RSI) analysis. It provides multi-timeframe (MTF) capabilities, visual signals, and customizable alerts, making it an invaluable tool for traders seeking to identify overbought/oversold conditions, trend strength, and potential entry/exit points across various timeframes. 2. Key Features Multi-Timeframe (MTF) Analysis: Allows you to view RSI from
FREE
1. Introduction Smart Volume S/R Pro is a powerful technical analysis tool designed for the MetaTrader 5 platform. Unlike traditional Support & Resistance (S/R) indicators that rely on price peaks and troughs, this indicator automatically identifies critical S/R zones based on a core factor: Trading Volume . Core Principle: Price levels that witnessed exceptionally high trading volume in the past will often become significant psychological zones, where the price is likely to react strongly (eith
FREE
The Vix_Fix indicator, or "Vix Fix," is a tool designed to identify potential market bottoms. It operates on the principle of measuring extreme fear or pessimism among the crowd, which are moments when the market often has a high probability of reversing to the upside. Main Purpose: To help traders find high-probability BUY (Long) entry points by identifying when the market is "oversold." How it Works In simple terms, the Vix Fix measures the distance between the current bar's Low and the Highes
FREE
The "Volume Range Profile with Fair Value" (VRPFV) indicator is a powerful volume analysis tool designed to help traders better understand market structure and identify key price areas where significant institutional activity occurs. Instead of just looking at volume on individual candlesticks, VRPFV analyzes the distribution of volume by price level within a specific time range, providing deep insights into the "footprint" of smart money. VRPFV consists of the following core components: Upper &
FREE
The WaveTrend Oscillator indicator is an enhanced version of the classic WaveTrend Oscillator, a momentum indicator. It is designed to identify overbought/oversold conditions and provide potential trend reversal signals. The core difference in this version is the application of a data "normalization" algorithm. This ensures the indicator's oscillation lines remain balanced around the zero line, causing the indicator window to always stay naturally centered. This is especially useful when trading
FREE
Ultimate EMA
Quang Huy Quach
Multi-Period EMA is a convenient indicator that displays multiple Exponential Moving Averages (EMAs) on a single chart. It is designed to help traders easily identify market trends and key crossover points without the need to add multiple individual EMA indicators. Key Features: Multiple EMAs in one: Simplifies chart analysis by combining several EMA lines into one indicator. Fully customizable: Easily change the period (default 20, 50, 100, 200), color, and thickness of each EMA line. Clean in
FREE
1. Introduction The Market Squeeze Momentum Indicator (SQZMOM_LB) is a powerful technical analysis tool designed to help traders identify periods of low market volatility (the "squeeze" phase) and predict the direction and strength of price momentum after the squeeze ends. This indicator combines the principles of Bollinger Bands and Keltner Channels to detect changes in market volatility, along with a momentum oscillator to measure buying/selling pressure. 2. Key Components of the Indicator The
FREE
MACD Multi Timeframe MT5
Quang Huy Quach
5 (1)
The Multi-Frame MACD Indicator is a robust MetaTrader 5 (MT5) indicator that utilizes the Moving Average Convergence Divergence (MACD) to analyze trends across multiple timeframes. This indicator synchronizes MACD-based trend signals from up to nine timeframes (M1, M5, M15, M30, H1, H4, D1, W1, MN1) and presents them with clear visual cues, including a colored MACD line, signal arrows, and a customizable dashboard. Perfect for traders seeking momentum and trend reversal insights. Features Multi-
FREE
Fibonacci Bollinger Bands (FBB) Indicator - User Manual 1. Introduction Fibonacci Bollinger Bands (FBB) is a technical analysis indicator that combines three tools: Bollinger Bands , Fibonacci Ratios , and the Volume-Weighted Moving Average (VWMA) . The purpose of this indicator is to provide a multi-dimensional view of the market by helping to identify: Dynamic support and resistance zones. The general market trend. Volatility levels and potential accumulation phases (squeezes). Price breakouts
FREE
MultiFrame Pivot MT5
Quang Huy Quach
5 (1)
MultiFrame Pivot: A Multi-Timeframe Analysis Tool MultiFrame Pivot is an analysis indicator designed to provide an overview of the market based on Pivot Points across multiple timeframes. The indicator synthesizes information from different timeframes to give you a more comprehensive view of important price levels. KEY FEATURES: Multi-Timeframe Analysis: MultiFrame Pivot allows you to simultaneously monitor the price's status relative to Pivot Points (PP), Support 1 (S1), and Resistance 1 (R1)
FREE
MultiFrame Volume Trend (MFVI) is a powerful VWAP-based indicator that displays volume trends across multiple timeframes in a clean, easy-to-read dashboard directly on your chart. Instantly capture the overall market direction in just seconds. Features Multi-timeframe VWAP analysis from M1 to MN1. Dashboard panel shows the trend state of each timeframe at a glance. Plots VWAP line and buy/sell arrows directly on the chart. Fully customizable: colors, line width, panel position, arrow symbols. Bu
FREE
ATR Dynamic Stop
Quang Huy Quach
1. Overview The ATR Dynamic Stop (CE) is a powerful technical indicator designed to help traders identify and follow market trends. Its core function is to provide a dynamic trailing stop-loss based on price volatility, as measured by the Average True Range (ATR) indicator. The main objectives of the ATR Dynamic Stop are: Profit Optimization: It helps you ride a strong trend by setting a reasonable stop-loss, preventing premature exits due to minor market noise and fluctuations. Risk Management:
FREE
Volume Flow Indicator (VFI) - User Manual 1. General Introduction The Volume Flow Indicator (VFI) is an advanced technical oscillator designed to measure the strength and sustainability of a price trend by incorporating both price and volume data. Developed based on the concepts of On-Balance Volume (OBV) but with significant improvements, the VFI provides deeper insight into money flow and the conviction behind price movements. This indicator is not an automated trading system but a powerful an
FREE
MultiFrame MA
Quang Huy Quach
5 (1)
MultiFrame MA: A Multi-Timeframe Trend Indicator MultiFrame MA is a trend analysis indicator designed to provide a comprehensive market overview across various timeframes. Instead of relying on a single timeframe, this tool synthesizes information from multiple charts, giving users a holistic and reliable perspective. KEY FEATURES: Multi-Timeframe Analysis: The indicator analyzes data from various timeframes, from M1 up to Monthly, to help users identify trend confluence at different levels. MA
FREE
The Smart Trend Tracker (OTT) is a technical analysis tool designed to help traders identify the direction and strength of a market trend. This indicator functions as an optimized moving average that adapts to market volatility, thereby providing dynamic support and resistance levels. The primary goal of the OTT is to smooth out price action and offer visual cues about potential changes in the trend. Core Components of the Indicator When you add the indicator to your chart, you will see two main
FREE
The EMA Navigator Pro is an advanced version of the popular EMA indicator, designed to provide superior flexibility and multi-timeframe analysis capabilities. This indicator not only displays EMA lines but also offers a powerful alert system to ensure you never miss a crucial signal. Key Features: Multi-Timeframe Support: You can assign a separate timeframe to each individual EMA line, allowing you to analyze long-term (e.g., D1) and short-term (e.g., H1) trends on the same chart. Automatic Cro
FREE
This indicator is a trading strategy designed to find high-probability entry points by combining two very popular indicators: Bollinger Bands (BB) and the Relative Strength Index (RSI) . The core idea is "dual confirmation" : a trade signal is only considered valid when both indicators agree. This helps filter out many of the false signals that occur when using just a single indicator, thereby increasing the reliability of each entry. Bollinger Bands are used to identify relative price value zon
FREE
필터:
리뷰 없음
리뷰 답변