PZ Pivot Points MT5
- 지표
- 버전: 4.0
- 업데이트됨: 10 8월 2019

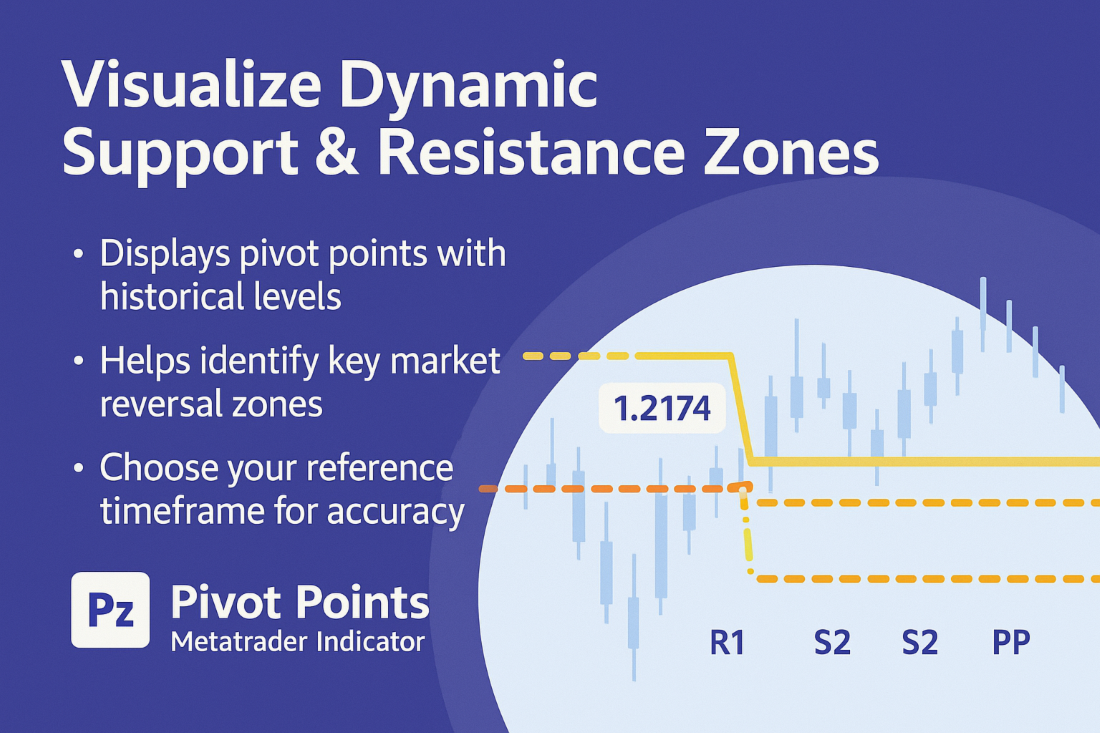
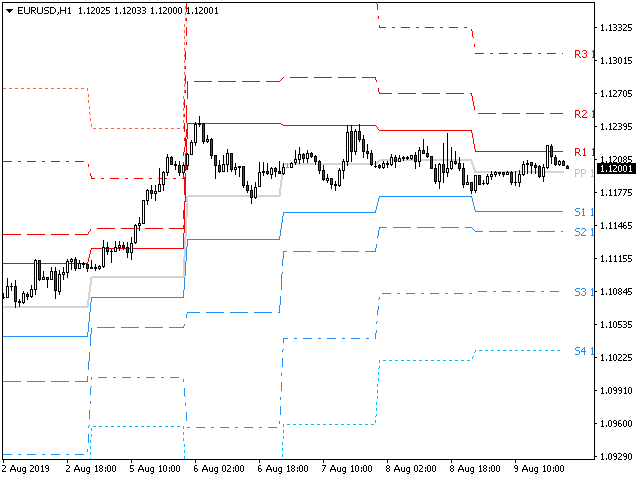
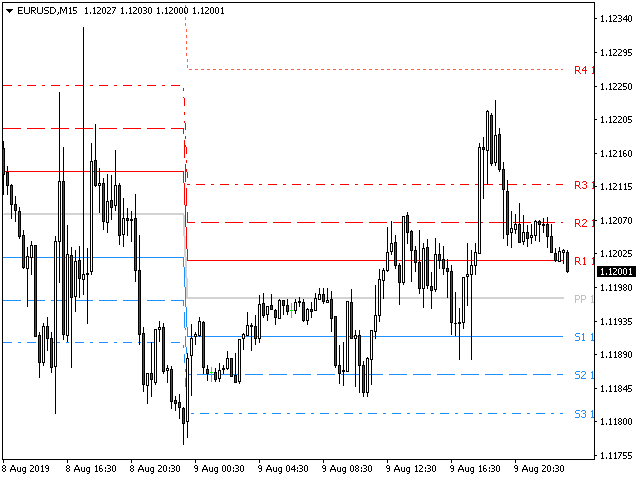
This indicator displays pivot points in the chart, including historical vales, and supports many calculation modes for Pivot Points and S/R levels.
[ Installation Guide | Update Guide | Troubleshooting | FAQ | All Products | 👉 Get Help ]
- It plots historical levels for backtesting purposes
- It allows you to select the reference timeframe
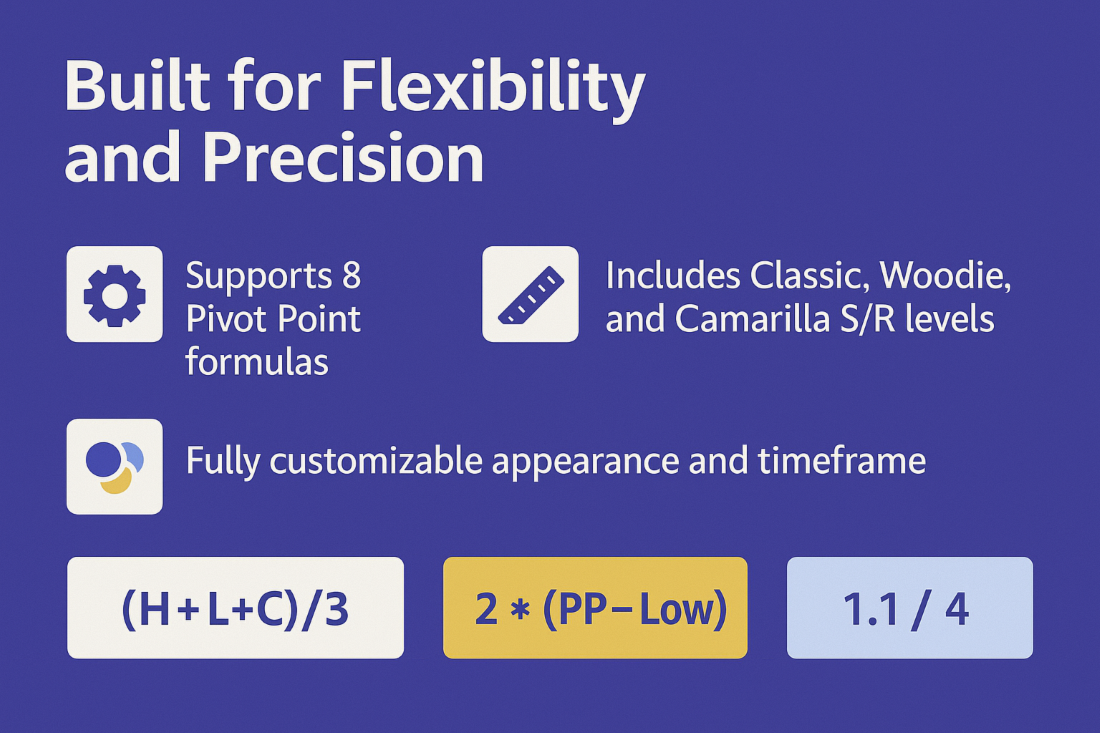
- It implements different Pivot Point calculation modes
- It implements different SR calculation modes
- It implements customizable colors and sizes
Calculation Modes
The indicator implements different calculation modes for the pivot point.- (H+L+C)/3
- (H+L+O)/3
- (H+L+C+O)/4
- (H+L+C+C)/4
- (H+L+O+O)/4
- (H+L)/2
- (H+C)/2
- (L+C)/2
It also implements many different calculation modes for SR Levels:
- Classic Formula
- R4 = R3 + (High – Low)
- R3 = R2 + (High – Low)
- R2 = PP + (High – Low)
- R1 = (2 * PP) – Low
- S1 = (2 * PP) – High
- S2 = PP – (High – Low)
- S3 = S2 – (High – Low)
- S4 = S3 – (High – Low)
- Woodie Pivot Points
- R4 = R3 + (High – Low)
- R3 = High + 2 * (PP – Low)
- R2 = PP + (High – Low)
- R1 = (2 * PP) – Low
- S1 = (2 * PP) – HIGH
- S2 = PP – (High – Low)
- S3 = Low – 2 * (High – PP)
- S4 = S3 – (High – Low)
- Camarilla Pivot Points
- R4 = PP + (High – Low) * 1.1/2
- R3 = PP + (High – Low) * 1.1/4
- R2 = PP + (High – Low) * 1.1/6
- R1 = PP + (High – Low) * 1.1/12
- S1 = PP – (High – Low) * 1.1/12
- S2 = PP – (High – Low) * 1.1/6
- S3 = PP – (High – Low) * 1.1/4
- S4 = PP – (High – Low) * 1.1/2
Input Parameters
- PP Calculation Mode: Select the Pivot Points calculation mode desired
- S/R Calculation Mode: Select the SR calculation mode desired
- Timeframe: Choose the timeframe to calculate pivot points from
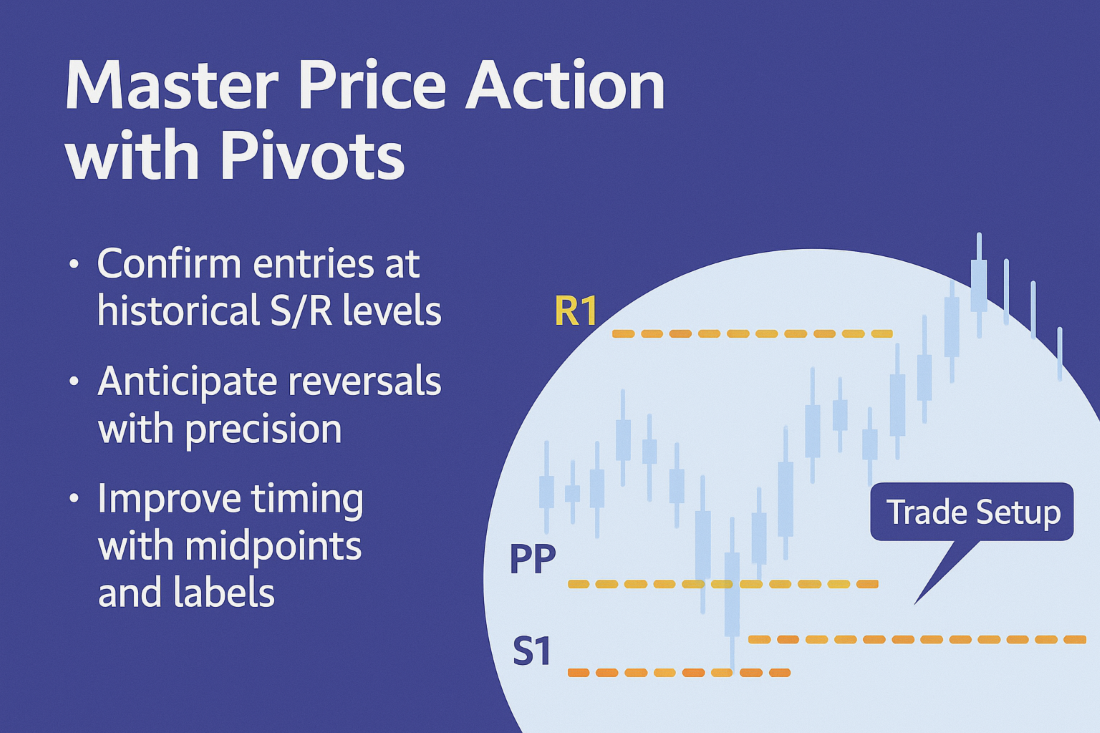
- Mid Points: Display or hide mid points between SR levels
- Color of S levels: Color of support levels
- Color of R levels: Color of resistance levels
- Color of P level: Color of pivot point levels
- Font size: Font size for name and price labels
Author
Arturo López Pérez, private investor and speculator, software engineer and founder of Point Zero Trading Solutions.


Great