Indicador Padroes de Reversao para Candles
- 지표
-
SMART2TRADER SOLUCOES DE SOFTWARES INTELIGENTES LTDA
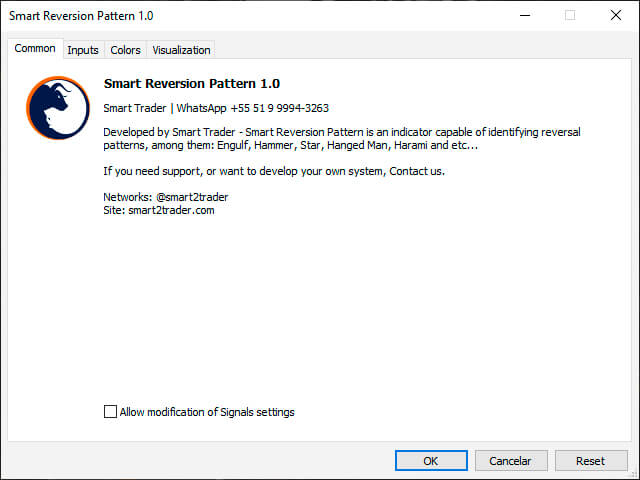
 Hi, I'm Alexandre and I'm the CEO of Smart2Trader.
Smart2Trader is a development company specialized in creating automated systems for over 6 years, for MetaTrader 4 and 5 platforms. - 버전: 1.0
- 활성화: 5
It is designed to provide fast, real-time awareness of patterns.
We also thought about the interface part, creating a clean and pleasant look to identify formation patterns on the chart.
Note: If any pattern you need is not listed, just contact us and request inclusion - we usually respond within a few hours.
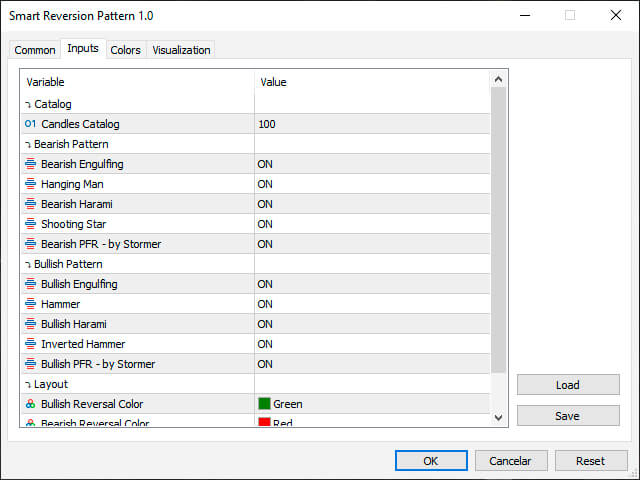
Bearish Reversal Patterns
- Bearish Engulfment
- Hanged
- Low Harami
- Shooting star
- Bearish PFR - by Stormer
Bullish Reversal Patterns
- Bullish Engulfing
- Hammer
- Bullish Harami
- inverted hammer
- Bullish PFR - by Stormer
FAQ:
Does this indicator have a free version?
Yes, it is available directly on our website, but there are limitations of use - it can be used in up to 3 assets - with no functionality restriction, being possible to test in its entirety.
I would like more reversal patterns, how do I do it?
Feel free to ask for us, we will review and include it as soon as possible in the next update.
Can I use this indicator with another system?
Yes, our indicator has an output buffer (index 0), which identifies which pattern was detected, or 0 if there is no pattern at the moment.
List of indexes used in the buffer:
0 - None
1 - Bearish Engulfment
2 - Hanged Man
3 - Bearish Harami
4 - Shooting Star
5 - Bearish Reversal Closing Price - by Stormer
6 - Bullish Engulfing
7 - Hammer
8 - Bullish Harami
9 - Inverted Hammer
10 - Bullish Reversal Closing Price - by Stormer