A zigzag with two two different periods

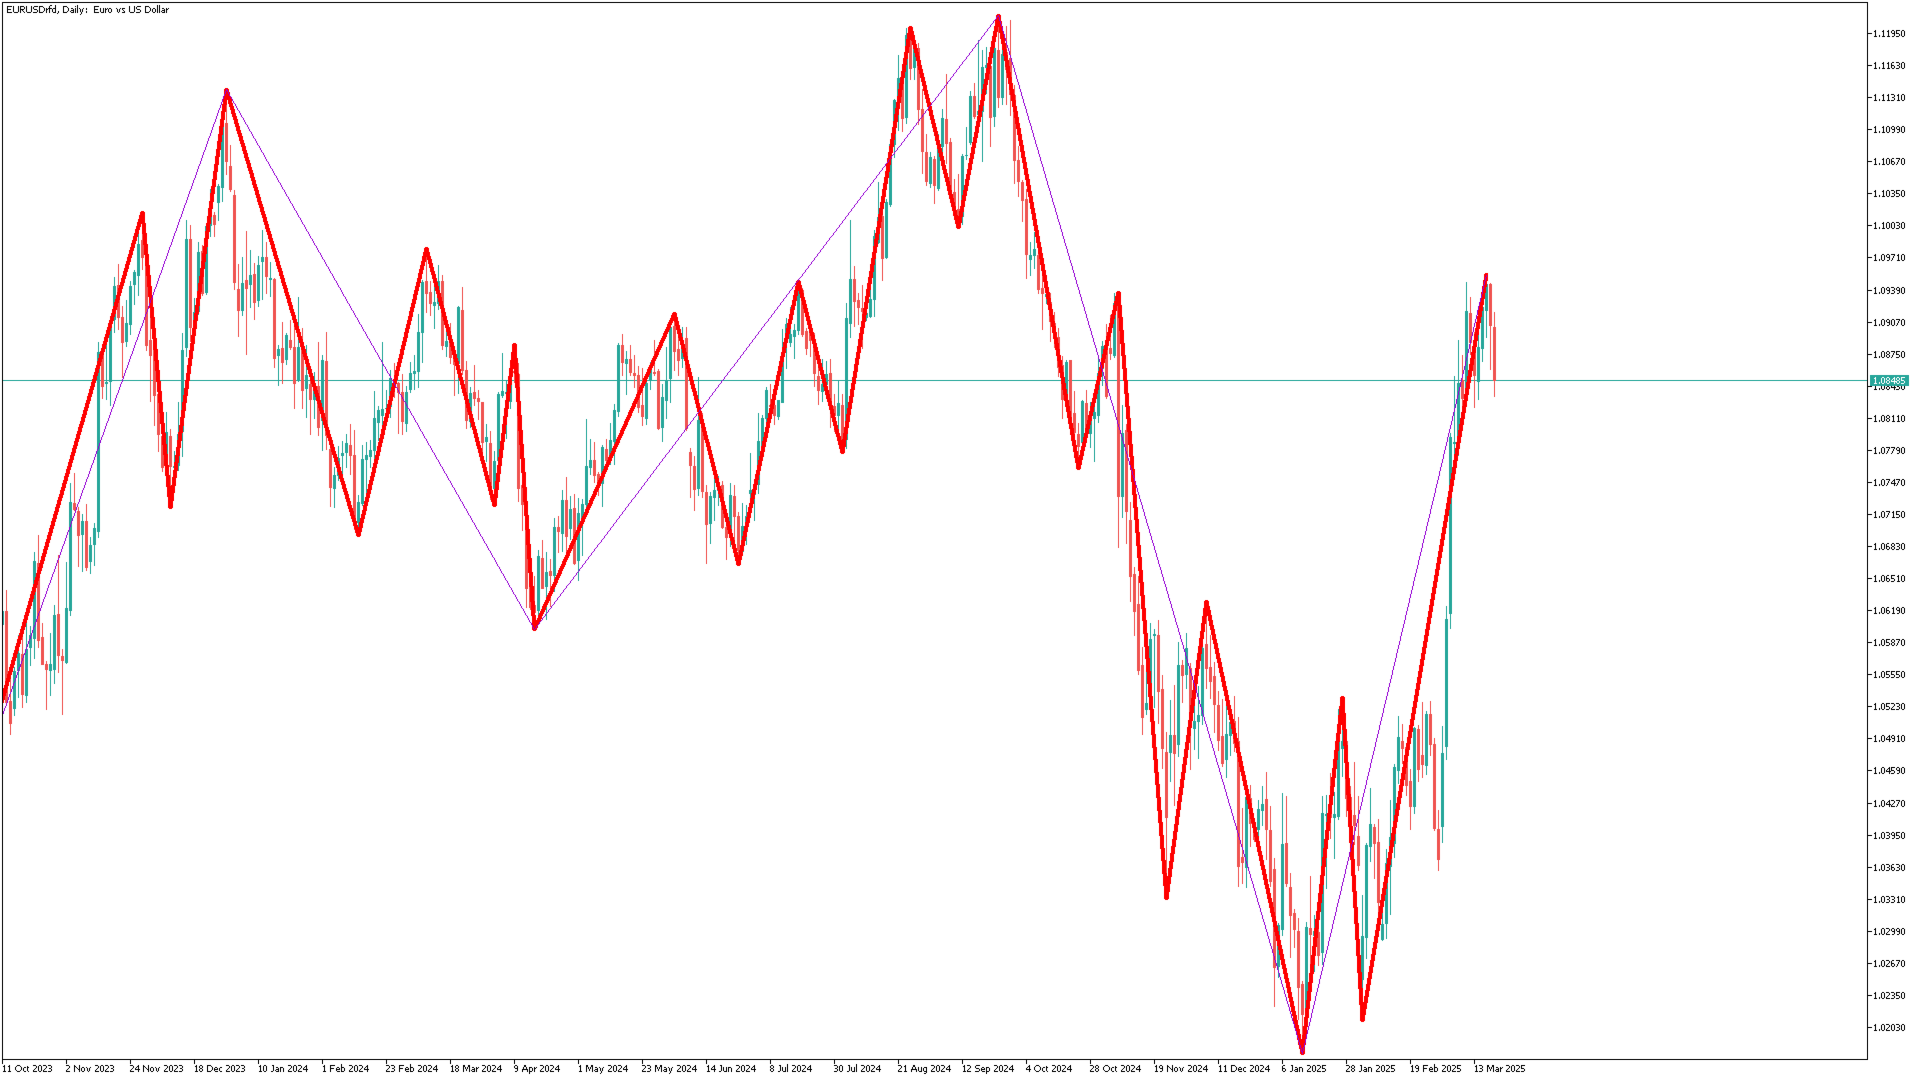
이 표시기에는 13 과 55 의 기간이 다른 두 개의 지그재그가 형성됩니다.  지표의 두 세그먼트가 형성되고 연결되면 특정 기간에 가격의 최소 또는 최대값을 형성하면 지표는 반대 방향으로 가능한 가격 반전을 신호합니다. 가장 작은 기간(기간 13)을 가진 지그재그를 형성 할 때,가장 큰 기간(기간 55)이 동일한 최소 또는 최대로 유지된다면,이는 이전의 최대 또는 최소로 교정 이동이 가능하다는 것을 의미하며,이는 로트를 개방 위치에 추가 할 수 있음을 의미합니다. 중요! 당신은 더 짧은 기간을 가진 지그재그 지시자의 새로운 팔이 형성된 후에 위치를 추가 할 필요가있다. 그렇지 않으면 부정적인 이익 값이 가능합니다. 또한,지그재그 주니어 팔의 형성 후,그것은 가능합니다 90%신뢰도를 가진 손실 없이 이 계기에 위치를 재정렬하기 위하여. 이 방법으로 가격을 짜낼 수 있습니다. 이 지그재그 표시기는 상당한 단점을 가지고 있음을 주목해야한다, 이는 강력한 가격 움직임으로 가격을 다시 작성하는 것으로 표현됩니다. 따라서 추가 다른 지표를 가격 이동 필터로 사용하는 것이 좋습니다.


추천 제품
FibExtender
Syed Oarasul Islam
This Indicator draws Fibonacci Extension levels in two different ways. You can select whether to draw Fibonacci Extension levels based on your favourite ZigZag settings or you can let the indicator to draw Fibonacci Extension  level based on given number of Bars or Candles.  You can also set Mobile and Email notification for your favourite Extension  levels individually. With this indicator you will not have to feel lonely as the it can generate Voice alerts, which will keep you focused on your
ArcTracer
Syed Oarasul Islam
This Indicator draws Fibonacci Arc levels in two different ways. You can select whether to draw Fibonacci Arc levels based on your favourite ZigZag settings or you can let the indicator to draw Arc levels based on given number of bars or candles.  You can also set Mobile and Email notification for your favourite Arc levels individually. With this indicator you will not have to feel lonely as the it can generate Voice alerts, which will keep you focused on your trading and remove boredom.  Produc
Peaks and Troughs MT5
Pavel Verveyko
5 (1)
The indicator detects important peaks and troughs (extremes) on the chart. These points can be used to plot support/resistance levels and trend lines, as well as any other graphical analysis. These points can serve as reference points for setting trading orders. The indicator does not redraw . Settings: Size_History  - the size of the calculated history. Num_Candles_Right  - number of candles to the right of the peak or trough. Num_Candles_Left  - number of candles to the left of the peak or
Harmonic Pattern Plus MT5
Young Ho Seo
4.5 (4)
Introduction Harmonic Patterns are best used to predict potential turning point. Traditionally, Harmonic Pattern was identified manually connecting peaks and troughs points in the chart. Manual harmonic pattern detection is painfully tedious and not suitable for everyone. You are often exposed under subjective pattern identification with manual pattern detection. To avoid these limitations, Harmonic Pattern Plus was designed to automate your harmonic pattern detection process. The functionality
This is a well-known ZigZag indicator. But it differs by the fact that its plot is based on values of the middle line which is set by a user. It can display Andrews’ Pitchfork and standard or Bobokus Fibo levels. NO REPAINTING. Parameters Period МА — middle line period. Default value is 34. Minimum value is 4. Maximum value is set at your discretion. Used to calculate price — type of price used for the midline calculations. The averaging method — type of smoothing for the middle line. Turning p
AutoTrend Pro
Aram Hussein Mohammed
TL Method — Automatic Trendline Detection & Strength Indicator Tired of drawing trendlines manually? TL Method does it for you — automatically detecting, drawing, and scoring trendlines in real time. What it does: Scans up to 1000 bars to find valid support and resistance trendlines Scores each trendline by counting confirmed anchor touches Generates buy/sell signal arrows when price approaches strong trendlines Alerts you via popup, push notification, or sound — with smart cooldown to avoid spa
Easy Indy
Vinutthapon Bumroong
This indicator automatically draws trendlines, Fibonacci levels, support and resistance zones, and identifies BOS (Break of Structure) and CHOCH (Change of Character) patterns on the chart. Just by placing it on the graph, it handles the essential technical analysis tasks for traders, providing a streamlined, effective trading tool this tools is alway make every one easy for trading.
Easy Support and Resistance
Danny Giovanni Romero Lozano
EASY SUPPORT AND RESISTANCE Visualize support and resistance levels across multiple timeframes with dynamic color-coded lines Overview This powerful MT5 indicator automatically identifies and highlights key price levels by drawing rectangles on the last closed candle and its first opposite-colored candle across six different timeframes (M15, M30, H1, H2, H4, D1). The lines dynamically change color based on price action confirmation, transforming into support or resistance levels when validated
FREE
Hurst Cycles Diamonds
Fillipe Dos Santos
Hurst Cycles Diamonds Description This indicator is an alternative version inspired by the pioneering work of David Hickson and the Hurst Cycles Notes indicator developed by Grafton. The main objective is to provide a clear and intuitive view of the Hurst cycles. Credits Original Concept : David Hickson - Hurst Cycles Theory Inspiration : Grafton - Hurst Diamond Notation Pivots Alternative Version : Fillipe dos Santos Main Features Identifies and displays pivots in multiple time cycles Visual t
Fibonacci sequence is defined by integer sequence: 0, 1, 1, 2, 3, 5, 8, 13, 21, 34, 55, 89, 144, ... By definition, it starts from 0 and 1, the next number is calculated as a sum of two previous numbers. Instead of the standard moving average, the indicator uses the following calculation of average price: Bar0 + Bar1 + Bar2 + Bar3 + Bar5 + Bar8 + Bar13 + Bar21 + ... This indicator shows 2 moving Fibonacci lines and arrows when 2 these lines crossing each other. If an Aqua line is crossing a Yell
(c) Uniprojects Weekly Pivot Custom Weekly Pivot Custom is a lightweight MetaTrader 5 indicator that plots weekly CPR, classic weekly pivot levels, and optional previous-week range levels directly on the chart. The indicator is designed for traders who use higher-timeframe weekly structure as part of daily or intraday planning. It calculates the current week levels from the previous weekly candle and can also draw a bounded number of historical weekly levels for review. What It Draws - TC:
UR Gamma MT5
Krzysztof Jan Debski
UR 감마 (머신 러닝 시스템에서 발견되는 유사한 계산으로 구동됨) UR Gamma는 기존 WaveTrend 지표에 새롭고 향상된 기능을 제공하는 최첨단 재무 분석 도구입니다. 고급 디지털 신호 처리 기술을 통합함으로써 UR 감마는 기존 WaveTrend 알고리즘의 일부 제한 사항을 해결하고 가격 움직임의 추세를 식별하고 측정하기 위한 보다 정확하고 강력하며 역동적인 접근 방식을 제공합니다. UR 감마 사용의 이점: 최소한의 설정 모든 데이터는 백그라운드에서 계산되고 있으며 사용자를 위한 출력은 단 1개로 명확하고 깔끔합니다. 피로를 암시하는 배경 수준 모든 종류의 자산에 맞게 조정됩니다. 도구 업데이트를 최신 상태로 유지하고 빠진 것이 있다고 생각되면 요청을 보낼 수 있는 특별한 텔레그램 채팅이 있습니다! 왜 UR 감마인가? 목표는 확률 분포가 -1과 1 사이에서 진동하도록 하고 0을 중간 지점으로 하는 것입니다. 이를 달성하기 위해 활성화 함수라고 하는 기계 학습의
Harness the power of the universe's most perfect number. Golden Retracement is an Expert Advisor meticulously engineered to identify and trade precise reversals at key Fibonacci retracement levels. It automatically detects significant market swings and calculates the golden ratio levels (38.2%, 50.0%, 61.8%), waiting for the price to "bounce" with a powerful confirmation. This bot brings mathematical elegance and disciplined execution to your trading, helping you capitalize on deep corrections a
FREE
"Hunttern harmonic pattern finder" base on the dynamic zigzag with the notification and prediction mode This version of the indicator identifies 11 harmonic patterns and predicts them in real-time before they are completely formed. It offers the ability to calculate the error rate of Zigzag patterns depending on a risk threshold. It moreover sends out a notification once the pattern is complete. The supported patterns: ABCD BAT ALT BAT BUTTERFLY GARTLEY CRAB DEEP CRAB CYPHER SHARK THREE DRIV
This Automatic support/resistance indicator calculates various peaks and troughs of the price action, identifies relevant levels and draws support and resistance automatically. It uses the built-in "ZigZag" indicator in Metatrader as a data source hence, very much accurate indicator.  The support and resistance lines are contineusely updated as new levels and formed. The indicator has only 5 parameters to set, and mostly it can be used with the default values:  The description of the settings is
NEXA Pivot Rebound Basic 1. 개요 NEXA Pivot Rebound Basic은 일일 피벗 레벨(S1, R1)을 기준으로 가격의 반등 가능성을 탐지하는 Expert Advisor입니다. 이 제품은 MetaTrader 5 플랫폼에서 작동하며, M15 차트 기준으로 설계되었습니다. 전일 고가, 저가, 종가를 기반으로 계산된 피벗 레벨과 RSI 및 Stochastic 보조지표를 함께 사용하여 진입 조건을 구성합니다. 본 제품은 자동 매매 전략 연구 및 트레이딩 자동화를 위한 도구입니다. 2. 전략 개요 전략은 다음 요소를 조합하여 신호를 생성합니다. 전일 기준 Pivot Point 계산 S1 / R1 레벨 접근 여부 확인 RSI 보조지표 Stochastic 교차 조건 최근 스윙 고점/저점 기반 손절 설정 고정 비율 기반 이익 목표(RR) 매수 조건은 가격이 S1 근처에 도달하고, 보조지표 조건이 충족될 때 발생합니다. 매도 조건은 가격이 R1 근처에 도달하고, 보조지
New York AM Session Profile NY AM Session Profiling Framework | Non-Repainting | Real-Time | FX & Index Presets | MT4 Version Available Introductory   Pricing To celebrate the release of the New York AM Session Profile Framework,   an i ntroductory Price: $99 (First 11 user only). • Final Lifetime License Price: $149 Thank you to all traders who have supported my previous products and contributed valuable feedback throughout the development process. Full Setup Guide & Strategy Playbook: http
Multi Timeframe Smc Bias Finder Trading in alignment with higher timeframe structure is one of the most consistently profitable habits a trader can build. The difficulty has always been execution: switching between timeframes, manually reading structure, and keeping track of whether the Daily, 4-Hour and 1-Hour are all pointing in the same direction before committing to a position. Multi Timeframe Smc Bias Finder resolves that entirely. Three tools in one indicator: A live multi-timeframe bias d
Welcome to the Ultimate Harmonic Patterns recognition indicator that is focused to detect advanced patterns. The Gartley pattern, Bat pattern, and Cypher pattern  are popular technical analysis tools used by traders to identify potential reversal points in the market. Our Ultimate Harmonic Patterns recognition Indicator is a powerful tool that uses advanced algorithms to scan the markets and identify these patterns in real-time. With our Ultimate Harmonic Patterns recognition Indicator, you ca
"Adjustable Fractals"는 프랙탈 지표의 고급 버전으로, 매우 유용한 거래 도구입니다! .................................................................................................................. - 알다시피 표준 프랙탈 MT5  지표에는 설정이 전혀 없습니다. 이는 거래자에게 매우 불편합니다. - Adjustable Fractals는 이 문제를 해결했습니다. 필요한 모든 설정이 있습니다. - 지표의 조정 가능한 기간(권장 값 - 7 이상). - 가격의 고점/저점으로부터 조정 가능한 거리. - 프랙탈 화살표의 조정 가능한 디자인. - 표시기에는 모바일 및 PC 알림 기능이 내장되어 있습니다. 여기를 클릭하여 고품질 트레이딩 로봇과 지표를 확인하세요! 이 MQL5 웹사이트에서만 제공되는 오리지널 제품입니다.
Auto Fib Retracements
Ross Adam Langlands Nelson
4.2 (5)
Automatic Fibonacci Retracement Line Indicator. This indicator takes the current trend and if possible draws Fibonacci retracement lines from the swing until the current price. The Fibonacci levels used are: 0%, 23.6%, 38.2%, 50%, 61.8%, 76.4%, 100%. This indicator works for all charts over all timeframes. The Fibonacci levels are also recorded in buffers for use by other trading bots. Any comments, concerns or additional feature requirements are welcome and will be addressed promptly. 
FREE
Fractal Support & Resistance Automatic Support and Resistance Indicator Based on Fractal Structure Short Description Fractal Support & Resistance is a technical analysis indicator that automatically identifies and displays support and resistance levels using fractal-based price structure detection. Overview Fractal Support & Resistance is an indicator designed to detect support and resistance zones using configurable fractal logic. The indicator automatically scans historical price structure an
Fibonacci sequence is defined by integer sequence: 0, 1, 1, 2, 3, 5, 8, 13, 21, 34, 55, 89, 144, ... By definition, it starts from 0 and 1, the next number is calculated as a sum of two previous numbers. Instead of the standard moving average, the indicator uses the following calculation of average price: Bar0 + Bar1 + Bar2 + Bar3 + Bar5 + Bar8 + Bar13 + Bar21 + ... Input parameters: fiboNum - numbers in the following integer sequence for Fibo Moving Average 1. 5 on default. fiboNum2 - numbers i
Chart Pattern Structure Professional Chart Pattern Detection Indicator Chart Pattern Structure is a professional technical analysis indicator designed to automatically detect and visualize classic chart patterns directly on the MetaTrader 5 chart. The indicator continuously scans the market structure and highlights valid formations in real time, helping traders identify potential reversal and continuation scenarios with clean and objective visualization. Detected Chart Patterns Reversal Pa
Matreshka
Dimitr Trifonov
5 (2)
Matreshka self-testing and self-optimizing indicator: 1. Is an interpretation of the Elliott Wave Analysis Theory. 2. Based on the principle of the indicator type ZigZag, and the waves are based on the principle of interpretation of the theory of DeMark. 3. Filters waves in length and height. 4. Draws up to six levels of ZigZag at the same time, tracking waves of different orders. 5. Marks Pulsed and Recoil Waves. 6. Draws arrows to open positions 7. Draws three channels. 8. Notes support and re
Astrology Indicator MT5
Thomas Bradley Butler
This indicator is a   technical tool based on harmonic approximations   of solar and lunar cycles. It   does not use exact astronomical positions. This indicator uses   mathematical waves to approximate daily solar and monthly lunar cycles   for trading purposes. It captures general market rhythms influenced by day/night and moon phases, but it   does not track exact astronomical positions . Do your analysis and study on back test before purchase.  The   Advanced Astrological Indicator   is a m
In the context of trading, Malaysia SNR (Support and Resistance) refers to the technical analysis of support and resistance levels in financial markets, particularly for stocks, indices, or other assets traded. This is single timeframe version. Multiple timeframe version is avaiable here . There are three type of Malaysia SNR level Classic , GAP and Flipped 1. Classic Support is the price level at which an asset tends to stop falling and may start to rebound. It acts as a "floor" where demand is
Trend Channel mt5
Tatiana Savkevych
Trend Channel is a Forex trend arrow indicator for identifying potential entry points. I like it, first of all, because it has a simple operating mechanism, adaptation to all time periods and trading tactics. Created based on a regression channel with filters. We display the signals of the Trend Channel indicator on the price function chart using a mathematical approach. How it works: when the price breaks through the overbought/oversold zone (channel levels), a buy or sell signal is generated
Nebulon Smart Trap AI
Tumpa Sarkar
5 (1)
Nebulon Smart Trap AI – Advanced Liquidity Trap Analysis for MetaTrader 5 Nebulon Smart Trap AI is a professional market analysis indicator for MetaTrader 5, developed for traders who want a more structured way to identify liquidity events, false breakouts, stop-hunt reactions, demand and supply interactions, and potential reversal zones directly from price action. Modern financial markets are heavily influenced by liquidity. Price often moves beyond obvious highs and lows, attracts breakout tra
Introduction to X3 Chart Pattern Scanner X3 Cherart Pattern Scanner is the non-repainting and non-lagging indicator detecting X3 chart patterns including Harmonic pattern, Elliott Wave pattern, X3 patterns, and Japanese Candlestick patterns. Historical patterns match with signal patterns. Hence, you can readily develop the solid trading strategy in your chart. More importantly, this superb pattern scanner can detect the optimal pattern of its kind. In addition, you can switch on and off individu
이 제품의 구매자들이 또한 구매함
Neuro Poseidon MT5
Daria Rezueva
4.98 (44)
Neuro Poseidon is a new indicator by Daria Rezueva. It combines precise trading signals with adaptive TP/SL levels - creating best possible trades as a result! Message me and get  Neuro Poseidon Assistant  as a gift to automize your trading process! What makes it stand out? 1. Proven profitability on all assets and timeframes 2. Only confirmed BUY and SELL signals present on the chart 3. Adaptive TP & SL levels generated by the software for each trade 4. Easy to understand - suitable for al
SuperScalp Pro
Van Minh Nguyen
4.67 (27)
SuperScalp Pro – 고급 멀티 필터 스캘핑 지표 시스템 SuperScalp Pro는 클래식 Supertrend와 여러 지능형 확인 필터를 결합한 고급 스캘핑 지표로, 거래 기회를 식별하는 데 도움을 줍니다. M1부터 H4까지 다양한 시간대에서 효율적으로 작동하며, XAUUSD, BTCUSD 및 주요 Forex 통화쌍에 최적화되어 있습니다. 이 지표는 명확한 매수 및 매도 신호를 제공하며, ATR 기반으로 진입가, 손절가, 익절가를 자동 계산하여 보다 효과적인 리스크 관리를 지원합니다. Fibonacci Take Profit 기능은 중요한 가격 구간에서 더 빠르게 포지션을 청산할 수 있도록 하며, 해당 수준 도달 시 알림을 전송합니다. 기본 설정은 Fibonacci Take Profit이 활성화된 상태로 최적화되어 있으며, 보다 안정적이고 일관된 거래 경험에 중점을 둡니다. 차트에 적용하는 것만으로 즉시 사용할 수 있습니다. 고급 사용자를 위해 모든 파라미터는 자유롭게 사용
이 제품은 2026년 시장에 맞게 업데이트되었으며 최신 MT5 빌드에 최적화되었습니다. 가격 업데이트 안내: Smart Trend Trading System은 현재 $99 에 제공됩니다. 다음 30회 구매 후 가격은 $199 로 인상됩니다. 특별 혜택: Smart Trend Trading System 구매 후 저에게 개인 메시지를 보내시면 Smart Universal EA를 무료 로 받을 수 있으며, Smart Trend 신호를 자동 거래로 전환할 수 있습니다. Smart Trend Trading System은 리페인트 없음, 재그리기 없음, 지연 없음의 완전한 트레이딩 시스템으로, 더 깨끗한 신호, 더 나은 추세 방향, 그리고 더 체계적인 시장 거래 방식을 원하는 트레이더를 위해 제작되었습니다. Online course , manual and download presets . 이 시스템은 추세 감지, 반전 구간, Smart Cloud, 트레일링 스톱 로직, 지지와 저항, 캔들 색
Quantum TrendPulse
Bogdan Ion Puscasu
5 (25)
SuperTrend   ,   RSI   ,   Stochastic   의 힘을 하나의 포괄적인 지표로 결합하여 트레이딩 잠재력을 극대화하는 궁극의 트레이딩 도구   인 Quantum TrendPulse를   소개합니다. 정밀성과 효율성을 추구하는 트레이더를 위해 설계된 이 지표는 시장 추세, 모멘텀 변화, 최적의 진입 및 종료 지점을 자신 있게 식별하는 데 도움이 됩니다. 주요 특징: SuperTrend 통합:   주요 시장 추세를 쉽게 따라가고 수익성의 물결을 타세요. RSI 정밀도:   매수 과다 및 매도 과다 수준을 감지하여 시장 반전 시점을 파악하는 데 적합하며 SuperTrend 필터로 사용 가능 확률적 정확도:   변동성이 큰 시장에서 숨겨진 기회를 찾기 위해 확률적 진동   을 활용하고 SuperTrend의 필터로 사용 다중 시간대 분석:   M5부터 H1 또는 H4까지 다양한 시간대에 걸쳐 시장을 최신 상태로 유지하세요. 맞춤형 알림:   맞춤형 거래 조건이 충족되면
Trend Catcher ind mt5
Ramil Minniakhmetov
5 (6)
트렌드 캐처 인디케이터 트렌드 캐처 인디케이터는 개발자가 자체 개발한 맞춤형 적응형 트렌드 분석 지표들을 조합하여 시장 가격 움직임을 분석합니다. 단기적인 노이즈를 제거하고 근본적인 모멘텀 강도, 변동성 확대, 가격 구조 움직임에 집중하여 진정한 시장 방향을 파악합니다. 또한 이동 평균, RSI, 변동성 필터와 같은 맞춤형 지표들을 활용하여 가격을 평활화하고 트렌드를 필터링합니다. 실제 운영 모니터링 및 기타 제품은 다음 링크에서 확인하실 수 있습니다:   https://www.mql5.com/en/users/mechanic/seller 텔레그램에서는 EA나 설정 파일을 판매하지 않습니다. 사기이니 주의하세요. 모든 설정 파일은 블로그에서 무료로 제공됩니다. 중요! 구매 후 즉시 연락 주시면 사용 방법 및 보너스를 드립니다!
Entry In The Zone and SMC Multi Timeframe is a real-time 2-in-1 market analysis tool that combines market structure analysis and a No Repaint BUY / SELL signal system into a single indicator, built on Smart Money Concepts (SMC) — a widely adopted framework used by professional traders to understand market structure. This indicator helps you see the market more clearly, make decisions based on structure rather than guesswork, and focus on high-probability zones where price is more likely to react
Divergence Bomber
Ihor Otkydach
4.9 (90)
이 지표를 구매하신 분께는 다음과 같은 혜택이 무료로 제공됩니다: 각 거래를 자동으로 관리하고, 손절/익절 수준을 설정하며, 전략 규칙에 따라 거래를 종료하는 전용 도우미 툴 "Bomber Utility" 다양한 자산에 맞게 지표를 설정할 수 있는 셋업 파일(Set Files) "최소 위험", "균형 잡힌 위험", "관망 전략" 모드로 설정 가능한 Bomber Utility의 셋업 파일 이 전략을 빠르게 설치, 설정, 시작할 수 있도록 돕는 단계별 영상 매뉴얼 주의: 위의 모든 보너스를 받기 위해서는 MQL5 개인 메시지 시스템을 통해 판매자에게 연락해 주세요. 독창적인 커스텀 지표인 “Divergence Bomber(다이버전스 봄버)”를 소개합니다. 이 지표는 MACD 다이버전스(괴리) 전략을 기반으로 한 올인원(All-in-One) 거래 시스템입니다. 이 기술 지표의 주요 목적은 가격과 MACD 지표 간의 다이버전스를 감지하고, **향후 가격이 어느 방향으로 움직일지를 알려주는
PrimeScalping
Temirlan Kdyrkhan
PrimeScalping is a powerful trading companion designed to generate high-probability entry signals with dynamic TP/SL/DP levels based on volatility. Built-in performance tracking shows win/loss stats, PP1/PP2 hits, and success rates — all updated live. Key Features: Buy/Sell signals with adaptive volatility bands Real-time TP/SL/DP levels based on ATR Built-in MA Filter with optional ATR/StdDev volatility Performance stats panel (Success, Profit/Loss, PP1/PP2) Alerts via popup, sound, push, or e
Power Candles MT5
Daniel Stein
5 (8)
Power Candles V3 - 자체 최적화 강도 지표 파워 캔들 V3는 적용된 모든 차트에서 통화 및 상품의 강세를 실행 가능한 거래 계획으로 전환합니다. 단순히 캔들에 색상을 입히는 대신, 백그라운드에서 실시간 자동 최적화를 수행하여 현재 보고 있는 종목에 대한 최적의 손절매, 익절 및 신호 임계값을 제공합니다. 한 번의 클릭으로 실시간 거래에 적용할 수 있으며, 진입점, 손절매 및 익절 선이 정확한 가격에 맞춰 차트에 표시되고, 방향과 함께 알림이 발령됩니다. 이 도구는 Stein Investments 에코시스템의 일부입니다. 18개 이상의 도구와 함께 당신의 1대1 AI 트레이딩 멘토 Max.  항상 대기 중, 모든 인디케이터를 깊이 있게 이해, 무언가를 차근차근 생각해보고 싶은 순간에 도움을 줍니다.  https://stein.investments 에서 만나보세요 매 종가 바마다 3,000회 이상의 트레이딩 시뮬레이션. 9가지 강도 상태. 2가지 전략을 병렬로 테스트.
FX Trend MT5 NG
Daniel Stein
5 (6)
FX Trend NG: 차세대 멀티 마켓 트렌드 인텔리전스 개요 FX Trend NG 는 다중 시간 프레임 기반의 전문 트렌드 분석 및 시장 모니터링 도구입니다. 몇 초 만에 전체 시장 구조를 파악할 수 있도록 설계되었습니다. 여러 차트를 일일이 전환할 필요 없이, 어떤 종목이 추세에 있는지, 어디에서 모멘텀이 약화되고 있는지, 그리고 어떤 시간 프레임이 서로 정렬되어 있는지 즉시 확인할 수 있습니다. 출시 기념 특별 혜택 – FX Trend NG 를 $30 (6개월) 또는 $80 평생 라이선스 로 이용할 수 있습니다. 이미 Stein Investments 고객이신가요? -> 메시지를 보내 전용 고객 그룹에 참여하세요. 설정이나 사용 방법이 필요하신가요? -> Stein Investments 공식 페이지 를 방문하세요. 1. FX Trend NG가 특별한 이유 3단계 추세 로직 – 단순한 Buy / Sell이 아닙니다 • 대부분의 지표는 Buy 또는 Sell 두 가지 상태만 제
Atomic Analyst MT5
Issam Kassas
4.26 (35)
이 제품은 2026년 시장에 맞게 업데이트되었으며 최신 MT5 빌드에 최적화되었습니다. 가격 업데이트 안내: Atomic Analyst는 현재 $99 에 제공됩니다. 다음 30회 구매 후 가격은 $199 로 인상됩니다. 특별 혜택: Atomic Analyst 구매 후 저에게 개인 메시지를 보내시면 Smart Universal EA를 무료 로 받을 수 있으며, Atomic Analyst 신호를 자동 거래로 전환할 수 있습니다. Atomic Analyst는 리페인트 없음, 재그리기 없음, 지연 없음의 Price Action 거래 인디케이터로, 수동 거래, 신호 명확성, EA 자동화를 위해 설계되었습니다. User manual: settings, inputs and strategy. 가격 움직임, 강도, 모멘텀, 다중 시간대 방향 및 고급 필터를 분석하여 트레이더가 노이즈를 줄이고 약한 세팅을 피하며 더 체계적인 거래 결정을 내릴 수 있도록 돕습니다. 이 인디케이터는 복잡한 시장 계산
Gann Made Easy MT5
Oleg Rodin
5 (6)
Gann Made Easy 는 mr.의 이론을 사용하여 최고의 거래 원칙을 기반으로 하는 전문적이고 사용하기 쉬운 Forex 거래 시스템입니다. W.D. 간. 이 표시기는 Stop Loss 및 Take Profit Levels를 포함하여 정확한 BUY 및 SELL 신호를 제공합니다. PUSH 알림을 사용하여 이동 중에도 거래할 수 있습니다. 구매 후 거래 방법 안내 및 유용한 추가 지표를 무료로 받으시려면 저에게 연락주세요! 아마도 Gann 거래 방법에 대해 이미 여러 번 들었을 것입니다. 일반적으로 Gann의 이론은 초보자 거래자뿐만 아니라 이미 거래 경험이 있는 사람들에게도 매우 복잡한 것입니다. Gann의 거래 방식은 이론적으로 적용하기 쉽지 않기 때문입니다. 나는 그 지식을 연마하고 Forex 지표에 최고의 원칙을 적용하기 위해 몇 년을 보냈습니다. 표시기는 적용하기가 매우 쉽습니다. 차트에 첨부하고 간단한 거래 권장 사항을 따르기만 하면 됩니다. 지표는 지속적으로 시장 분석
M1 Quantum MT5
Hamed Dehgani
5 (3)
개발자 공지: 129달러 가격의 라이선스가 1개만 남아 있습니다. 해당 라이선스가 판매되면 가격은 149달러 로 인상됩니다. M1 Quantum 은 M1 전용 전문 트레이딩 시스템으로, 손절(Stop Loss), 익절(Take Profit), 그리고 스마트 자금 관리 기능이 내장된 빠르고 정확한 거래 신호를 제공합니다. M1 Quantum 은 연속 수익 거래 에 집중하여 계좌를 빠르게 성장시키도록 설계된 전문 자금 관리 시스템을 포함하고 있습니다. M1 Quantum 인디케이터 의 주요 기능 M1 타임프레임 및 모든 주요 통화쌍 용으로 설계됨 모든 거래에 손절과 익절 적용 자금 관리 시스템 이 포함되어 트레이더가 쉽게 거래할 수 있도록 안내 높은 승률 및 높은 연속 수익률 리페인트 없음, 지연 없음 모든 트레이더가 쉽게 이해 가능 M1 Quantum 을 사용하려면 M1 Quantum Assistant 가 필요합니다. 이 강력한 도구는 모든 M1 Quantum 구매자에게 무료로 제공
소개       Quantum Breakout PRO   , 브레이크아웃 존 거래 방식을 변화시키는 획기적인 MQL5 지표! 13년 이상의 거래 경험을 가진 숙련된 트레이더 팀이 개발한       퀀텀 브레이크아웃 PRO       혁신적이고 역동적인 브레이크아웃 존 전략으로 거래 여정을 새로운 차원으로 끌어올리도록 설계되었습니다. Quantum Breakout Indicator는 5개의 이익 목표 영역이 있는 브레이크아웃 영역의 신호 화살표와 브레이크아웃 상자를 기반으로 한 손절 제안을 제공합니다. 초보자 거래자와 전문 거래자 모두에게 적합합니다. Quantum EA 채널:       여기를 클릭하세요 중요한! 구매 후 설치 매뉴얼을 받으려면 개인 메시지를 보내주십시오. 추천: 기간: M15 통화쌍: GBPJPY, EURJPY, USDJPY,NZDUSD, XAUUSD 계정 유형: 스프레드가 매우 낮은 ECN, Raw 또는 Razor 브로커 시간: GMT +3 중개인 :
이 제품은 2026년 시장에 맞게 업데이트되었으며 최신 MT5 빌드에 최적화되었습니다. 가격 업데이트 안내: Smart Price Action Concepts는 현재 $200 에 제공됩니다. 다음 30회 구매 후 가격은 $299 로 인상됩니다. 특별 혜택: 구매 후 저에게 개인 메시지를 보내시면 무료 보너스 + 선물 을 받을 수 있습니다. 먼저, 이 트레이딩 도구는 리페인트 없음, 재그리기 없음, 지연 없음의 인디케이터이므로 전문적인 트레이딩에 적합하다는 점을 강조하고 싶습니다. Online course , and manual Smart Price Action Concepts Indicator는 초보자와 경험 많은 트레이더 모두에게 매우 강력한 도구입니다. 20개 이상의 유용한 인디케이터를 하나로 결합하고, Inner Circle Trader Analysis와 Smart Money Concepts Trading Strategies 같은 고급 트레이딩 아이디어를 통합합니다. 이 인디
ARIPoint
Temirlan Kdyrkhan
1 (1)
ARIPoint is a powerful trading companion designed to generate high-probability entry signals with dynamic TP/SL/DP levels based on volatility. Built-in performance tracking shows win/loss stats, PP1/PP2 hits, and success rates all updated live. Key Features: Buy/Sell signals with adaptive volatility bands Real-time TP/SL/DP levels based on ATR Built-in MA Filter with optional ATR/StdDev volatility Performance stats panel (Success, Profit/Loss, PP1/PP2) Alerts via popup, sound, push, or email Cu
Azimuth Pro
Ottaviano De Cicco
5 (7)
Azimuth Pro V2: Synthetic Fractal Structure and Confirmed Entries for MT5 Overview Azimuth Pro is a multi-level swing structure indicator by Merkava Labs . Four nested swing layers, swing-anchored VWAP, ABC pattern detection, three-timeframe structural filtering, and closed-bar confirmed entries — one chart, one workflow from micro-swings to macro-cycles. This is not a blind signal product. It is a structure-first workflow for traders who care about location, context, and timing. V2 Launch Offe
Crystal Heikin Ashi Signals
Muhammad Jawad Shabir
5 (2)
Crystal Heikin Ashi Signals - Professional Trend & Signal Detection Indicator Advanced Heikin Ashi Visualization with Intelligent Signal System for Manual & Automated Trading Final Price: $149 ---------> Price goes up $10 after every 10 sales . Limited slots available — act fast . Overview Crystal Heikin Ashi Signals is a professional-grade MetaTrader 5 indicator that combines pure Heikin Ashi candle visualization with an advanced momentum-shift detection system. Designed for both manual traders
Gem SIGNAL
Shengzu Zhong
5 (1)
GEM Signal Pro GEM Signal Pro는 MetaTrader 5용 추세추종형 지표로, 차트에서 더 명확한 신호, 더 구조적인 트레이드 설정, 그리고 더 실용적인 리스크 관리를 원하는 트레이더를 위해 설계되었습니다. 단순한 화살표만 표시하는 것이 아니라, GEM Signal Pro는 전체 트레이드 아이디어를 더 깔끔하고 읽기 쉬운 방식으로 보여줍니다. 조건이 확인되면 진입가, 손절가, 목표가를 차트에 표시하여 트레이더가 설정을 더 효율적으로 검토할 수 있도록 도와줍니다. 작동 방식 이 지표는 먼저 내부 로직에 따라 유효한 초기 신호를 식별합니다. 확인 조건이 충족되면, GEM Signal Pro는 차트에 전체 설정을 표시합니다. 이를 통해 트레이더는 거래 구조를 더 명확하게 보고, 수동 분석 작업을 줄일 수 있습니다. 차트에 표시되는 거래 레벨 확인된 신호에 대해, GEM Signal Pro는 다음을 표시할 수 있습니다. 진입가 손절가 목표가 1 목표가 2 목표가 3 손
KURAMA GOLD SIGNAL PRO (MT5) — 7중 필터 · 자동 TP/SL · 품질 점수 · 시그널 기록 저장 | XAUUSD 완전 트레이딩 시스템 실시간 리페인트 없음. 시그널이 나타나는 순간 화살표, 진입, TP, SL이 그 자리에 고정되어 이후 절대 움직이지 않습니다. 여러분이 거래하는 것은 바로 이 실시간 시그널입니다. 그리고 v7.20에서는 실제로 발신된 모든 시그널이 자동 저장되어 재시작 후에도 정확히 복원됩니다. 구매자 전용 보너스 평생 라이선스를 구매하시면 AI Zone Radar($59 상당) + 완전 PDF 매뉴얼을 무료로 드립니다. 제품 가격에 더해 $59 상당의 보너스가 따라옵니다. 구매 후 MQL5로 메시지를 보내주세요. AI Zone Radar: https://www.mql5.com/en/market/product/175834 골드 트레이더 커뮤니티에서 실제로 사용되며 정확성과
Quant Direction MT5
Georgios Kalomoiropoulos
Quant Direction 은 3D 시장 분석 도구입니다. 다양한 매개변수에 걸쳐 정확한 백분율 편차를 계산하면서 완벽하게 객관적인 알고리즘 기반 시장 분석을 제공합니다. 첨단 AI 기반 모델링 도구와 엄격한 테스트를 거쳐 개발된 이 알고리즘은 타의 추종을 불허하는 정확도로 시장을 분석합니다. 플랫폼에서 모든 통화쌍 또는 금융 상품을 분석할 수 있습니다. 단기 거래, 데이 트레이딩, 스윙 트레이딩 등 어떤 유형의 거래를 하든 Quant Direction은 최적의 선택입니다. 운영자가 되는 것의 진정한 이점 퀀트 디렉션의 진정한 장점은 감정, 눈의 피로, 과도한 분석을 완전히 배제한다는 점입니다. 더 이상 수십 개의 차트를 일일이 살펴보며 방향을 찾거나 자신의 판단에 끊임없이 의문을 품을 필요가 없습니다. 이 시스템은 8개의 시간 간격(5개월에서 수개월까지)을 밀리초 단위로 처리합니다. 특정 시점의 주요 시장 참여자를 정확하게 식별하여 항상 성공 확률이 가장 높은 방향으로 거래할
Grabber System MT5
Ihor Otkydach
4.83 (24)
탁월한 기술적 지표인 Grabber를 소개합니다. 이 도구는 즉시 사용 가능한 “올인원(All-Inclusive)” 트레이딩 전략으로 작동합니다. 하나의 코드 안에 강력한 시장 기술 분석 도구, 매매 신호(화살표), 알림 기능, 푸시 알림이 통합되어 있습니다. 이 인디케이터를 구매하신 모든 분들께는 다음의 항목이 무료로 제공됩니다: Grabber 유틸리티: 오픈 포지션을 자동으로 관리하는 도구 단계별 영상 매뉴얼: 설치, 설정, 그리고 실제 거래 방법을 안내 맞춤형 세트 파일: 인디케이터를 빠르게 자동 설정하여 최고의 성과를 낼 수 있도록 도와줍니다 다른 전략은 이제 잊어버리세요! Grabber만이 여러분을 새로운 트레이딩의 정점으로 이끌어 줄 수 있습니다. Grabber 전략의 주요 특징: 거래 시간 프레임: M5부터 H4까지 거래 가능한 자산: 어떤 자산이든 사용 가능하지만, 제가 직접 테스트한 종목들을 추천드립니다 (GBPUSD, GBPCAD, GBPCHF, AUDCAD, AU
SmartScalping
Temirlan Kdyrkhan
SmartScalping is a powerful trading companion designed to generate high-probability entry signals with dynamic TP/SL/DP levels based on volatility. Built-in performance tracking shows win/loss stats, PP1/PP2 hits, and success rates — all updated live. Key Features: Buy/Sell signals with adaptive volatility bands Real-time TP/SL/DP levels based on ATR Built-in MA Filter with optional ATR/StdDev volatility Performance stats panel (Success, Profit/Loss, PP1/PP2) Alerts via popup, sound, push, or e
RelicusRoad Pro MT5
Relicus LLC
4.96 (24)
RelicusRoad Pro: 퀀트 시장 운영 체제 70% 할인 평생 이용권 (한정 시간) - 2,000명 이상의 트레이더와 함께하세요 왜 대부분의 트레이더는 "완벽한" 지표를 가지고도 실패할까요? 진공 상태에서 단일 개념 만으로 거래하기 때문입니다. 문맥 없는 신호는 도박입니다. 지속적인 승리를 위해서는 컨플루언스(중첩) 가 필요합니다. RelicusRoad Pro는 단순한 화살표 지표가 아닙니다. 완전한 퀀트 시장 생태계 입니다. 독점적인 변동성 모델링을 사용하여 가격이 이동하는 "공정 가치 로드"를 매핑하고, 단순 노이즈와 실제 구조적 돌파를 구분합니다. 추측은 그만두세요. 기관급 로드 로직으로 거래를 시작하세요. 핵심 엔진: "Road" 알고리즘 시스템의 중심에는 시장 상황에 실시간으로 적응하는 동적 변동성 채널인 Road Algo 가 있습니다. 세이프 라인(평형) 과 가격이 수학적으로 반전될 가능성이 높은 확장 레벨 을 투영합니다. Simple Road: 일반적인 시장을 위
This indicator automatically detects  internal & swing market structure, Breaker block, Strong Imbalance, Liquidity Void, Volume imbalance. Features Full internal & swing market structure labeling in real-time Breaker block Strong Imbalance Liquidity Void volume imbalance After purchasing the indicator, the full source code is provided, and via indicator buffers it can be easily integrated into your Expert Advisors (EAs) for automated trading strategies.
Gladiator Indicator: Conquer the Markets Step into the trading arena with the Gladiator Indicator, a robust and highly effective trading tool designed exclusively for MQL5. Built for traders who want clear, actionable insights, Gladiator cuts through market noise to deliver precise Buy and Sell signals right on your charts. Whether you are a beginner looking for guidance or an experienced trader seeking a reliable confirmation tool, Gladiator provides the edge you need to battle the markets wi
Btmm state engine pro
Garry James Goodchild
5 (5)
BTMM State Engine Pro is a MetaTrader 5 indicator for traders who use the Beat The Market Maker approach: Asian session context, kill zone timing, level progression, peak formation detection, and a multi-pair scanner from a single chart. It combines cycle state logic with a built-in scanner dashboard so you do not need the same tool on many charts at once. What it does Draws the Asian session range; session times can follow broker server offset or be set in inputs. Tracks level progression (L
FX Power MT5 NG
Daniel Stein
5 (33)
FX Power: 통화 강세 분석으로 더 스마트한 거래 결정을 개요 FX Power 는 어떤 시장 상황에서도 주요 통화와 금의 실제 강세를 이해하기 위한 필수 도구입니다. 강한 통화를 매수하고 약한 통화를 매도함으로써 FX Power 는 거래 결정을 단순화하고 높은 확률의 기회를 발견합니다. 트렌드를 따르거나 극단적인 델타 값을 사용해 반전을 예측하고자 한다면, 이 도구는 귀하의 거래 스타일에 완벽히 적응합니다. 단순히 거래하지 말고, FX Power 로 더 스마트하게 거래하세요. 1. FX Power가 거래자에게 매우 유용한 이유 통화와 금의 실시간 강세 분석 • FX Power 는 주요 통화와 금의 상대적 강세를 계산하고 표시하여 시장 역학에 대한 명확한 통찰력을 제공합니다. • 어떤 자산이 앞서고 있고 어떤 자산이 뒤처지는지 모니터링하여 보다 현명한 거래 결정을 내릴 수 있습니다. 포괄적인 멀티 타임프레임 뷰 • 단기, 중기 및 장기 타임프레임에서 통화와 금의 강세를
TrendProMaster
Temirlan Kdyrkhan
MasterTrend Indicator for MT5 A powerful trend-following and signal-evaluation tool MasterTrend   is a custom MT5 indicator that combines Moving Averages and ATR-based risk/reward logic to generate clear buy/sell signals. It visualizes dynamic SL/TP levels, evaluates past trade outcomes, and displays win/loss statistics in a clean on-chart panel. Key features include: Buy/Sell signals based on MA crossovers ATR-based SL/TP1/TP2/TP3 levels with visual lines and labels Signal outcome tracking wit
Berma Bands
Muhammad Elbermawi
5 (9)
Berma Bands(BBs) 지표는 시장 동향을 파악하고 이를 활용하려는 트레이더에게 귀중한 도구입니다. 가격과 BBs 간의 관계를 분석함으로써 트레이더는 시장이 추세 단계인지 범위 단계인지를 분별할 수 있습니다. 자세한 내용을 알아보려면 [ Berma Home Blog ]를 방문하세요. 버마 밴드는 세 개의 뚜렷한 선으로 구성되어 있습니다. 어퍼 버마 밴드, 미들 버마 밴드, 로어 버마 밴드입니다. 이 선들은 가격 주위에 그려져 전체 추세에 대한 가격 움직임을 시각적으로 표현합니다. 이 밴드들 사이의 거리는 변동성과 잠재적인 추세 반전에 대한 통찰력을 제공할 수 있습니다. 버마 밴드 라인이 각각에서 분리될 때, 그것은 종종 시장이 횡보 또는 범위 이동 기간에 접어들고 있음을 시사합니다. 이는 명확한 방향 편향이 없음을 나타냅니다. 트레이더는 이러한 기간 동안 추세를 파악하기 어려울 수 있으며 더 명확한 추세가 나타날 때까지 기다릴 수 있습니다. 버마 밴드 라인이 단일 라인으로
제작자의 제품 더 보기
Dual ZigZag SSRC
Igor Nagorniuk
일반적인 목적 Dual ZigZag SSRC는 서로 다른 주기의 두 개의 ZigZag와 SSRC 필터의 조합을 기반으로 매수 및 매도 신호를 생성하도록 설계된 기술적 분석 트레이딩 인디케이터입니다. 이 인디케이터는 자동으로 국부적 극값을 식별하고 필터로 확인한 후 진입 및 손절매 수준과 함께 신호를 제공합니다. 기능 반전 지점 식별 - 이중 ZigZag는 중요한 저점과 고점을 강조 표시하고 시장 노이즈를 필터링합니다. 허위 신호 필터링 - SSRC 오실레이터는 방향성을 확인하여 잘못된 신호 발생을 줄입니다. 진입 수준 정의 - 녹색 선은 포지션을 개시하기 위한 최적의 영역을 보여줍니다. 리스크 관리 - 빨간색 선은 손절매 수준을 보여줍니다. 신호 시각화 - 화살표가 진입 시점을 명확하게 표시합니다. 시장 및 상품 외환 - 적용성이 높으며 변동성이 좋은 통화쌍에 최적입니다. 선물 - 적용성이 중간 정도이며 지수 선물 및 원자재 선물에 적합합니다. 주식 - 적용성이 중간 정
ATRZigMACD
Igor Nagorniuk
ATRZigMACD - 지표 간략 설명 1. 목적과 개념 ATRZigMACD는 클래식 MACD와 위조 신호를 필터링하기 위한 ATR 지그재그 알고리즘을 결합한 고급 오실레이터입니다. 이 지표는 변동성을 고려한 트렌드 전환점을 식별하고, 트렌드 강도를 확인하며, 명확한 거래 신호를 생성합니다. 2. 작동 원리 구성 요소: MACD 히스토그램 (파랑색) – 빠른 EMA와 느린 EMA의 차이 신호선 (노란색) – 히스토그램의 평활화 이동평균 SELL 화살표 (초록색, 위쪽) – 매도 신호 BUY 화살표 (빨간색, 아래쪽) – 매수 신호 ATR 레벨 (파랑/주황색) – 동적 변동성 임계값 신호 논리: BUY가 형성되는 조건: 가격이 하위 ATR 임계값에 도달 MinPeriod 기간(캔들) 경과 빨간색 아래쪽 화살표 표시 SELL가 형성되는 조건: 가격이 상위 ATR 임계값에 도달 MinPeriod 기간(캔들) 경과 초록색 위쪽 화살표 표시 3. 설정 매개변수 ATRZIGZAG 매개변
Daily End Potential (DEP) v1.26은 MetaTrader 4용 기술 지표로, 지정된 시간 창에서 가격 범위를 분석하고 거래일 종료까지 가격이 위 또는 아래로 움직일 확률을 계산합니다. 지표의 목적 이 지표는 주요 가격 범위가 형성된 후 트레이더가 장중 움직임의 가장 가능성 높은 방향을 결정하는 데 도움을 줍니다. 가격이 범위의 상단 경계에 가까우면 하락 움직임의 잠재력이 더 크고, 그 반대도 마찬가지입니다. 이 지표는 이 잠재력을 백분율로 계산하고 확률이 지정된 임계값을 초과하면 신호를 발행합니다. 신호는 차트에 화살표로 표시되며 확률 백분율을 보여주는 텍스트 레이블이 함께 표시됩니다. 작동 방식 트레이더가 PC 현지 시간으로 시간 간격(예: 10:00~11:00)을 설정하면, 이 시간 동안 가격 범위가 형성됩니다. 지표는 현지 시간을 브로커의 서버 시간과 자동으로 동기화합니다. 분석 창이 닫힌 후, 지표는 종가가 범위 경계를 기준으로 어디에 위치하는지 결정합니
지그자그 표시기는 34 의 주기로 표준으로 추가 화살표 신호가 있습니다. 추가 신호는 지그재그 표시기와 별도로 계산됩니다.이 표시기에 대한 작업은 다음과 같습니다. 지그재그 표시기의 세그먼트를 형성하고 추가 화살표 신호가 나타날 때 화살표 방향으로 위치를 열어야합니다. 이전 팔의 상단에 있는 추가 신호(화살)의 반대 방향으로 지그자그 표시기의 다른 팔을 형성할 때,대기 중인 순서의 위치를 설정하는 것이 가능해집니다.3. 반대쪽 지그재그 어깨에서 추가 신호(화살표)로 형성이 완료되면 이전에 열린 위치에 추가하거나 정지 손실을 이 수준으로 이동할 수 있습니다;4. 보수적 인 거래 모드에서 거래하는 경우 가격 움직임의 첫 번째 철수 전에 추가 포지션을 열 수 없습니다. 정확하게 시장에 진입하려면 지그재그 표시기 세그먼트의 형성과 수석 시간대에 추가 신호의 출현을 기다릴 수 있으며 열린 위치에서 40 점보다 더 가까운 정지를 배치 할 수 있습니다. 6. 당신이 무역에 추가 위치를 추가 한
Balance line
Igor Nagorniuk
지정된 표시기는 현재 기호에 이익(손실)을 표시하는 표시기의 버전 중 하나입니다. 당신은 쉽게 총 이익 또는 손실을 결정,마우스로 레벨을 이동할 수 있습니다. 이 표시기의 특징은 다음과 같습니다. 이익 또는 손실이 무역이 일어나는 장소에서,라인 근처에 표시되지 않습니다,하지만 손실 또는 이익을 계산하는 거래를 방해하지 않는다는 것을 의미 화면의 왼쪽 상단 모서리에. 2. 표시등이 자동으로 설정 한 위치를 결정합니다. 3. 당신이 잠금을 거래하는 경우,표시기는 평균 이익 수준을 뽑아 것입니다. 4. 위의 지표는 오픈 포지션뿐만 아니라 한계 주문,즉 이론적 인 이익 또는 손실의 양을 계산할 수있는 능력을 가지고 있습니다.이 지표는 수수료,스프레드 및 기타 브로커 공제(소득세)와 같은 매개 변수를 고려하지 않는다는 것을 즉시 쓸 것입니다. 표시기는 표준 모드에서 시작됩니다. 위의 표시기를 설치 한 후,당신은 지정된 시간 프레임에 파란색 수평 라인을 볼 수 있습니다. 드래그 할 때,당신은
## WPRV2 지표의 상세 설명 WPRV2는 전통적인 기술 분석 도구인 윌리엄스 퍼센트레인지(%R)를 개량한 버전입니다. 주식 시장이나 외환시장, 암호화폐 거래소 등 금융 시장에서 사용되며, 시장 동향을 분석하고 최적의 매매 타이밍을 결정하는데 도움이 됩니다. ### 지표의 목적 WPRV2 지표의 주요 목적은 현재 가격이 최근 고점과 저점에 비해 얼마나 가까운지 측정하는 것입니다. 이를 통해 트레이더들은 다음 사항을 파악할 수 있습니다. - 현재 가격이 역사적으로 높은 수준에 가까운가? - 혹은 역사적으로 낮은 수준에 접어드는 중인가? 이 정보를 통해 시장 변동성이나 현재 추세의 연속성을 신속하게 파악하여 올바른 판단을 내릴 수 있습니다. ### WPRV2 지표의 특징 #### 1. 그래픽 표현 방법 WPRV2 지표는 메인 자산 차트와 별도로 나타나며, 다음 두 줄로 구성됩니다. - 메인 라인(`WPR`) : 지정된 기간 동안 %R 값의 변화를 보여줍니다. - 추가적인
GannZigZagMACD
Igor Nagorniuk
GannZigZagMACD 지표 상세 설명 목적과 개념 GannZigZagMACD 는 MetaTrader 5 플랫폼용 하이브리드 기술 지표로, 클래식 MACD 지표와 Gann의 지그재그 요소를 결합한 것입니다. 이 지표는 극단 패턴을 기반으로 트렌드 반전을 식별하고 거래 신호를 생성하도록 설계되었습니다. 이 지표의 주요 아이디어는 Gann의 방법을 사용하여 중요한 고점과 저점을 감지한 다음 MACD 히스토그램에 신호를 투영하는 것입니다. 작동 원리 주요 구성 요소: 클래식 MACD - 빠른(12기간)과 느린(26기간) 지수 이동 평균 간의 차이를 계산 신호선 - MACD 히스토그램의 평활 이동 평균(기본값: 9기간 EMA) Gann 알고리즘 - 지정된 바 범위(GSv_range)를 기반으로 중요한 극값 결정 신호 화살표 - 잠재적 진입점을 나타내는 MACD 히스토그램의 반전 화살표 신호 생성 메커니즘: 이 지표는 반전 논리 를 사용합니다: 녹색 상향 화살표(233) → 매도 신호
ZigZag3LZZ
Igor Nagorniuk
ZigZag_3LZZ — 3단계 지그재그 인디케이터 ZigZag_3LZZ 인디케이터는 금융 시장의 기술적 분석을 위해 설계되었습니다. 차트에 서로 다른 주기(5, 13, 34)를 가진 세 가지 색상의 지그재그 라인을 표시하여 트레이더에게 다음 기능을 제공합니다:     주요 가격 반전 수준을 시각적으로 식별     중요하지 않은 가격 변동과 시장 노이즈 필터링     최신 극점을 기반으로 추세선 그리기     피보나치 수준 자동 계산 (0.24, 0.382, 0.5, 0.618, 0.76)     현재 지지선과 저항선 수준 결정     새로운 극점 출현 시 즉각적인 반전 신호 획득     단일 차트에서 세 가지 시간대를 시각적으로 비교       적용 분야       이 인디케이터는 다양한 거래 전략에 사용됩니다:     추세 거래 — 세 가지 방향의 지그재그 라인을 통한 추세 방향 판단     수준 거래 — 지지/저항 수준에서 시장 진입     반전점 탐색
X Sensors Pro
Igor Nagorniuk
X Sensors Pro는 선택된 기간 동안 가격 수준별 거래량 분포를 시각화하는 전문 볼륨 프로파일 지표입니다. 이 지표는 자동으로 로컬 극값(HH와 LL)을 식별하고, 최대 거래량 수준인 POC(Point of Control)를 계산하며, 식별된 범위를 기반으로 지지선과 저항선을 구축합니다. 주요 기능: 컬러 히스토그램 형태의 볼륨 프로파일 시각화 POC(Point of Control) 자동 감지 HH(더 높은 고가) 및 LL(더 낮은 저가) 수준 구축 피벗 수준 및 다중 지지/저항 수준 계산 강세(녹색) 및 약세(빨간색) 거래량의 색상 표시 모든 시간대에 적응하는 조정 기능 이 지표의 용도는 무엇인가요? 이 지표는 트레이더의 다음과 같은 과제를 해결합니다: 1. 축적 및 분배 영역 식별 거래량은 항상 큰 세력이 시장에 진입하거나 이탈하는 곳에 집중됩니다. POC는 최대 거래량이 발생한 가격을 보여줍니다. 이것은 심리적으로 중요한 수준입니다. 2. 공정 가치 탐색 PO
ZigAndZagScalpel
Igor Nagorniuk
ZigZag_Keel은 이중 지그재그를 기반으로 한 MetaTrader 5용 기술적 인디케이터입니다. 추세 방향을 결정하고 매수 및 매도 신호를 생성하도록 설계되었습니다. 작동 원리 이 인디케이터는 서로 다른 주기를 가진 두 개의 지그재그를 사용합니다. 주기가 더 긴 KeelOver는 전체 가격 방향을 결정합니다. 주기가 더 짧은 Slalom은 국부적 극값을 찾습니다. 신호는 전체 추세 방향으로만 생성되어 허위 진입을 걸러냅니다. 거래 신호 위쪽 녹색 화살표는 매수 신호를 나타냅니다. 아래쪽 빨간색 화살표는 매도 신호를 나타냅니다. 또한 이 인디케이터는 주요 추세에 반하는 되돌림 구간에서 지정가 주문을 위한 신호를 생성합니다. 거래 가능한 종목 이 인디케이터는 통화쌍, 암호화폐, 지수, 원자재에 적합합니다. 변동성과 유동성이 양호한 종목에서 가장 높은 효과를 보입니다. 권장 시간 프레임 주요 시간 프레임은 M15입니다. M30, H1, H4도 사용 가능합니다. 더 작은 시간 프레임은
XCycle
Igor Nagorniuk
XCycle - MT5용 사이클 기반 트레이딩 인디케이터 개요 XCycle은 시장 사이클 이론에 기반한 전문적인 기술적 분석 인디케이터입니다. 이 인디케이터는 마이너(단기) 및 메이저(장기) 시장 사이클을 감지하여 현재 추세와 시장 변동성을 고려한 매수 및 매도 신호를 생성합니다. 적용 분야 대상 시장: - 외환(Forex) - 모든 주요, 교차 및 이국적 통화쌍 - 암호화폐 - 비트코인, 이더리움, 알트코인(BTC/USD, ETH/USD 등) - 지수 - S&P 500, DAX, NASDAQ 등 - 원자재 - 금(XAU/USD), 은, 원유(WTI, 브렌트) - 주식 - 유동성이 높은 블루칩 종목 시간 프레임: - 스캘핑: M1, M5, M15 - 데이 트레이딩: M30, H1, H4 - 스윙 트레이딩: D1, W1 - 포지션 트레이딩: MN 추천 종목: - 높은 유동성: EUR/USD, GBP/USD, USD/JPY, BTC/USD - 중간 변동성: GBP/JPY, A
Daily End Potential (DEP) v1.20은 MetaTrader 5용 기술 지표로, 지정된 시간 창에서 가격 범위를 분석하고 거래일 종료까지 가격이 위 또는 아래로 움직일 확률을 계산합니다. 지표의 목적 이 지표는 주요 가격 범위가 형성된 후 트레이더가 장중 움직임의 가장 가능성 높은 방향을 결정하는 데 도움을 줍니다. 가격이 범위의 상단 경계에 가까우면 하락 움직임의 잠재력이 더 크고, 그 반대의 경우도 마찬가지입니다. 이 지표는 이 잠재력을 백분율로 계산하고 확률이 지정된 임계값을 초과하면 신호를 발행합니다. 작동 방식 먼저, 트레이더는 가격 범위가 형성되는 시간 간격(예: 12:00~13:00)을 설정합니다. 분석 창이 닫힌 후, 지표는 현재 가격이 범위 경계를 기준으로 어디에 위치하는지 결정합니다. 한 방향으로의 움직임 확률이 임계값(기본값 75%)을 초과하면 지표는 차트에 화살표를 표시하고 목표 레벨을 나타내는 알림을 발행합니다. 적용 가능한 시장 및 상품 이
필터:
리뷰 없음
리뷰 답변