Hurst Cycles Diamonds
- 지표
- 버전: 2.0
- 업데이트됨: 12 3월 2025
- 활성화: 5

Hurst Cycles Diamonds
Description
This indicator is an alternative version inspired by the pioneering work of David Hickson and the Hurst Cycles Notes indicator developed by Grafton. The main objective is to provide a clear and intuitive view of the Hurst cycles.
Credits
- Original Concept: David Hickson - Hurst Cycles Theory
- Inspiration: Grafton - Hurst Diamond Notation Pivots
- Alternative Version: Fillipe dos Santos
Main Features
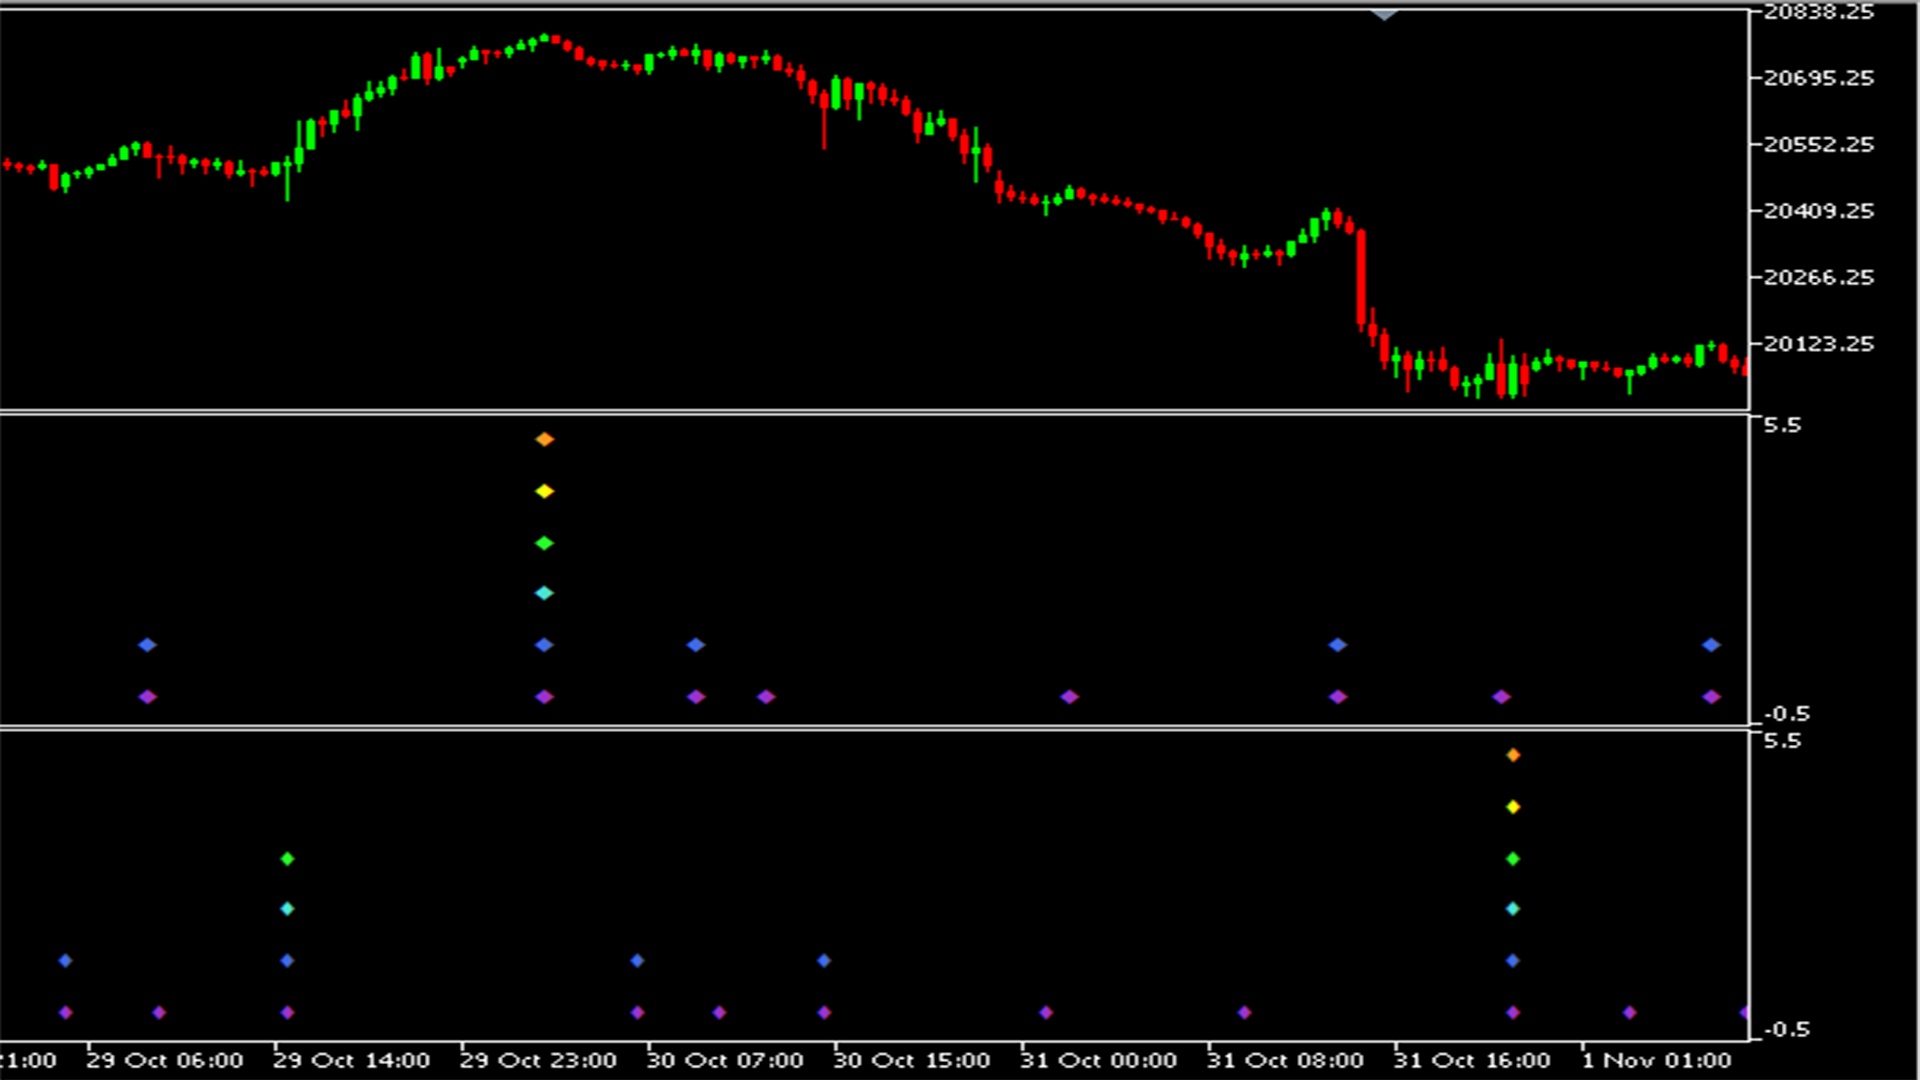
- Identifies and displays pivots in multiple time cycles
- Visual tracking through diamonds to confirm pivots
Features
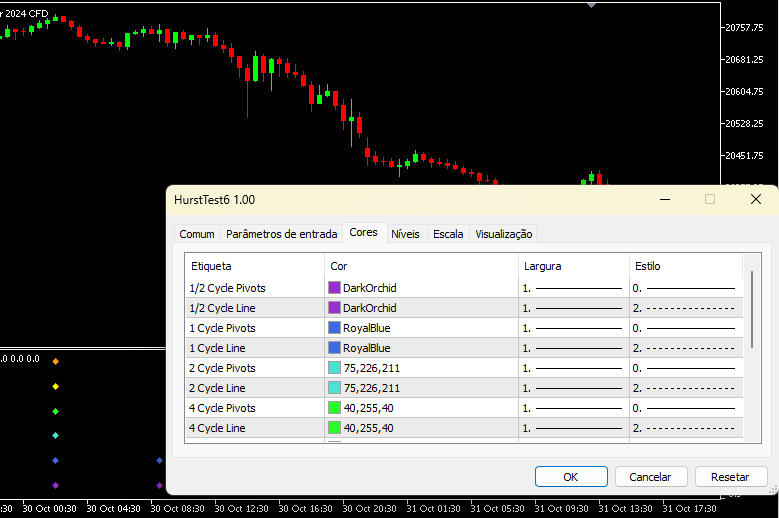
Multiple Cycles:
- Half Cycle (5 bars)
- Full Cycle (10 bars)
- 2x Cycle (20 bars)
- 4x Cycle (40 bars)
- 8x Cycle (80 bars)
- 16x Cycle (160 bars)
- 32x Cycle (320 bars)
Note: Bars can be modified according to your preference.
Visualization
- Diamonds for pivot confirmation
- Customizable color codes for each cycle
- Detailed information
Cycle Information
- Cycle duration in bars
- Time since the last pivot
- Average duration of pivots
- Expected range (+/-)
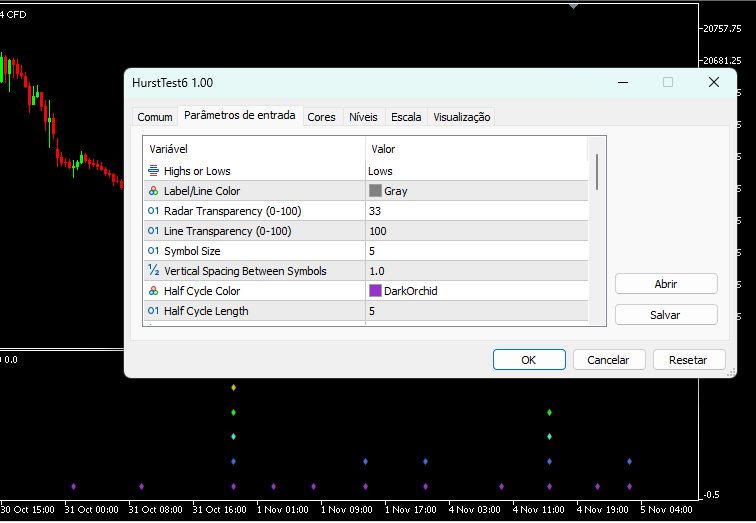
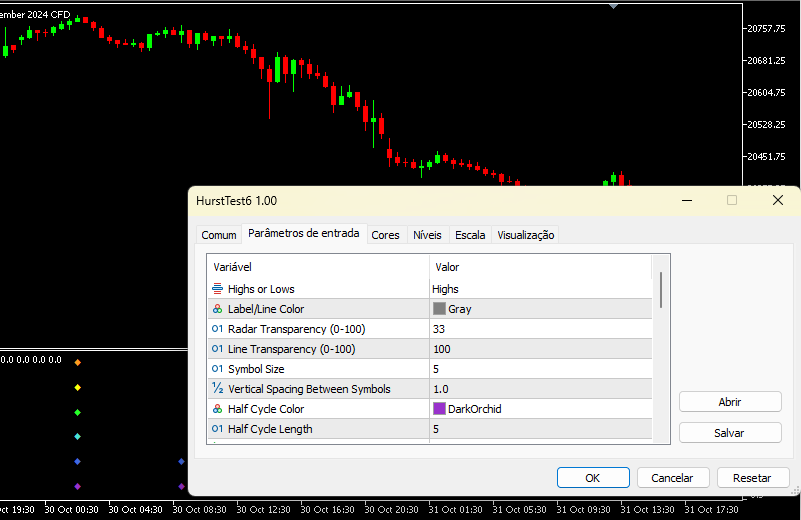
Customization:
- Choose between Top, Bottom, or both analyses
- Adjustable colors for each cycle
- Configurable transparency
How to Use
- Add the indicator to your chart
- Choose between top, bottom, or both analyses
- Adjust colors and transparencies as preferred
- Observe the diamonds in relation to the pivots (the closer to red, the stronger the pivot is)
Important Note
This indicator is a technical analysis tool based on the Hurst cycle theory, but this does not mean it is a 100% accurate indicator or anything of the sort. Always use it in conjunction with other analysis and risk management tools.
Acknowledgments
My special thanks go to David Hickson for the development of the Hurst cycle theory and methodology, and to Grafton for creating the original indicator that served as inspiration for this alternative version.