Market Structure with Inducements and Sweeps NDH
- 지표
-
Cao Minh Quang
 Welcome to my profile. I am a developer MQL4 and MQL5.
Telegram: https://t.me/storevan
Thanks and regards! - 버전: 1.2
- 업데이트됨: 15 5월 2025
- 활성화: 5
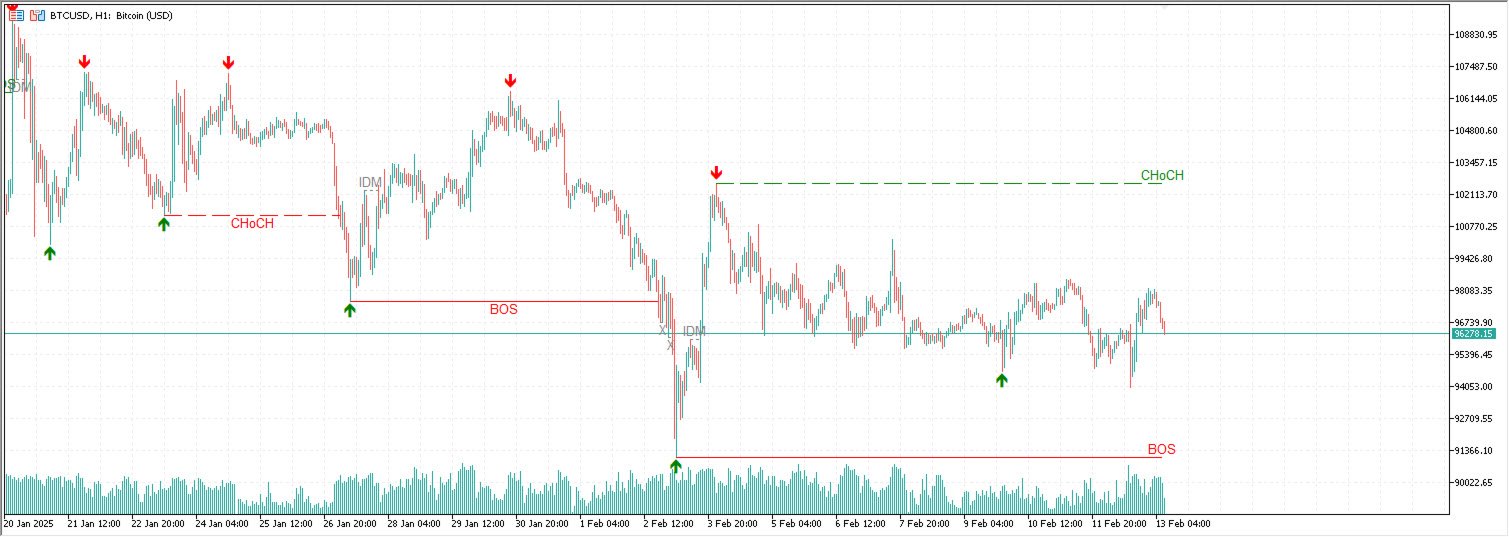
The Market Structure with Inducements & Sweeps indicator is a unique take on Smart Money Concepts related market structure labels that aims to give traders a more precise interpretation considering various factors.
Compared to traditional market structure scripts that include Change of Character (CHoCH) & Break of Structures (BOS) -- this script also includes the detection of Inducements (IDM) & Sweeps which are major components of determining other structures labeled on the chart.
SMC & price action traders have historically considered this a more accurate representation of market structure by including these components.
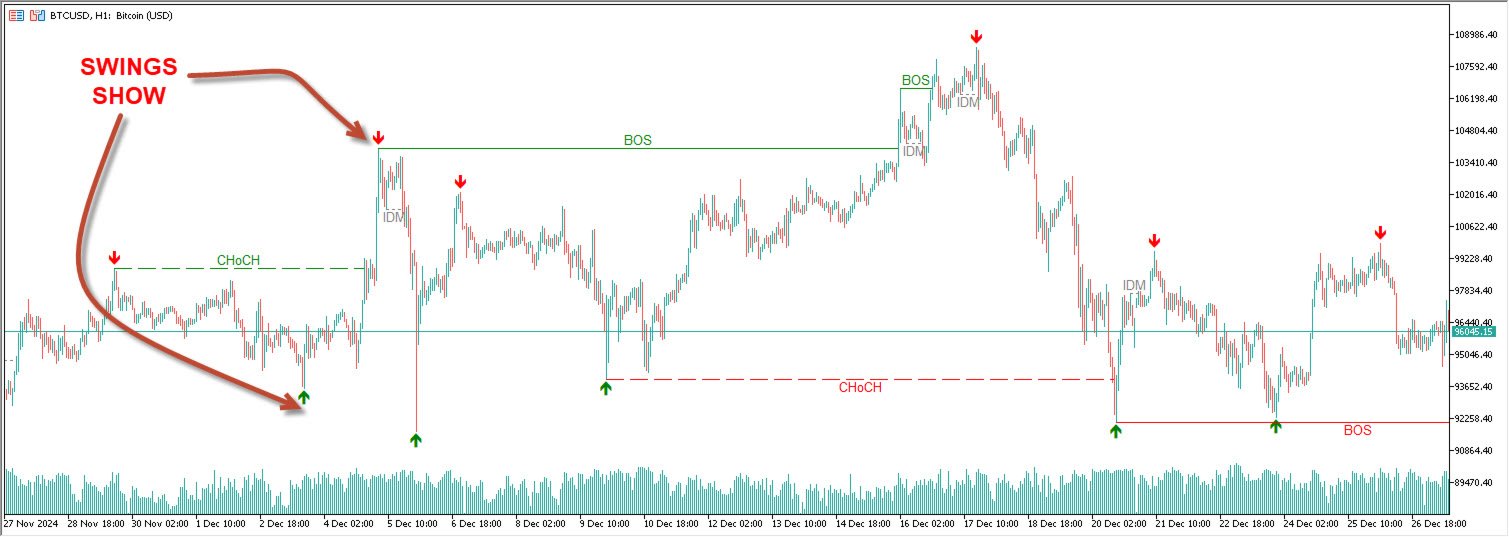
USAGE We can see a diagram for how market structure is displayed within the Market Structure with Inducements & Liquidity indicator.
Change of Characters (CHoCH) and Break of Structures
Change of Characters (CHoCH) are based on swing points detection, while Break of Structures (BOS) are based on trailing maximum & minimums from the detected Change of Characters. We do this for a more dynamic & timely display of market structure.
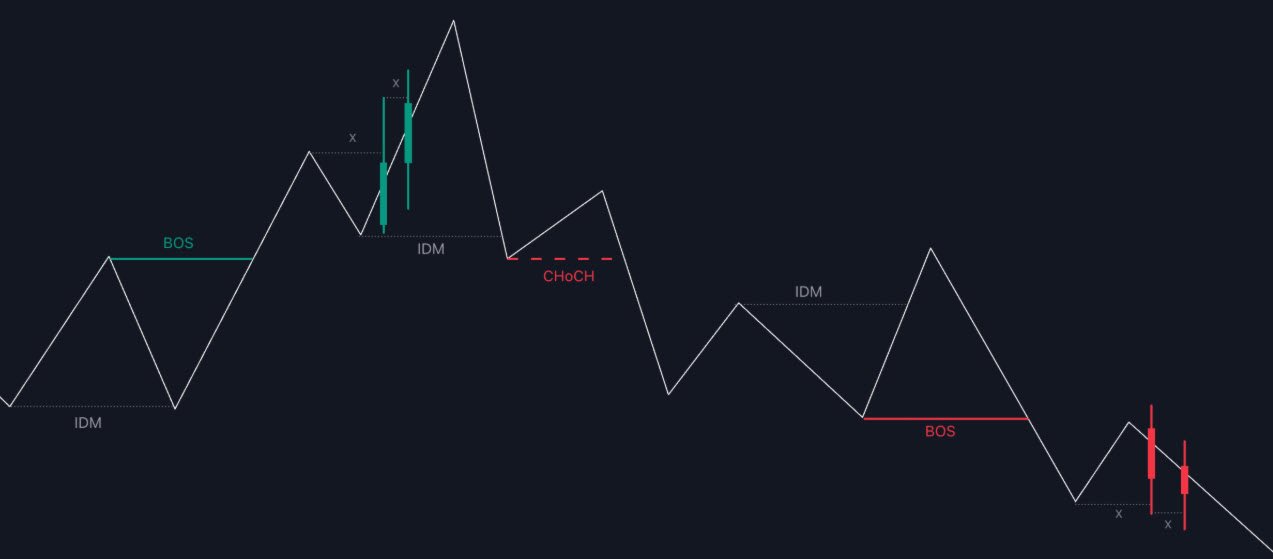
Inducements (IDM)
Traders that consider inducements as a part of their analysis of Change of Characters & Break of Structures can more easily avoid fakeouts within trends as shown below.
In this script IDM's are always required between each market structures.
Sweeps of Liquidity (x)
SMC traders looking to properly analyze market structure need to look for sweeps of liquidity to ensure levels that are wicked are noted as sweeps, while levels that are fully closed above / below are labeled as confirmed market structures.
The Sweeps of Liquidity are also based on trailing maximum / minimum, which allows for a continuous evaluation of areas for liquidity sweeps to occur.
This can be helpful for traders looking for longer term & shorter term sweeps.
EA/ESB-based automation
IDM (Inducement) Variables:
Bearish IDM:
(PREFIX)_BEARISH_IDM_ACTIVE(bool): true when a Bearish IDM is active and false otherwise
(PREFIX)_BEARISH_IDM_START(datetime):Timestamp when Bearish IDM starts
(PREFIX)_BEARISH_IDM_END(datetime):Timestamp when Bearish IDM ends
(PREFIX)_BEARISH_IDM_PRICE(double): Bearish IDM price
Bullish IDM:
(PREFIX)_BULLISH_IDM_ACTIVE(bool):true when a Bullish IDM is active and false otherwise
(PREFIX)_BULLISH_IDM_START(datetime):Timestamp when Bullish IDM starts
(PREFIX)_BULLISH_IDM_END(datetime): Timestamp when Bullish IDM ends
(PREFIX)_BULLISH_IDM_PRICE(double): Bullish IDM price
Sweep (X) Variables:
Bearish Sweep:
(PREFIX)_BEARISH_SWEEP_ACTIVE(bool): true when a Bearish Sweep is active and false otherwise
(PREFIX)_BEARISH_SWEEP_START(datetime):Timestamp when Bearish Sweep starts
(PREFIX)_BEARISH_SWEEP_END(datetime):Timestamp when Bearish Sweep ends
Bullish Sweep:
(PREFIX)_BULLISH_SWEEP_ACTIVE(bool):true when a Bullish Sweep is active and false otherwise
(PREFIX)_BULLISH_SWEEP_START(datetime):Timestamp when Bullish Sweep starts
(PREFIX)_BULLISH_SWEEP_END(datetime): Timestamp when Bullish Sweep ends
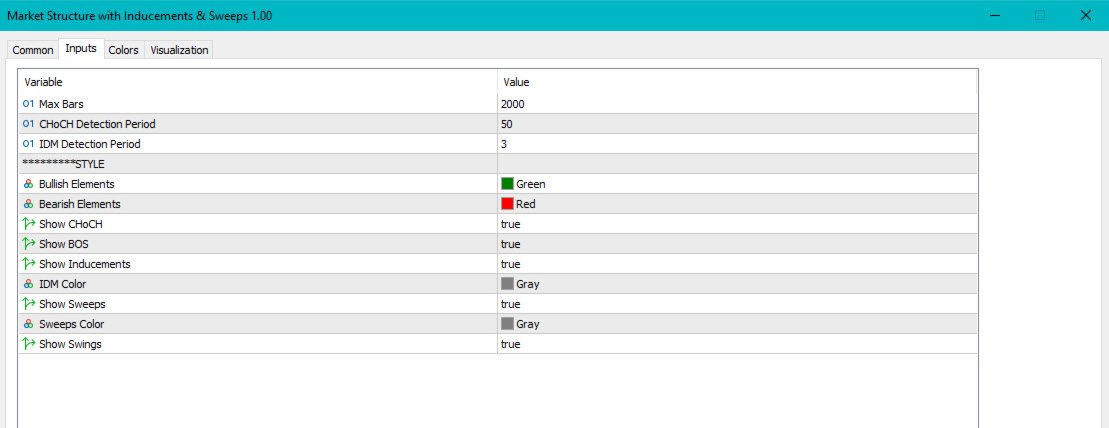
SETTINGS
- CHoCH Detection Period: Detection period for CHoCH's, higher values will return longer term CHoCH's.
- IDM Detection Period: Detection period for IDM's, higher values will return longer term IDM's.