Times and Sales Pro

Times and Sales Pro: Ottimizza le tue operazioni con il Disequilibrio nel Flusso delle Transazioni 📊🚀

🔎 Opportunità in Piccole Variazioni di Prezzo
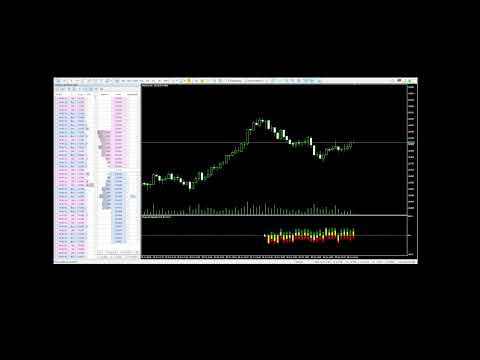
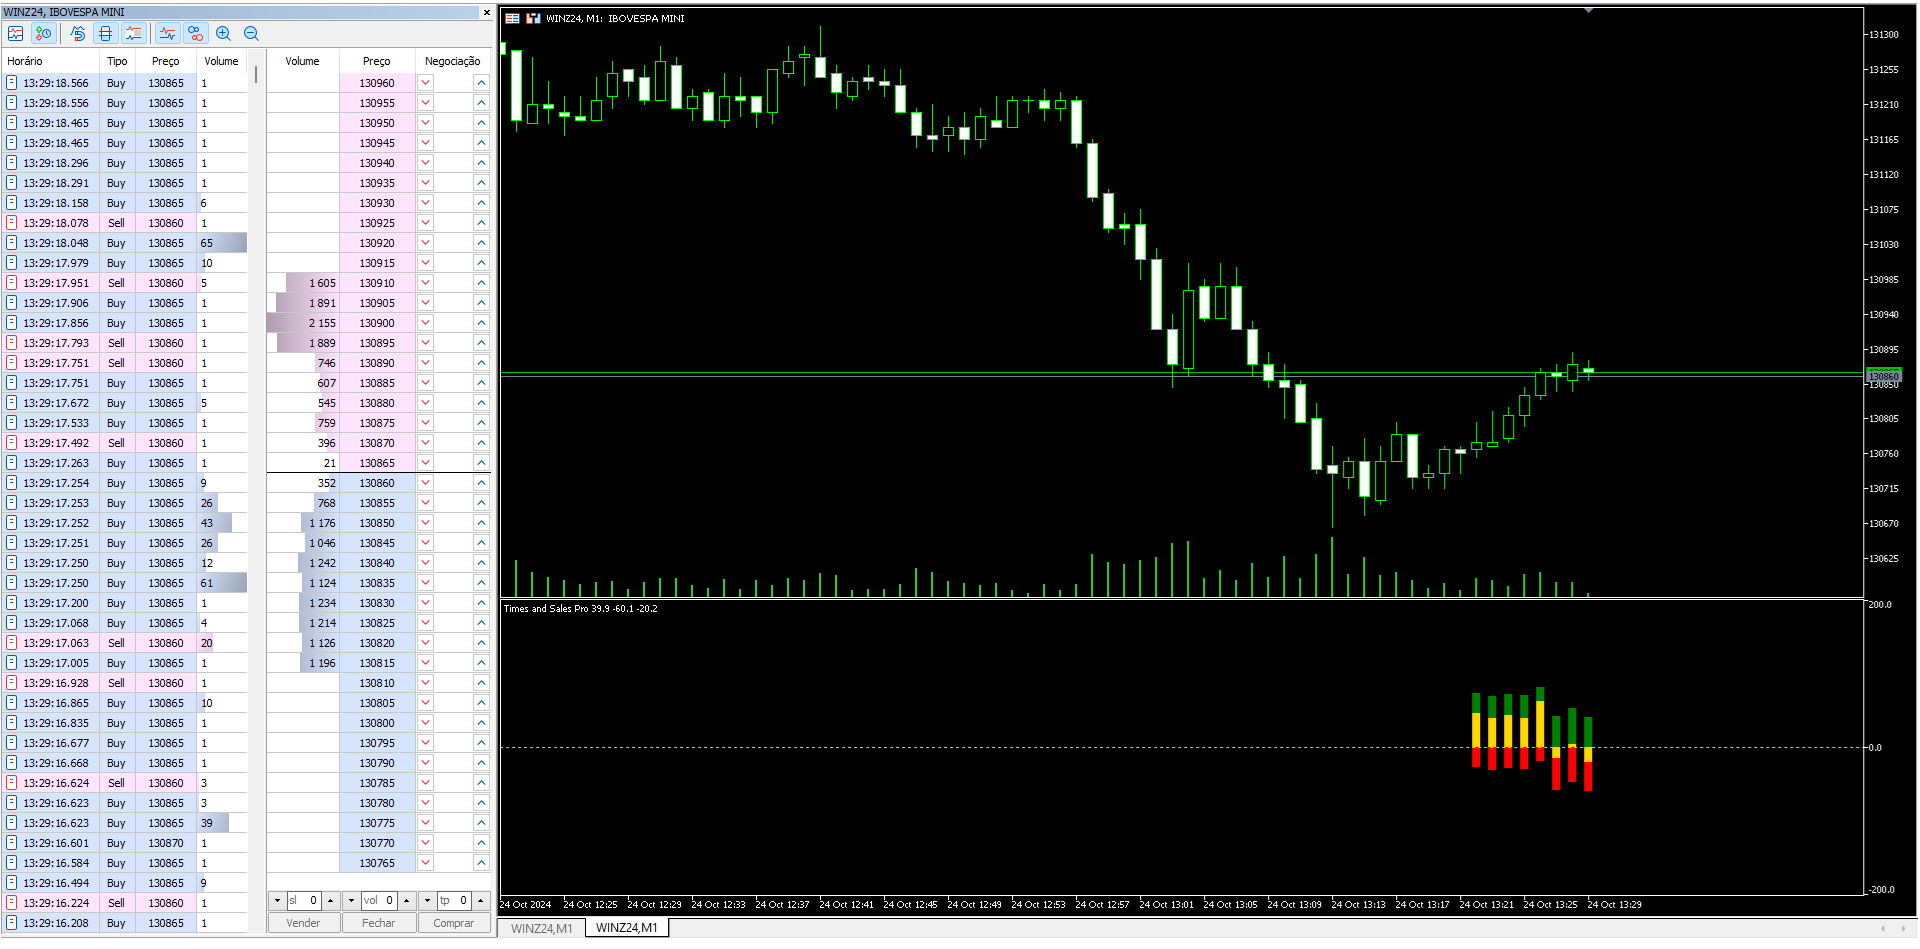
Times and Sales Pro è uno strumento essenziale per gli analisti che operano il flusso degli ordini attraverso Times and Trades. Ideale per gli scalper, è stato progettato per coloro che desiderano sfruttare piccole fluttuazioni di prezzo con alta precisione. Con calcoli avanzati, l'indicatore identifica i disequilibri nelle transazioni, fornendo segnali preziosi per ingressi e uscite rapide.

💡 IMPORTANTE: Disponibilità di Times and Trades su MT5
Prima di utilizzare Times and Sales Pro, assicurati che il tuo broker offra accesso a Times and Trades su MT5. L'indicatore dipende da queste informazioni per generare calcoli precisi in tempo reale, poiché MT5 non memorizza la cronologia delle transazioni. Pertanto, l'indicatore funziona solo in tempo reale, offrendo letture immediate delle transazioni eseguite nel mercato.

🚀 Vantaggi di Times and Sales Pro

  1. Analisi Avanzata del Flusso delle Transazioni con Colori Chiari
    Times and Sales Pro semplifica la visualizzazione del disequilibrio nelle transazioni utilizzando codici colore specifici:

    • Verde: Rappresenta gli ordini di acquisto.
    • Rosso: Rappresenta gli ordini di vendita.
    • Oro: Indica il disequilibrio tra ordini di acquisto e di vendita.

Questi colori consentono una lettura rapida e chiara del flusso delle transazioni, ideale per operazioni a breve termine, in particolare per lo scalping.

  1. Segnali di Acquisto e Vendita in Tempo Reale
    Ottieni segnali chiari e rapidi direttamente nel tuo grafico, consentendo reazioni agili ai cambiamenti nel flusso delle transazioni in tempo reale.

  2. Ideale per Trader del Flusso delle Transazioni
    Se operi basandoti sul flusso degli ordini eseguiti, questo è l'indicatore perfetto per massimizzare la tua efficienza. Offre una visione chiara del disequilibrio tra ordini di acquisto e di vendita, migliorando le tue decisioni con precisione.

  3. Compatibile con la Creazione di Potenti Expert Advisors (EAs)
    Times and Sales Pro offre buffer per l'integrazione con EAs (Expert Advisors). Configura i tuoi buffer per costruire un esperto robusto:

    • Buffer 0: Segnale di acquisto
    • Buffer 1: Segnale di vendita
    • Buffer 2: Disequilibrio (Oro)

Queste funzionalità ti consentono di automatizzare strategie basate sul disequilibrio del flusso delle transazioni e di ottimizzare le tue operazioni.

  1. Facile da Usare e Configurare
    Con la sua interfaccia intuitiva e l'analisi precisa del flusso delle transazioni, Times and Sales Pro semplifica le tue operazioni, offrendo analisi dettagliate in tempo reale senza complicazioni.

Prodotti consigliati
The indicator highlights the points that a professional trader sees in ordinary indicators. VisualVol visually displays different volatility indicators on a single scale and a common align. Highlights the excess of volume indicators in color. At the same time, Tick and Real Volume, Actual range, ATR, candle size and return (open-close difference) can be displayed. Thanks to VisualVol, you will see the market periods and the right time for different trading operations. This version is intended f
FREE
Value Chart Candlesticks
Flavio Javier Jarabeck
4.69 (13)
The idea of a Value Chart indicator was presented in the very good book I read back in 2020 , " Dynamic Trading Indicators: Winning with Value Charts and Price Action Profile ", from the authors Mark Helweg and David Stendahl. The idea is simple and the result is pure genius: Present candlestick Price analysis in a detrended way! HOW TO READ THIS INDICATOR Look for Overbought and Oversold levels. Of course, you will need to test the settings a lot to find the "correct" one for your approach. It
FREE
Weis Waves
Flavio Javier Jarabeck
2.83 (18)
The original author is David Weis, an expert in the Wyckoff Method. The Weis Wave is a modern adaptation of the 1930's Wyckoff Method, another expert in Tape Reading techniques and Chart Analysis. Weis Waves takes market volume and stacks it into waves according to price conditions giving the trader valuable insights about the market conditions. If you want to learn more about this subject you can find tons of videos in YouTube. Just look for "The Wickoff Method", "Weis Wave" and "Volume Spread
FREE
White Weis Volume Ticks
Ricardo Almeida Branco
5 (4)
White Weis Volume This indicator shows the sum of the volume in each wave, bulish or bearish, as idealized by David Weis , but it brings an important addition , which is the marking of the bar with the highest volume of the wave (White Bar)! In coding the indicator, it was sought to optimize the code to require minimal processing during use and not to overload mt5. The indicator can be used for pre-trading analysis and study, where the trader analyzes possible points of support and resistance
Simple QM Pattern MT5
Suvashish Halder
5 (1)
Simple QM Pattern   is a powerful and intuitive trading indicator designed to simplify the identification of the Quasimodo (QM) trading pattern. The QM pattern is widely recognized among traders for effectively signaling potential   reversals   by highlighting key market structures and price action formations. This indicator helps traders easily visualize the QM pattern directly on their charts, making it straightforward even for those who are new to pattern trading. Simple QM Pattern includes d
FREE
Indicator Description 4 Hull MA Color + Envelopes is a powerful trend-following indicator for MetaTrader 5 that combines four Hull Moving Averages (HMA) with Moving Average Envelopes to clearly identify market direction, trend strength, and potential reversal or pullback zones. This indicator is designed to reduce noise, react quickly to price movement, and provide a clean visual structure for professional trading.   Key Features   4 Hull Moving Averages (20, 50, 100, 200) Automatic color change
FREE
Time and Sales Tick
Pablo Filipe Soares De Almeida
Time & Sales Tick Indicator è un indicatore per MetaTrader 5 che mostra i dati dei tick in tempo reale. Visualizza prezzo, volume dei tick e orario direttamente sul grafico. Funzionalità Mostra i dati dei tick, inclusi prezzo, volume e tempo, in un pannello sul grafico. Raggruppa i tick in intervalli definiti dall’utente, con colori distinti (verde per rialzo, rosso per ribasso). Il pannello può essere posizionato in qualsiasi angolo del grafico.
Hunttern ZigZag MT5
Hassan Gh Fakhraei
5 (1)
Hunt markets with Hunttern ZigZag . Easy to use with one parameter    You can use it for the following:       -Classic patterns       -Heads and shoulders       -Harmonic patterns       -Elliott Wave       -Support and resistance       -Supply and Demand Single parameter:      -Period (1-120) Features:        -Candle time        -Single parameter        -Light mode template This is version 1 of Hunttern ZigZag. We are very happy to receive feedback from you.
FREE
Descrizione generale Questo indicatore è una versione avanzata del classico Donchian Channel , arricchita con funzioni operative per il trading reale. Oltre alle tre linee tipiche (massimo, minimo e linea centrale), il sistema rileva i breakout e li segnala graficamente con frecce sul grafico, mostrando solo la linea opposta alla direzione del trend per semplificare la lettura. L’indicatore include: Segnali visivi : frecce colorate al breakout Notifiche automatiche : popup, push e email Filtro R
FREE
High Low Open Close
Alexandre Borela
4.98 (43)
Se ti piace questo progetto, lascia una recensione a 5 stelle. Questo indicatore disegna i prezzi aperti, alti, bassi e di chiusura per i specificati periodo e può essere regolato per un determinato fuso orario. Questi sono livelli importanti guardati da molti istituzionali e professionali commercianti e può essere utile per voi per conoscere i luoghi dove potrebbero essere più attivo. I periodi disponibili sono: Giorno precedente. Settimana precedente. Mese precedente. Precedente trimestre. A
FREE
Girassol Sunflower MT5 Indicator
Saullo De Oliveira Pacheco
4.33 (6)
This is the famous Sunflower indicator for Metatrader5. This indicator marks possible tops and bottoms on price charts. The indicator identifies tops and bottoms in the asset's price history, keep in mind that the current sunflower of the last candle repaints, as it is not possible to identify a top until the market reverses and it is also not possible to identify a bottom without the market stop falling and start rising. If you are looking for a professional programmer for Metatrader5, please
FREE
PZ Penta O MT5
PZ TRADING SLU
3.5 (4)
The Penta-O is a 6-point retracement harmonacci pattern which usually precedes big market movements. Penta-O patterns can expand and repaint quite a bit. To make things easier this indicator implements a twist: it waits for a donchian breakout in the right direction before signaling the trade. The end result is an otherwise repainting indicator with a very reliable trading signal. The donchian breakout period is entered as an input. [ Installation Guide | Update Guide | Troubleshooting | FAQ | A
FREE
OmniSignal Navigator – Smart Entries at Key Levels Trade Like a Professional  with this daily/weekly High-Low-Close indicator, designed for   scalping or intraday short term trading   and precision breakout trading. Suggested Timeframes to trade with: M5 |  DONT USE THE INDICATOR ON THE M1 TIMEFRAME!!! Why It Works   Perfect for Scalping/Intraday:   Targets key zones ( PDH/PDL/PDC & PWH/PWL/PWC ) on   M2, M3, M5, M15   timeframes. (Lower Timeframes = More Signals, Higher Timeframes = Le
FREE
LT Donchian Channel
Thiago Duarte
4.83 (6)
Donchian Channel is an indicator created by Richard Donchian. It is formed by taking the highest high and the lowest low of the last specified period in candles. The area between high and low is the channel for the chosen period. Its configuration is simple. It is possible to have the average between the upper and lower lines, plus you have alerts when price hits one side. If you have any questions or find any bugs, please contact me. Enjoy!
FREE
Follow The Line MT5
Oliver Gideon Amofa Appiah
4.6 (35)
This indicator obeys the popular maxim that: "THE TREND IS YOUR FRIEND" It paints a GREEN line for BUY and also paints a RED line for SELL. (you can change the colors). It gives alarms and alerts of all kinds. IT DOES NOT REPAINT and can be used for all currency pairs and timeframes. Yes, as easy and simple as that. Even a newbie can use it to make great and reliable trades. NB: For best results, get my other premium indicators for more powerful and reliable signals. Get them here: https://www.m
FREE
Note from Developer: This is the lite version of the Double TMA with Bands Indicator. You can find the paid version that comes with alerts and on screen signal arrows built in here . I will also be selling an EA based on this trading system soon once all backtesting and optimization have been completed. Unlock your trading potential with the Double TMA Indicator with Reversal Detection! Designed for swing and reversal trading, this versatile tool integrates two Triangular Moving Averages (
FREE
Free automatic Fibonacci is an indicator that automatically plots a Fibonacci retracement based on the number of bars you select on the BarsToScan setting in the indicator. The Fibonacci is automatically updated in real time as new highest and lowest values appears amongst the selected bars. You can select which level values to be displayed in the indicator settings. You can also select the color of the levels thus enabling the trader to be able to attach the indicator several times with differe
FREE
MIDAS Super VWAP
Flavio Javier Jarabeck
4.27 (11)
Imagine VWAP, MVWAP and MIDAS in one place... Well, you found it! Now you can track the movement of Big Players in various ways, as they in general pursue the benchmarks related to this measuring, gauging if they had good execution or poor execution on their orders. Traders and analysts use the VWAP to eliminate the noise that occurs throughout the day, so they can measure what prices buyers and sellers are really trading. VWAP gives traders insight into how a stock trades for that day and deter
FREE
Donchian Pro
Paulo Henrique Faquineli Garcia
4.75 (4)
The Donchian Channel Channels are among the most popular tools of technical analysis, as they visually convey to the analyst the limits within which most price movement tends to occur. Channel users know that valuable information can be obtained at any time, whether prices are in the central region of a band or close to one of the border lines. One of the best known techniques to explore these concepts is Bollinger Bands. However, John Bollinger was not the only one to research the application
FREE
MACD Enhanced
Nikita Berdnikov
5 (3)
Introducing the MACD  Enhanced – an advanced MACD (Moving Average Convergence Divergence) indicator that provides traders with extended capabilities for trend and momentum analysis in financial markets. The indicator uses the difference between the fast and slow exponential moving averages to determine momentum, direction, and strength of the trend, creating clear visual signals for potential entry and exit points. Attention! To achieve the best results, it is recommended to adapt the indicator
FREE
This is a buyer and seller aggression indicator that analyzes the shape of each candle and project this data in a histogram form. There are 4 histograms in one. On the front we have two: Upper - Buyer force. Lower - Seller force. At the background we also have two histogram, both with same color. They measure the combined strenght of buyers and sellers. This histograms can be turned off in Input Parameters. It is also possible to have the real or tick volume to help on this force measurement. IN
FREE
Bar Color Trend
Germano Chagas
4.38 (8)
Combining the best of Price Action , Directional Movement , and Divergence/Convergence analysis, Candle Color Trend is a easy and reliable way to identify trend direction. The indicator automatically paints the candles according to the assumption that an uptrend is defined by prices that form a series of higher highs and higher lows. In contrast, a downtrend is defined by prices that form a series of lower highs and lower lows. Additionally, ADX Wilder indicator is used to measure trend weakness
FREE
FlatBreakout MT5
Aleksei Vorontsov
FlatBreakout MT5 (Free Version) Flat Range Detector and Breakout Panel for MT5 — GBPUSD Only FlatBreakout MT5   is the free version of the professional FlatBreakoutPro MT5 indicator, specially designed for flat (range) detection and breakout signals on the   GBPUSD   pair only. Perfect for traders who want to experience the unique fractal logic of FlatBreakout MT5 and test breakout signals on a live market without limitations. Who Is This Product For? For traders who prefer to trade breakout of
FREE
Waves Sizer
Flavio Javier Jarabeck
3.86 (7)
Wyckoff fans, enjoy! Ideally to be used with the Weis Waves indicator, but it can be easily used alone, the Waves Sizer puts the range (in resulting Price movement) done by the Price on its market swings. You can control how accurate or loose will be the swings. This tool is very helpful for visually know how much the Price has traveled in your Timeframe. This way you can confront this level of effort with the resulting Volume, etc... Weis Waves indicator: https://www.mql5.com/en/market/produc
FREE
ATR Plus is an enhanced version of the classic ATR that shows not just volatility itself, but the directional energy of the market . The indicator converts ATR into a normalized oscillator (0–100), allowing you to clearly see: who dominates the market — buyers or sellers when a trend begins when a trend loses strength when the market shifts into a range where volatility reaches exhaustion zones ATR Plus is perfect for momentum, trend-following, breakout and volatility-based systems. How ATR Plus
FREE
Are you tired of drawing trendlines every time you're analyzing charts? Or perhaps you would like more consistency in your technical analysis. Then this is for you. This indicator will draw trend lines automatically when dropped on a chart. How it works Works similar to standard deviation channel found on mt4 and mt5. It has 2 parameters: 1. Starting Bar 2. Number of bars for calculation The   starting bar   is the bar which drawing of the trend lines will begin, while the   number of bars for c
FREE
Basic Vwap
james mugendi
4 (1)
Simple Vwap with the daily, weekly and monthly VWAP is the abbreviation for   volume-weighted average price , which is a technical analysis tool that shows the ratio of an asset's price to its total trade volume. It provides traders and investors with a measure of the average price at which a stock is traded over a given period of time. How it's used Identify entry and exit points:   Traders can use VWAP to determine when to buy or sell an asset.   Understand price trends :  Traders can use V
FREE
Pivot Point Fibo RSJ è un indicatore che traccia le linee di supporto e resistenza del giorno utilizzando i tassi di Fibonacci. Questo spettacolare indicatore crea fino a 7 livelli di supporto e resistenza tramite Pivot Point utilizzando i tassi di Fibonacci. È fantastico come i prezzi rispettino ogni livello di questo supporto e resistenza, dove è possibile percepire possibili punti di entrata/uscita di un'operazione. Caratteristiche Fino a 7 livelli di supporto e 7 livelli di resistenza Im
FREE
Aggression Volume
Flavio Javier Jarabeck
4.29 (17)
Aggression Volume Indicator is the kind of indicator that is rarely found in the MQL5 community because it is not based on the standard Volume data provided by the Metatrader 5 platform. It requires the scrutiny of all traffic Ticks requested on the platform... That said, Aggression Volume indicator requests all Tick Data from your Broker and processes it to build a very special version of a Volume Indicator, where Buyers and Sellers aggressions are plotted in a form of Histogram. Additionally,
FREE
Weis Wave Double Side
Eduardo Da Costa Custodio Santos
L'indicatore laterale Weis Wave Bouble per MT5 fa parte del toolkit (Wyckoff Academy Wave Market) L'indicatore laterale Weis Wave Bouble per MT5 è stato creato sulla base della già consolidata Weis Wave creata da David Weis. L'indicatore Weis Wave Double Side legge il mercato a ondate come è stato fatto da R. Wyckoff nel 1900. Aiuta a identificare sforzo x risultato, causa ed effetto e domanda e offerta Il suo differenziale è che può essere utilizzato sotto l'asse zero, migliorando ulteriormente
Gli utenti di questo prodotto hanno anche acquistato
ARIPoint
Temirlan Kdyrkhan
ARIPoint is a powerful trading companion designed to generate high-probability entry signals with dynamic TP/SL/DP levels based on volatility. Built-in performance tracking shows win/loss stats, PP1/PP2 hits, and success rates all updated live. Key Features: Buy/Sell signals with adaptive volatility bands Real-time TP/SL/DP levels based on ATR Built-in MA Filter with optional ATR/StdDev volatility Performance stats panel (Success, Profit/Loss, PP1/PP2) Alerts via popup, sound, push, or email Cu
Super Signal – Skyblade Edition Sistema professionale di segnali di tendenza senza repaint / senza ritardo con tasso di vincita eccezionale | Per MT4 / MT5 Funziona meglio su timeframe più bassi, come 1 minuto, 5 minuti e 15 minuti. Caratteristiche principali: Super Signal – Skyblade Edition è un sistema intelligente di segnali progettato specificamente per il trading di tendenza. Utilizza una logica di filtraggio multilivello per identificare esclusivamente i movimenti direzionali forti, supp
Azimuth Pro
Ottaviano De Cicco
5 (4)
LAUNCH PROMO Azimuth Pro price is initially set at 299$ for the first 100 buyers. Final price will be 499$ . THE DIFFERENCE BETWEEN RETAIL AND INSTITUTIONAL ENTRIES ISN'T THE INDICATOR — IT'S THE LOCATION. Most traders enter at arbitrary price levels, chasing momentum or reacting to lagging signals. Institutions wait for price to reach structured levels where supply and demand actually shift. Azimuth Pro maps these levels automatically: swing-anchored VWAP, multi-timeframe structure lines, an
Pointer Trend Switch — precision trend reversal indicator Pointer Trend Switch is a high-precision arrow indicator designed to detect key moments of trend reversal based on asymmetric price behavior within a selected range of bars. It identifies localized price impulses by analyzing how far price deviates from the opening level, helping traders find accurate entry points before a trend visibly shifts. This indicator is ideal for scalping, intraday strategies, and swing trading, and performs equa
L’indicatore evidenzia le zone in cui viene dichiarato interesse sul mercato , per poi mostrare la zona di accumulo degli ordini . Funziona come un book degli ordini su larga scala . Questo è l’indicatore per i grandi capitali . Le sue prestazioni sono eccezionali. Qualsiasi interesse ci sia nel mercato, lo vedrai chiaramente . (Questa è una versione completamente riscritta e automatizzata – non è più necessaria un’analisi manuale.) La velocità di transazione è un indicatore concettualmente nuo
TrendMaestro5
Stefano Frisetti
Attenzione alle truffe, questo indicatore e' distribuito esclusivamente su MQL5.com nota: questo indicatore e' per METATRADER5, se vuoi la versione per  METATRADER4 questo e' il link:   https://www.mql5.com/it/market/product/108106 TRENDMAESTRO ver 2.5 TRENDMAESTRO   riconosce un nuovo TREND sul nascere, non sbaglia mai. La sicurezza di identificare un nuovo TREND non ha prezzo. DESCRIZIONE TRENDMAESTRO identifica un nuovo TREND sul nascere, questo indicatore prende in esame la volatilita' i
RelicusRoad Pro: Sistema Operativo Quantitativo di Mercato 70% DI SCONTO ACCESSO A VITA (TEMPO LIMITATO) - UNISCITI A 2.000+ TRADER Perché la maggior parte dei trader fallisce anche con indicatori "perfetti"? Perché operano su Singoli Concetti isolati. Un segnale senza contesto è una scommessa. Per vincere serve CONFLUENZA . RelicusRoad Pro non è un semplice indicatore. È un Ecosistema Quantitativo completo . Mappa la "Fair Value Road", distinguendo tra rumore e rotture strutturali. Smetti di in
Innanzitutto, vale la pena sottolineare che questo Strumento di Trading è un Indicatore Non-Ridipingente, Non-Ridisegnante e Non-Laggante, il che lo rende ideale per il trading professionale. Corso online, manuale utente e demo. L'Indicatore Smart Price Action Concepts è uno strumento molto potente sia per i nuovi che per i trader esperti. Racchiude più di 20 utili indicatori in uno solo, combinando idee di trading avanzate come l'Analisi del Trader del Circolo Interno e le Strategie di Tradin
Trend deviation scalper
Ekaterina Saltykova
1 (1)
Trend deviation scalper - is the manual system to scalp choppy market places. Indicator defines bull/bear trend and it's force. Inside exact trend system also defines "weak" places, when trend is ready to reverse. So as a rule, system plots a sell arrow when bull trend becomes weak and possibly reverses to bear trend. For buy arrow is opposite : arrow is plotted on bear weak trend. Such arrangement allows you to get a favorable price and stand up market noise. Loss arrows are closing by common p
Native Channels
BeeXXI Corporation
5 (1)
This indicator recognizes all support and resistance levels. A number of unique high-performance techniques have been applied, which made the existence of this indicator possible. All formed channels are naturally visible: horizontal linear linear parabolic cubic (Polynomial 3 degrees - Wave) This is due to a bundle of approximating channels. The formed channels form "standing waves" in a hierarchical sequence. Thus, all support and resistance levels are visible. All parameter management is i
L'indicatore " Dynamic Scalper System MT5 " è progettato per il metodo di scalping, ovvero per il trading all'interno di onde di trend. Testato sulle principali coppie di valute e sull'oro, è compatibile con altri strumenti di trading. Fornisce segnali per l'apertura di posizioni a breve termine lungo il trend, con ulteriore supporto al movimento dei prezzi. Il principio dell'indicatore. Le frecce grandi determinano la direzione del trend. Un algoritmo per generare segnali per lo scalping sott
Scalping Winning Signals Pro SWS
Muhammad Usman Siddique
5 (1)
UZFX SWS {Scalping Winning Signals} Pro v1.0 è un potente indicatore non ridipingente sviluppato da Usman Zabir (UZFX LABS) appositamente per scalper, day trader e swing trader alla ricerca di segnali di ingresso precisi in mercati in rapido movimento. Ideale per i trader che richiedono segnali affidabili e in tempo reale senza ritardi o false ridipinture. I MIEI INTERVALLI DI TEMPO CONSIGLIATI*: 30 M E OLTRE. {1H} È IL MIO PREFERITO. E I RISULTATI SONO SORPRENDENTI...! Le caratteristiche prin
ARIScalping
Temirlan Kdyrkhan
ARIScalp is a powerful trading companion designed to generate high-probability entry signals with dynamic TP/SL/DP levels based on volatility. Built-in performance tracking shows win/loss stats, PP1/PP2 hits, and success rates all updated live. Key Features: Buy/Sell signals with adaptive volatility bands Real-time TP/SL/DP levels based on ATR Built-in MA Filter with optional ATR/StdDev volatility Performance stats panel (Success, Profit/Loss, PP1/PP2) Alerts via popup, sound, push, or email Cus
Scalping Lines System MT5 - è un sistema di trading scalping specificamente progettato per il trading dell'oro, l'asset XAUUSD, su timeframe M1-M5. Combina indicatori per l'analisi di trend, volatilità e ipercomprato/ipervenduto, riuniti in un unico oscillatore per l'identificazione di segnali a breve termine. Tutti i parametri interni per le linee di segnale sono preconfigurati. Il parametro "Durata dell'onda di tendenza", che regola la durata di una serie di segnali nella direzione del trend
ARICoins
Temirlan Kdyrkhan
ARICoin is a powerful trading companion designed to generate high-probability entry signals with dynamic TP/SL/DP levels based on volatility. Built-in performance tracking shows win/loss stats, PP1/PP2 hits, and success rates all updated live. Key Features: Buy/Sell signals with adaptive volatility bands Real-time TP/SL/DP levels based on ATR Built-in MA Filter with optional ATR/StdDev volatility Performance stats panel (Success, Profit/Loss, PP1/PP2) Alerts via popup, sound, push, or email Cust
AriX
Temirlan Kdyrkhan
AriX Indicator for MT5 A powerful trend-following and signal-evaluation tool AriX is a custom MT5 indicator that combines Moving Averages and ATR-based risk/reward logic to generate clear buy/sell signals. It visualizes dynamic SL/TP levels, evaluates past trade outcomes, and displays win/loss statistics in a clean on-chart panel. Key features include: Buy/Sell signals based on MA crossovers ATR-based SL/TP1/TP2/TP3 levels with visual lines and labels Signal outcome tracking with real-time stat
Weis Wave with Alert MT5
Trade The Volume Waves Single Member P.C.
4.94 (17)
Rental/Lifetime Package Options and Privileges  Rent Monthly Six Months   Yearly/Lifetime Weis Wave with Speed with Alert+Speed Index x x x Manual  x x x Quick Set up Video x x x Blog x x x Lifetime Updates x x x Setup and Training Material x x Discord Access Channel "The SI traders"          x Rectangle Break Alert Tool      x How to trade with it:    http://www.tradethevolumewaves.com   ** If you purchase please contact me to setup your  : Training Room and  complete manual access.  Wei
The AX Forex Indicator MT5 is a sophisticated trading tool designed to provide traders with a comprehensive analysis of multiple currency pairs. This   powerful indicator   simplifies the complex nature of the forex market, making it accessible for both novice and experienced traders. AX Forex Indicator uses   advanced algorithms   to detect trends, patterns and is an essential tool for traders aiming to enhance their forex trading performance. With its robust features, ease of use, and reliabl
Introduction to X3 Chart Pattern Scanner X3 Cherart Pattern Scanner is the non-repainting and non-lagging indicator detecting X3 chart patterns including Harmonic pattern, Elliott Wave pattern, X3 patterns, and Japanese Candlestick patterns. Historical patterns match with signal patterns. Hence, you can readily develop the solid trading strategy in your chart. More importantly, this superb pattern scanner can detect the optimal pattern of its kind. In addition, you can switch on and off individu
Recommended TimeFrame >= H1. 100% Non Repainted at any moment.  Use it carefully, only with Trend Direction. Trading Usage: 2 Variants: as Range System or as BreakOut System (Both Only With Trend Direction)::: (Always use StopLoss for minimise Risk); [1] as Range System: (Recommended) in UP TREND:  - BUY in Blue Line , then if price goes down by 50 points (on H1) open Second BUY.   Close in any Profit you wish: TrailingStop(45 points) or Close when Price touches upper Gold Line. in DOWN TREND
TPA True Price Action indicator reveals the true price action of the market makers through 100% non-repainting signals strictly at the close of a candle! TPA shows entries and re-entries, every time the bulls are definitely stronger than the bears and vice versa. Not to confuse with red/green candles. The shift of power gets confirmed at the earliest stage and is ONE exit strategy of several. There are available now two free parts of the TPA User Guide for our customers. The first "The Basics"
Presenting one-of-a-kind Gann Indicator for XAUUSD IQ Gold Gann Levels is a non-repainting, precision tool designed exclusively for XAUUSD/Gold intraday trading. It uses W.D. Gann’s square root method to plot real-time support and resistance levels, helping traders spot high-probability entries with confidence and clarity. William Delbert Gann (W.D. Gann) was an exceptional market analyst whose trading technique was based on a complex blend of mathematics, geometry, astrology, and ancient calcul
The Super Arrow Indicator provides non-repainting buy and sell signals with exceptional accuracy. Key Features No repainting – confirmed signals remain fixed Clear visual arrows: green for buy, red for sell Real-time alerts via pop-up, sound, and optional email Clean chart view with no unnecessary clutter Works on all markets: Forex, gold, oil, indices, crypto Adjustable Parameters TimeFrame Default:   "current time frame" Function:   Sets the time frame for indicator calculation Options:   Can
Piranha version 2
Maria Strudov
5 (1)
"Piranha" - an autonomous trading system that determines overbought and oversold levels on the chart. Red and blue zones represent overbought and oversold levels respectively. Entry points are marked with arrows: a downward arrow in the red zone for "sell" and an upward arrow in the blue zone for "buy". The Take profit level is indicated by the green moving average. Key features: Adjusting the Take profit level as the green moving average changes position. Averaging ability when a new market e
WVAP Scalping
Domantas Juodenis
VWAP Scalping Pro – Advanced VWAP & Market Profile System Professional-Grade VWAP + Market Profile Technology for Precision Trading VWAP Scalping Pro is an advanced analytical tool that integrates Volume-Weighted Average Price (VWAP) analysis with professional Market Profile visualization. It provides traders with institutional-style insights into price structure, volume distribution, and session dynamics — ideal for scalping, intraday, and swing trading strategies. Key Features Triple VWAP St
Big Player Range
Thalles Nascimento De Carvalho
5 (3)
BigPlayerRange – Il miglior indicatore per MT5 BigPlayerRange è considerato il miglior indicatore per Mini Indice e Mini Dollaro su MetaTrader 5. Questo strumento essenziale evidenzia le zone strategiche di azione dei grandi player, offrendo un’analisi tecnica istituzionale di altissima precisione. Come usare BigPlayerRange: Questo indicatore mostra zone di acquisto (linea verde) e di vendita (linea rossa). Quando il prezzo chiude fuori da queste aree, è probabile un movimento di tendenz
UZFX {SSS} Scalping Smart Signals MT5 è un indicatore di trading ad alte prestazioni non ridipinto progettato per scalper, day trader e swing trader che richiedono segnali accurati e in tempo reale in mercati in rapida evoluzione. Sviluppato da (UZFX-LABS), questo indicatore combina l'analisi dell'andamento dei prezzi, la conferma del trend e il filtraggio intelligente per generare segnali di acquisto e vendita ad alta probabilità su tutte le coppie di valute e tutti i timeframe. Caratteristich
MetaForecast M5
Vahidreza Heidar Gholami
5 (3)
MetaForecast predice e visualizza il futuro di qualsiasi mercato basandosi sull'armonia dei dati dei prezzi. Sebbene il mercato non sia sempre prevedibile, se esiste un modello nei prezzi, MetaForecast può prevedere il futuro con la massima precisione possibile. Rispetto ad altri prodotti simili, MetaForecast può generare risultati più accurati analizzando le tendenze di mercato. Parametri di input Past size (Dimensione passata) Specifica il numero di barre che MetaForecast utilizza per creare
IVISTscalp5
Vadym Zhukovskyi
5 (6)
What's new about iVISTscalp5 forecast indicator (Version 10)? iVISTscalp5 is a unique nonlinear forecasting for a week ahead system for any financial instrument which executes fast scalping using time levels. iVISTscalp5 is a tool for easy study and understanding of financial market. 1) iVISTscalp5 forecast indicator has been completely rewritten into another programming language (C++), which has accelerated data loading and processing. As a result, a different graphical display of forecasts
Step into the world of Forex trading with confidence, clarity, and precision using Gold Indicator a next-generation tool engineered to take your trading performance to the next level. Whether you’re a seasoned professional or just beginning your journey in the currency markets, Gold Indicator equips you with powerful insights and help you trade smarter, not harder. Built on the proven synergy of three advanced indicators, Gold Indicator focuses exclusively on medium and long-term trends elimina
Altri dall’autore
Big Player Range
Thalles Nascimento De Carvalho
5 (3)
BigPlayerRange – Il miglior indicatore per MT5 BigPlayerRange è considerato il miglior indicatore per Mini Indice e Mini Dollaro su MetaTrader 5. Questo strumento essenziale evidenzia le zone strategiche di azione dei grandi player, offrendo un’analisi tecnica istituzionale di altissima precisione. Come usare BigPlayerRange: Questo indicatore mostra zone di acquisto (linea verde) e di vendita (linea rossa). Quando il prezzo chiude fuori da queste aree, è probabile un movimento di tendenz
Box Weis Wave
Thalles Nascimento De Carvalho
5 (1)
Eleva la Tua Analisi con il Weis Wave Box ! Se cerchi precisione e chiarezza nelle tue operazioni , il Weis Wave Box è lo strumento ideale. Questo indicatore avanzato di onde di volume offre una visualizzazione chiara della dinamica tra sforzo e risultato nel mercato, essenziale per i trader che utilizzano la lettura del flusso e del volume. Caratteristiche principali: Onde di volume personalizzabili – regola in ticks per allinearti alla tua strategia. Storico regolabile – analizza pe
VWAP FanMaster
Thalles Nascimento De Carvalho
3.5 (2)
VWAP FanMaster: Padroneggia la strategia del pullback con precisione! VWAP FanMaster è l'indicatore definitivo per i trader che cercano entrate precise e pullback efficaci . Combina la potenza del VWAP (Prezzo Medio Ponderato per il Volume) con le linee Fibonacci Fan , fornendo una mappa chiara delle zone di interesse nel mercato. Caratteristiche principali Semplice ma potente : Basta spostare le linee verticali e l'indicatore traccerà automaticamente VWAP e le linee Fibonacci Fan .
FREE
Tape Hunter
Thalles Nascimento De Carvalho
Tape Hunter – Il tuo radar Sforzo vs Risultato su MT5 Tape Hunter è l’indicatore definitivo per i trader che vogliono vedere il vero gioco dei prezzi su MetaTrader 5. Mostra in modo chiaro e intuitivo i volumi aggressivi di acquisto e vendita basati sul POC (Point of Control), permettendoti di visualizzare lo sforzo del mercato e il risultato reale di ogni candela. ️ Perché è importante? Non tutti i volumi muovono il prezzo! Tape Hunter evidenzia se lo sforzo (volume aggressivo) sta davv
Swing Point Volume
Thalles Nascimento De Carvalho
Swing Point Volume, the indicator that signals weakness and strength at the tops and bottoms. This indicador can be for used the Wyckoff Method. Information provided; - Swing on customized ticks. - Volume and points in each balance sheet. - Percentage of Displacement. - Sound alert option on top and bottom breaks. - Volume in ticks and Real Volume. - Volume HL (extreme) or (opening and closing) - Customized volume shapes.
Imbalance DOM Pro
Thalles Nascimento De Carvalho
5 (1)
Imbalance DOM Pro: Potenzia le tue operazioni con l'imbalance del book HAI ACCESSO AL BOOK SU MT5? VUOI PORTARE IL TUO TRADING A UN LIVELLO SUPERIORE? Se fai trading basato sul flusso degli ordini, Imbalance DOM Pro può rivoluzionare la tua analisi. Perfetto per scalper e trader a breve termine, questo strumento identifica gli squilibri nel book degli ordini, offrendo opportunità di trading preziose per entrate e uscite rapide e precise. Cogli opportunità nei piccoli movimenti di prezzo
Volume Flow Binance
Thalles Nascimento De Carvalho
Volume Flow Binance! Hai mai immaginato di poter accedere ai times and trades della tua criptovaluta preferita, con dettagli sul flusso dei volumi e sull'analisi dei movimenti di prezzo, anche se il tuo broker non offre un accesso completo alla cronologia delle transazioni? Con Volume Flow Binance , ora è realtà! Questo script in MQL5 è stato progettato per i trader di criptovalute che cercano una visione dettagliata della dinamica del mercato in tempo reale. Caratteristiche princ
FREE
Book Data Binance
Thalles Nascimento De Carvalho
Book Data Binance! Hai mai immaginato di avere accesso al libro degli ordini della tua criptovaluta preferita, con dettagli su prezzi, volumi e analisi degli squilibri, anche se il tuo exchange non offre accesso al DOM? Con Book Data Binance, questa possibilità diventa realtà! Questo script in MQL5 è stato sviluppato appositamente per i trader di criptovalute che cercano una comprensione approfondita delle dinamiche di mercato. Caratteristiche principali: Accesso diretto al libro
FREE
Cumulative Volume Bands
Thalles Nascimento De Carvalho
CVB Cumulative Volume Bands: Potenzia le tue operazioni con il volume accumulato! CVB Cumulative Volume Bands è un indicatore avanzato progettato per i trader che cercano segnali precisi basati sul volume accumulato. Utilizzando bande di volume accumulato, questo indicatore offre letture chiare delle pressioni di acquisto e vendita nel mercato, aiutando a identificare inversioni e forti movimenti dei prezzi. Cumulative Volume Bands for MT5 ! Caratteristiche principali: Analisi
Footprint Hunter
Thalles Nascimento De Carvalho
Footprint Hunter – Il tuo radar Sforzo vs Risultato su MT4 Tape Hunter è l’indicatore definitivo per i trader che vogliono vedere il vero gioco dei prezzi su MetaTrader 4. Mostra in modo chiaro e intuitivo i volumi aggressivi di acquisto e vendita basati sul POC (Point of Control), permettendoti di visualizzare lo sforzo del mercato e il risultato reale di ogni candela. ️ Perché è importante? Non tutti i volumi muovono il prezzo! Tape Hunter evidenzia se lo sforzo (volume aggressivo) sta
Atr Projection
Thalles Nascimento De Carvalho
L'indicateur ATR Projeção se distingue comme un outil robuste dans l'analyse technique, conçu pour fournir des informations précises sur les limites potentielles des mouvements de prix sur les marchés financiers. Son approche flexible permet aux utilisateurs de personnaliser de manière intuitive les métriques d'analyse, en s'adaptant aux besoins spécifiques de chaque actif négocié. Fonctionnement personnalisable : Par défaut, l'ATR Projeção fonctionne en considérant 30 % de la moyenne des 100
Long Short Pro
Thalles Nascimento De Carvalho
Indicatore Long & Short - Versione Pro: Sblocca il Potenziale Illimitato della Tua Analisi di Mercato! Nessuna Limitazione per Qualsiasi Attivo La versione Pro dell’indicatore Long & Short ti offre la libertà totale di utilizzarlo su qualsiasi strumento finanziario. Niente più limitazioni – applica lo stesso indicatore a tutti i tuoi attivi preferiti! Senza Limitazioni Approfitta di tutte le funzionalità dell’indicatore senza alcuna restrizione. La versione Pro offre un’esperienza c
AI Channel
Thalles Nascimento De Carvalho
AI Channel | Indicatore MT5 con intelligenza artificiale per canali di prezzo AI Channel: Strumento avanzato di analisi tecnica basato sull’intelligenza artificiale AI Channel è uno strumento potente che utilizza l’intelligenza artificiale per analizzare i canali di prezzo nei mercati finanziari. In questa sezione esploreremo come questo indicatore rivoluzionario possa aiutare investitori e trader a prendere decisioni più informate e strategiche. Cos’è l’indicatore AI Channel? AI Ch
Didi Index Volume
Thalles Nascimento De Carvalho
Presentiamo il Didi Index Volume, un indicatore di analisi tecnica sviluppato dal trader brasiliano Odir Aguiar, che si distingue per il suo approccio avanzato e potente nell'individuazione delle opportunità nei mercati finanziari. Disponibile su diverse piattaforme, il Didi Index Volume è diventato uno strumento essenziale per i trader che cercano informazioni precise e preziose per le loro strategie di trading. L'indicatore combina il rinomato Didi Index, creato da Odir Aguiar, con l'intellig
TimeChannel
Thalles Nascimento De Carvalho
The "Timechannel" is a powerful technical analysis tool designed specifically for traders who want to gain deeper and more accurate insights into price movements across multiple timeframes (multi-timeframe). This indicator is an essential addition to the toolbox of any serious trader seeking to make informed and data-driven trading decisions. Key Features: Advanced Multi-Timeframe Analysis : Timechannel allows traders to analyze price movements on different timeframes simultaneously. This is cr
Master OBV
Thalles Nascimento De Carvalho
MasterOBV: Domina le Tendenze di Mercato con Precisione! MasterOBV è un indicatore di analisi tecnica che combina volume , correlazione positiva e una Media Mobile (MA) per affinare l'identificazione delle tendenze sui mercati finanziari. Funzionalità Principali: Volume Intelligente: Analizza il volume delle transazioni per identificare cambiamenti significativi nella forza della tendenza. Correlazione Positiva: Include asset correlati per ottenere una visione più ampia e precisa, ra
VolaMetrics VSA
Thalles Nascimento De Carvalho
VolaMetrics VSA | Un Potente Alleato nell'Analisi Tecnica Il VolaMetrics VSA è un indicatore di analisi tecnica che combina il metodo Volume Spread Analysis (VSA) con un'analisi dettagliata del volume delle transazioni . Progettato per identificare e tracciare i movimenti significativi dei prezzi , il VolaMetrics VSA utilizza l'interazione tra volume e spread dei prezzi per fornire intuizioni preziose che possono aiutare nelle decisioni di trading. Fondamenti della Volume Spread Analysis (VSA
SwingVolumePro
Thalles Nascimento De Carvalho
Panoramica SwingVolumePro è un indicatore avanzato e versatile, progettato per essere utilizzato su una vasta gamma di strumenti finanziari e per supportare diversi stili di trading. Basato su un'analisi rigorosa di volume e prezzo, fornisce segnali chiari e precisi che consentono ai trader di tutti i livelli di prendere decisioni informate basate su dati di alta qualità. SwingVolumePro.PDF Caratteristiche principali Versatilità: SwingVolumePro può essere applicato a vari asset, tra
CVD SmoothFlow Pro
Thalles Nascimento De Carvalho
CVD SmoothFlow Pro - Analisi del Volume Illimitata per Qualsiasi Attivo! CVD SmoothFlow Pro è la soluzione definitiva per i trader che cercano un'analisi del volume precisa e illimitata. Utilizzando il calcolo del Cumulative Volume Delta (CVD) con filtraggio avanzato del rumore, la versione Pro offre la flessibilità e la precisione necessarie per operare su qualsiasi strumento finanziario. Cosa offre CVD SmoothFlow Pro? Analisi Chiara : Filtra il rumore di mercato e mette in risalto i movi
Cumulative Vol Bands
Thalles Nascimento De Carvalho
CVB Cumulative Volume Bands: Potenzia le tue operazioni con il volume accumulato! CVB Cumulative Volume Bands è un indicatore avanzato progettato per i trader che cercano segnali precisi basati sul volume accumulato. Utilizzando bande di volume accumulato, questo indicatore offre letture chiare delle pressioni di acquisto e vendita nel mercato, aiutando a identificare inversioni e forti movimenti dei prezzi. Caratteristiche principali: Analisi del Volume Accumulato : Rileva i punt
ZigWave Oscillator
Thalles Nascimento De Carvalho
ZigWave Oscillator: Potenzia le tue operazioni con oscillatori e ZigZag! Il ZigWave Oscillator è lo strumento perfetto per i trader che cercano precisione e chiarezza nell'analisi del mercato finanziario. Questo indicatore combina la forza degli oscillatori con la semplicità visiva dello ZigZag, aiutandoti a identificare le migliori opportunità di acquisto e vendita con rapidità ed efficienza. Perché scegliere il ZigWave Oscillator? Analisi precisa degli oscillatori : Integra RSI, Will
Mini Indice Composition
Thalles Nascimento De Carvalho
Mini Índice Composition: A Revolução na Análise do Mini Índice! O Mini Índice Composition é um indicador inovador que monitora em tempo real as principais ações que compõem o mini índice, trazendo uma visão quantitativa poderosa sobre o fluxo de ordens do mercado! Como Funciona? Diferente de outros indicadores que utilizam apenas dados históricos, o Mini Índice Composition faz uma leitura ao vivo das ordens que entram e saem das ações, pesando o impacto direto no mini índice. Com
Radar DI
Thalles Nascimento De Carvalho
Radar DI – Indicador de Taxa de Juros para Mini Índice e Mini Dólar com Exportação CSV e Integração IA Radar DI é um indicador especializado que transforma as variações da taxa de juros DI (Depósitos Interfinanceiros) em sinais operacionais estratégicos para os ativos mini índice (WIN) e mini dólar (WDO) . NOVA FUNCIONALIDADE: Exportação CSV + Integração com IA Agora o Radar DI permite exportar todos os dados em formato CSV , incluindo: Variações dos DIs Variação do Mini Índice (WIN)
LSTM Library
Thalles Nascimento De Carvalho
LSTM Library - Reti Neurali Avanzate per MetaTrader 5 Libreria Professionale di Reti Neurali per il Trading Algoritmico LSTM Library porta la potenza delle reti neurali ricorrenti alle tue strategie di trading in MQL5. Questa implementazione di livello professionale include reti LSTM, BiLSTM e GRU con funzionalità avanzate tipicamente disponibili solo in framework specializzati di machine learning. "Il segreto del successo nel Machine Learning per il trading risiede nel trattamento adeguato dei
Cvd Divergence
Thalles Nascimento De Carvalho
CVD Divergence – Analisi Professionale del Flusso Ordini e delle Divergenze CVD Divergence è un indicatore tecnico progettato per rilevare divergenze affidabili tra il prezzo e il Cumulative Delta Volume (CVD). Identifica con precisione i momenti in cui il flusso reale degli ordini non conferma il movimento del prezzo, rivelando possibili inversioni, esaurimento del momentum e manipolazioni istituzionali. L’indicatore combina la lettura del volume aggressivo con l’analisi strutturale del prezzo,
Filtro:
epadilha
734
epadilha 2024.10.31 14:46 
 

L'utente non ha lasciato alcun commento sulla valutazione.

Thalles Nascimento De Carvalho
8461
Risposta dello sviluppatore Thalles Nascimento De Carvalho 2024.10.31 15:01
Obrigado!🙏
Rispondi alla recensione