Gold Trend 5
- 지표
-
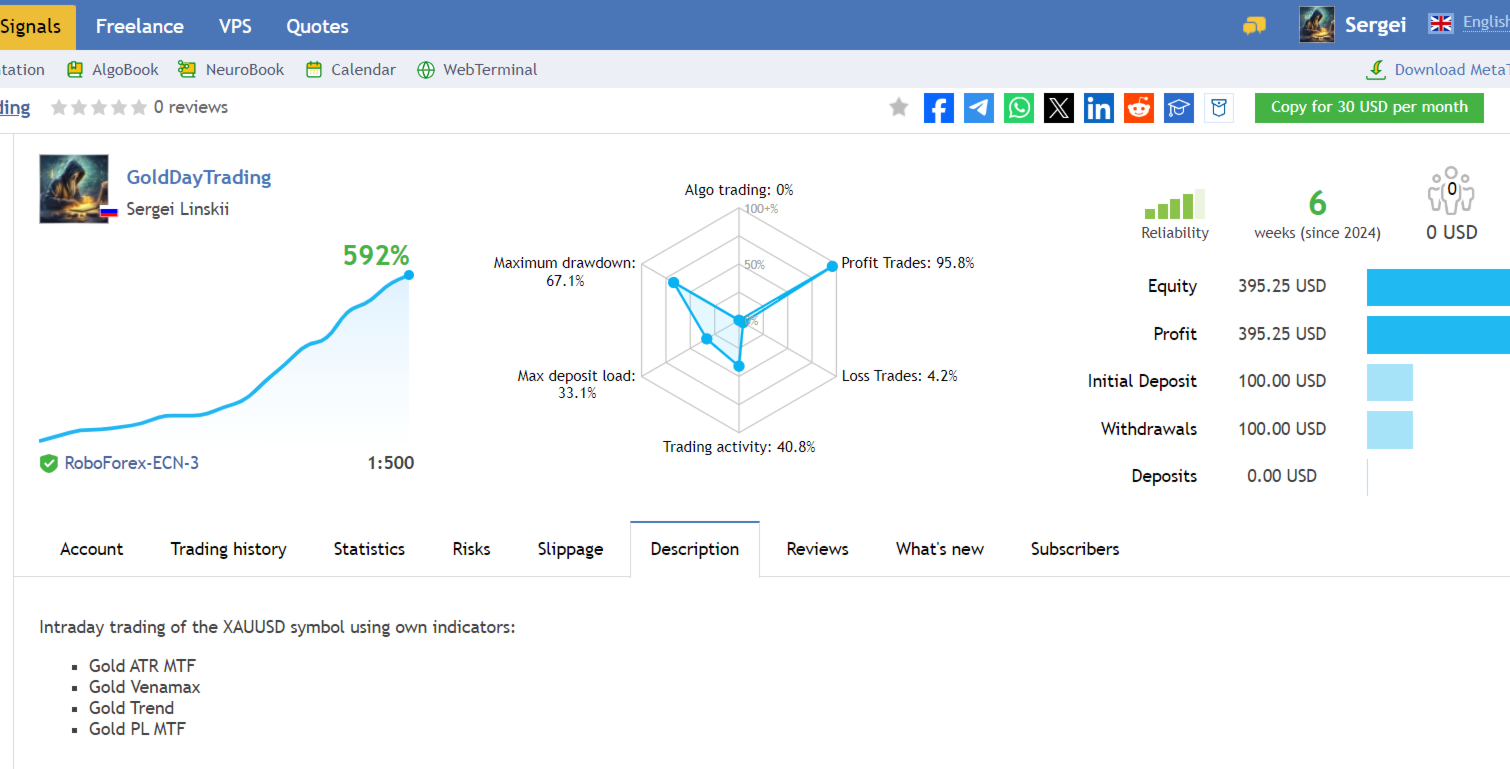
Sergei Linskii
 2010년부터 외환 거래 경험. 저는 수동 거래를 위한 거래 전략과 전문가 자문가의 자동 거래를 위한 알고리즘을 개발하는 활동적인 거래자이자 개발자입니다. 지금은 거래와 안정적인 수익에 가장 적합한 기호인 금만 수동으로 거래합니다.
💥 내 텔레그램 >>> https://t.me/venamax - 버전: 5.0
- 업데이트됨: 11 11월 2025
- 활성화: 5
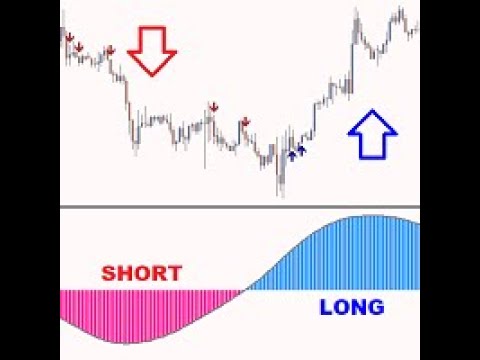
금 추세 - 좋은 주식 기술 지표입니다. 인디케이터 알고리즘은 자산의 가격 움직임을 분석하고 변동성과 잠재적 진입 구간을 반영합니다.
최고의 지표 신호:
- 매도 = 빨간색 히스토그램 + 빨간색 숏 포인터 + 같은 방향의 노란색 신호 화살표 + 빨간색 추세 방향 화살표.
- 매수 = 파란색 히스토그램 + 파란색 롱 포인터 + 같은 방향의 아쿠아 신호 화살표 + 파란색 추세 방향 화살표.
인디케이터의 장점
1. 표시기는 높은 정확도로 신호를 생성합니다.
2. 확인된 화살표 신호는 추세가 바뀔 때만 다시 그릴 수 있습니다.
3. 모든 브로커의 메타트레이더 5 거래 플랫폼에서 거래할 수 있습니다.
4. 모든 자산(통화, 금속, 암호화폐, 주식, 지수 등)을 거래할 수 있습니다.
5. M15-H1 차트주기(중기 트레이딩)에서 거래하는 것이 좋습니다.
6. 지표 설정에서 개별 매개 변수(TF, 색상 등)를 변경할 수 있으므로 각 트레이더가 지표를 쉽게 사용자 지정할 수 있습니다.
7. 이 보조지표는 독립적인 트레이딩 시스템뿐만 아니라 트레이딩 시스템의 주요 보조지표로 사용할 수 있습니다.
참고: 트레이딩의 진입 정확도와 수익성은 트레이더의 실력에 따라 달라집니다. 모든 보조지표는 트레이더를 위한 보조 도구일 뿐 행동 지침이 아닙니다. 황금률 - 추세에 따라 주문을 개시하고, 수익을 실현한 후 다음으로 좋은 신호가 나타날 때까지 기다리세요.
트레이딩에 행운과 안정적인 수익을 기원합니다!


Big Ups to the developer...the product is exactly as it is advertised. Every trend signal is clear, so far haven't lost a single trade within 8 days. Don't hesitate, just buy the product and see it for yourselves.