• 미리보기
  • 리뷰
  • 코멘트

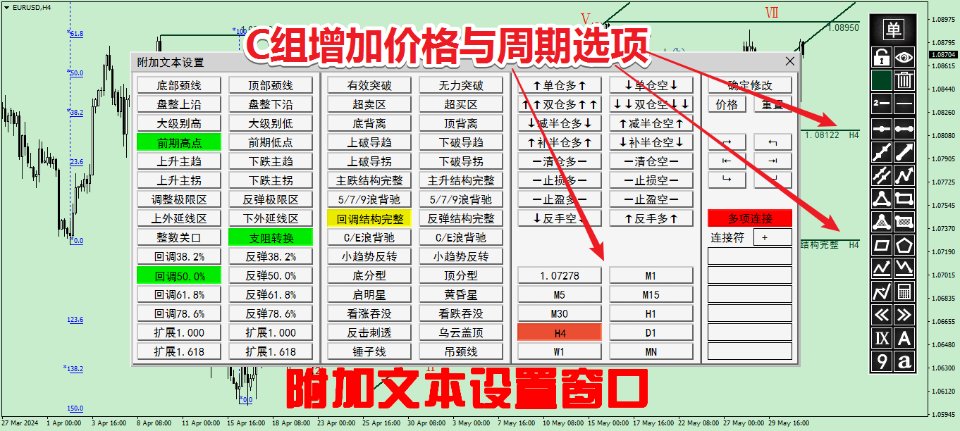
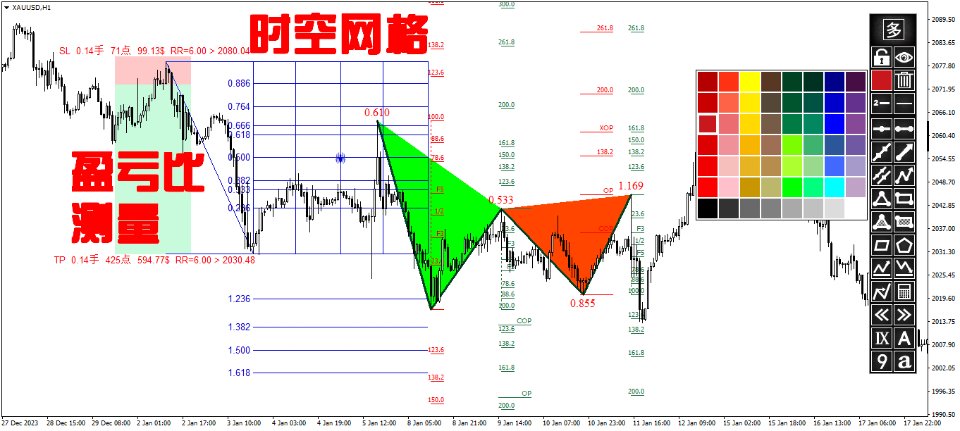
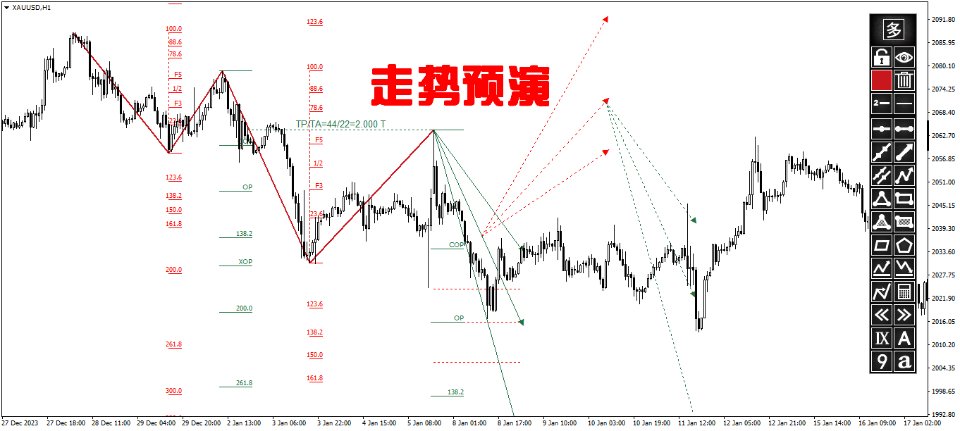
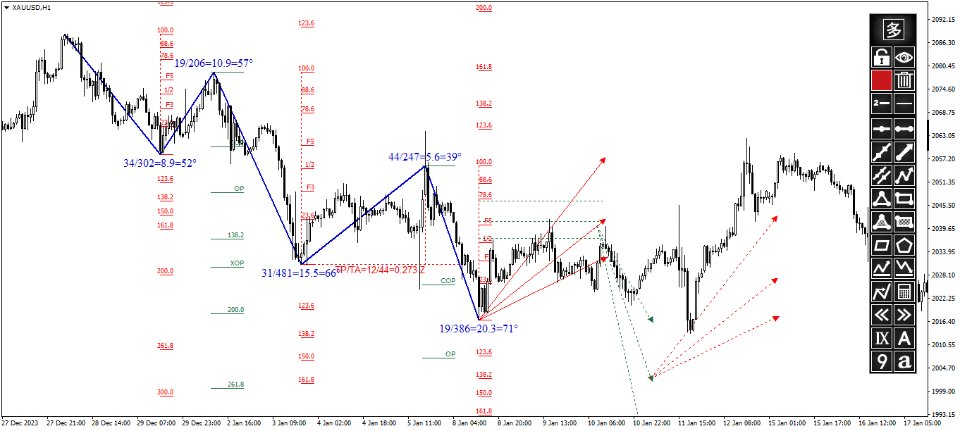
Quick Drawing Tool

About testing Mode

step1.Copy the settings below into txt and save as presets file such as   "QDT3.set"

step2.Copy the presets file into the "tester" folder which is located in the MT4 root directory

step3.Load the settings when testing the indicator

step4.Use the tick data to test and adjust the test speed to 30


InpDivideLine1=*******************************通用设置*******************************
InpTheme=2
InpSHIcon=0
InpShowSHIcon=true
InpShowOnRight=true
InpShowMainTabByClickAutoHide=true
InpHShiftIcon=15
InpVShiftIcon=15
InpHShift=15
InpVShift=15
InpShowMainTabByChartClick=true
InpShowMainTabClickR=30
InpShowMainTabClickY=0
InpTLine0AutoSearchHL=true
InpTLine2AutoSearchHL=false
InpChannelAutoSearchHL=true
InpTLineNArrAutoSearchHL=true
InpFiboAutoSearchHL=true
InpExpansionAutoSearchHL=true
InpAutoSearchHLOnPlaySound=true
InpHLineBack=true
InpTLineBack=true
InpTLineNArrBack=true
InpPolygonBack=true
InpChannelBack=true
InpChannelRayRight=true
InpChannelPointSize=10
InpShowLineInfo=true
InpDeleteOnCurTF=false
InpDeleteConfirm=true
InpShowOBJInfo=true
InpDivideLine2=*******************************图片设置*******************************
InpTipPicName=TipPic
InpHisPicOnlyLoadCurSymbol=true
InpTipPicLeft=-3
InpTipPicTop=-3
InpTipPicWidth=0
InpTipPicHeight=0
InpDivideLine3=*******************************盈亏比例*******************************
InpChangeOnlyOnSelected=true
InpRR1=1.0
InpRR2=2.0
InpRR3=3.0
InpRR4=4.0
InpRR5=5.0
InpRR6=0.0
InpRR7=0.0
InpRR8=0.0
InpRecSLColorB=150
InpRecTPColorB=1978880
InpRecSLColorW=13158655
InpRecTPColorW=14482120
InpFontName=Arial
InpFontSize=10
InpPLTextColor=255
InpDivideLine4=*******************************斐波那契*******************************
InpFiboLevelWaveFolder=FiboWav
InpABCMeasureMode=false
InpAdjustWaveFiboType=1
InpFiboSearchHLPix=15
InpFiboRateStr=-3.236,-2.236,-2,-1.618,-1,-0.618,-0.5,-0.382,-0.236,0,0.236,0.382,0.5,0.618,0.786,1,1.382,1.618,2,2.618,3,3.236,4.236
InpAlertFiboRateStr=0,0.382,0.5,0.618,1,1.382,1.618,2,2.618,3,-0.382,-0.618,-1,-1.618,-2
InpDistinguishFiboLevelWave=true
InpFiboDesStrRight=
InpFiboShowLevelPrice=false
InpFiboBack=true
InpFiboRayRight=false
InpFiboColorB=65535
InpFiboLevelColorB=65535
InpFiboColorW=16711680
InpFiboLevelColorW=16711680
InpFiboLevelWidth=1
InpFiboLevelStyle=0
InpExpansionRateStr=0,0.618,1,1.382,1.618,2,2.618,3
InpAlertExpansionRateStr=0.618,1,1.618,2
InpExpansionDesStrRight=
InpDistinguishExpansionLevelWave=true
InpExpansionShowLevelPrice=false
InpExpansionBack=true
InpExpansionRayRight=false
InpExpansionColorB=65535
InpExpansionLevelColorB=65535
InpExpansionColorW=16711680
InpExpansionLevelColorW=16711680
InpExpansionLevelWidth=1
InpExpansionLevelStyle=0
InpDivideLine5=*******************************带长度信息连续线段*******************************
InpTLineNWithLengthColor=255
InpTLineNWithLengthWidth=2
InpTLineNWithLengthStyle=0
InpTLineNWithLengthTxtColor=255
InpTLineNWithLengthTxtFont=Times New Roman
InpTLineNWithLengthTxtFontsize=12
InpTLineNWithLengthAphla=0.1
InpTLineNWithLengthTxtVShift=0
InpDivideLine6=*******************************区间跨度*******************************
InpOnBack=true
InpQJT_dn=5
InpQJT_up=120
InpR0=1
InpR1=20
InpNoneQJTLineLength=40
InpQJTLockHRang=15
InpWaveBtnFontsize=15
InpFont=1
InpQJTFontsize=15
InpQJTWidth=1
InpQJTColorB=16777215
InpQJTColorW=16711680
InpDivideLine7=*******************************波浪标记*******************************
InpMarkSeriesA=Ⅰ,Ⅱ,Ⅲ,Ⅳ,Ⅴ,Ⅵ,Ⅶ,Ⅷ,Ⅸ
InpMarkSeriesB=A,B,C,D,E
InpMarkSeriesC=⑴,⑵,⑶,⑷,⑸,⑹,⑺,⑻,⑼
InpMarkSeriesD=(a),(b),(c),(d),(e)
InpWMAnchor=8
InpFontA=Times New Roman
InpFontsizeA=15
InpFontColorA=255
InpFontB=Times New Roman
InpFontsizeB=15
InpFontColorB=14772545
InpFontC=黑体
InpFontsizeC=12
InpFontColorC=180
InpFontD=Times New Roman
InpFontsizeD=12
InpFontColorD=10114859
InpDivideLine7exp0=Wingdings 2
InpDivideLine7exp1=j,k,l,m,n,o,p,q,r
InpDivideLine7exp2=u,v,w,x,y,z,{,|,}
InpDivideLine8=*******************************波浪标记和区间跨度显示周期*******************************
InpShowOnMode=0
InpAppliedM1=false
InpAppliedM5=true
InpAppliedM15=true
InpAppliedM30=true
InpAppliedH1=true
InpAppliedH4=false
InpAppliedD1=false
InpAppliedW1=false
InpAppliedMN1=false
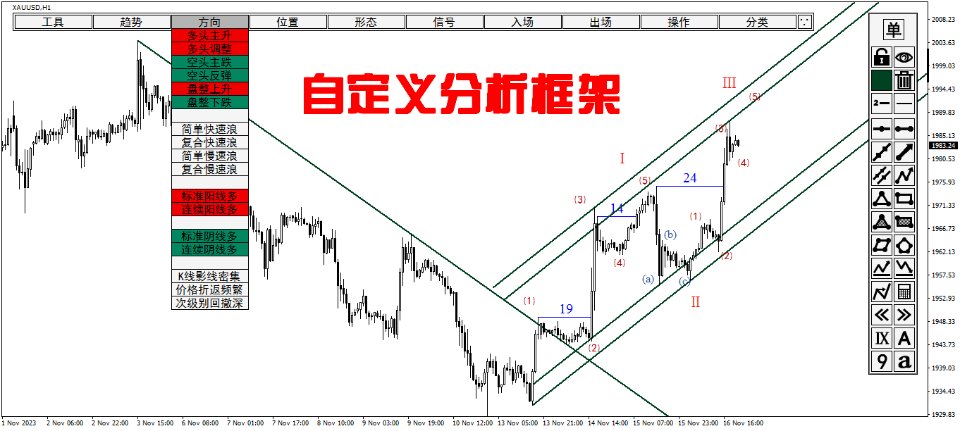
InpDivideLine9=*******************************自定义分析框架*******************************
InpUserFrame=1
InpShowMarkETabByClickOBJName=
InpShowMarkETabByChartClick=true
InpShowMarkETabClickR=30
InpShowMarkETabClickY=0
InpMarkSeriesESpaceString=-
InpMarkSeriesEHead1=工具|趋势|方向|位置|
InpMarkSeriesEHead1SubHead1=道氏理论|波浪理论|箱体理论|通道指标|回撤范围|均线分析|形态分析|趋势线分析:
InpMarkSeriesEHead1Sub1=道氏理论|波浪理论|箱体理论|通道指标|回撤范围|均线分析|形态分析|趋势线分析:
InpMarkSeriesEHead1SubHead2=上升趋势|下跌趋势|横盘震荡|趋势初期|趋势中期|趋势末期||快升慢调|慢升快调|浅调上升|中调上升|深调上升||快跌慢调|慢跌快调|浅调下跌|中调下跌|深调下跌||标准震荡|非标震荡:
InpMarkSeriesEHead1Sub2=上升趋势|下跌趋势|横盘震荡|趋势初期|趋势中期|趋势末期||快升慢调|慢升快调|浅调上升|中调上升|深调上升||快跌慢调|慢跌快调|浅调下跌|中调下跌|深调下跌||标准震荡|非标震荡:
InpMarkSeriesEHead1SubHead3=多头主升|多头调整|空头主跌|空头反弹|盘整上升|盘整下跌||简单快速浪|复合快速浪|简单慢速浪|复合慢速浪||标准阳线多|连续阳线多||标准阴线多|连续阴线多||K线影线密集|价格折返频繁|次级别回撤深:
InpMarkSeriesEHead1Sub3=多头主升|多头调整|空头主跌|空头反弹|盘整上升|盘整下跌||简单快速浪|复合快速浪|简单慢速浪|复合慢速浪||标准阳线多|连续阳线多||标准阴线多|连续阴线多||K线影线密集|价格折返频繁|次级别回撤深:
InpMarkSeriesEHead1SubHead4=前期高点|前期低点|调整极限|反弹极限|盘整上沿|盘整下沿|通道上沿|通道下沿|均线支撑|均线阻力|形态边界|顶部颈线|底部颈线|整数关口|趋势线支撑|趋势线压力|黄金分割62%|黄金分割50%|黄金分割40%:
InpMarkSeriesEHead1Sub4=前期高点|前期低点|调整极限|反弹极限|盘整上沿|盘整下沿|通道上沿|通道下沿|均线支撑|均线阻力|形态边界|顶部颈线|底部颈线|整数关口|趋势线支撑|趋势线压力|黄金分割62%|黄金分割50%|黄金分割40%:
InpMarkSeriesEHead2=形态|信号|入场|出场|
InpMarkSeriesEHead2SubHead1=A字顶|双顶|头肩顶|三重顶|箱型顶|圆弧顶||V字底|双底|头肩底|三重底|箱型底|圆弧底||简单型|锯齿型|平台型|abcde型|楔形|旗形|钻石|顺势平台型|上升三角形|下降三角形|收缩三角形|扩张三角形:
InpMarkSeriesEHead2Sub1=A字顶|双顶|头肩顶|三重顶|箱型顶|圆弧顶||V字底|双底|头肩底|三重底|箱型底|圆弧底||简单型|锯齿型|平台型|abcde型|楔形|旗形|钻石|顺势平台型|上升三角形|下降三角形|收缩三角形|扩张三角形:
InpMarkSeriesEHead2SubHead2=底分型|标准阳线|早晨之星|看涨吞没|反击刺透|红三兵|锤子线|顶分型|标准阴线|黄昏之星|看跌吞没|乌云盖顶|绿三兵|吊颈线|十字星|孕线:
InpMarkSeriesEHead2Sub2=底分型|标准阳线|早晨之星|看涨吞没|反击刺透|红三兵|锤子线|顶分型|标准阴线|黄昏之星|看跌吞没|乌云盖顶|绿三兵|吊颈线|十字星|孕线:
InpMarkSeriesEHead2SubHead3=回调多|测趋多|测拐多|突破多|破趋多|破拐多|区间多|超卖多|破颈线多|破形态多|一买多|二买多|三买多||反弹空|测趋空|测拐空|突破空|破趋空|破拐空|区间空|超买空|破颈线空|破形态空|一卖空|二卖空|三卖空:
InpMarkSeriesEHead2Sub3=回调多|测趋多|测拐多|突破多|破趋多|破拐多|区间多|超卖多|破颈线多|破形态边界多|一买多|二买多|三买多||反弹空|测趋空|测拐空|突破空|破趋空|破拐空|区间空|超买空|破颈线空|破形态边界空|一卖空|二卖空|三卖空:
InpMarkSeriesEHead2SubHead4=主动止损|分批止损|点位止盈|点数止盈|盈亏比止盈|分批止盈|1倍减半仓|点数移损|条件移损|条件平保|条件保盈|道氏跟踪|通道跟踪|趋势线跟踪|均线跟踪|布林跟踪|海龟跟踪|指标反向:
InpMarkSeriesEHead2Sub4=主动止损|分批止损|点位止盈|点数止盈|盈亏比止盈|分批止盈|1倍减半仓|点数移损|条件移损|条件平保|条件保盈|道氏跟踪|通道跟踪|趋势线跟踪|均线跟踪|布林跟踪|海龟跟踪|指标反向:
InpMarkSeriesEHead3=操作|分类
InpMarkSeriesEHead3SubHead1=建单仓多|建双仓多|减半仓多|补半仓多|清仓多|反手空||建单仓空|建双仓空|减半仓空|补半仓空|清仓空|反手多:
InpMarkSeriesEHead3Sub1=↑建单仓多|↑↑建双仓多|↓减半仓多|↑补半仓多|清仓多|↓↓反手空||↓建单仓空|↓↓建双仓空|↑减半仓空|↓补半仓空|清仓空|↑↑反手多:
InpMarkSeriesEHead3SubHead2=× 排除可能|概率 ★★★|概率 ★★☆|概率 ★☆☆||位置A|位置B|位置C|位置D|位置E|位置F|位置G|位置H|位置I|位置J|位置K||[情形1]|[情形2]|[情形3]|[情形4]|[情形5]|[情形6]|[情形7]|[情形8]|[情形9]
InpMarkSeriesEHead3Sub2=× 排除可能|概率 ★★★|概率 ★★☆|概率 ★☆☆||位置A||位置B|位置C|位置D|位置E|位置F|位置G|位置H|位置I|位置J|位置K||[情形1]|[情形2]|[情形3]|[情形4]|[情形5]|[情形6]|[情形7]|[情形8]|[情形9]
InpMarkSeriesEHead3SubHead3=
InpMarkSeriesEHead3Sub3=
InpMarkSeriesEHead3SubHead4=
InpMarkSeriesEHead3Sub4=
InpMarkETabLeft=15
InpMarkETabTop=15
InpMarkEBtnWidth=110
InpMarkEBtnHeight=20
InpMarkEBtnAlign=2
InpFontE=黑体
InpFontsizeE=12
InpFontsizeEHead=12
InpBackColorEHeadB=4934475
InpBackColorEHeadW=11842740
TheFontColorEBaseB=16777215
TheFontColorEBaseW=0
InpFontColorE1B=255
InpFontColorE2B=65280
InpFontColorE3B=8421504
InpFontColorE1W=255
InpFontColorE2W=6326018
InpFontColorE3W=8421504
InpKeyWords1=上升|阳线|多头|快升|慢升|★★★|底分型|标准阳线|早晨之星|看涨吞没|反击刺透|红三兵|锤子线
InpKeyWords1r=上升三角形
InpKeyWords2=下跌|阴线|空头|快跌|慢跌|★☆☆|顶分型|标准阴线|黄昏之星|看跌吞没|乌云盖顶|绿三兵|吊颈线
InpKeyWords2r=下降三角形
InpKeyWords3=位置|情形
InpKeyWords3r=
InpBackColorE1B=180
InpBackColorE2B=1978880
InpBackColorE1W=240
InpBackColorE2W=6326018
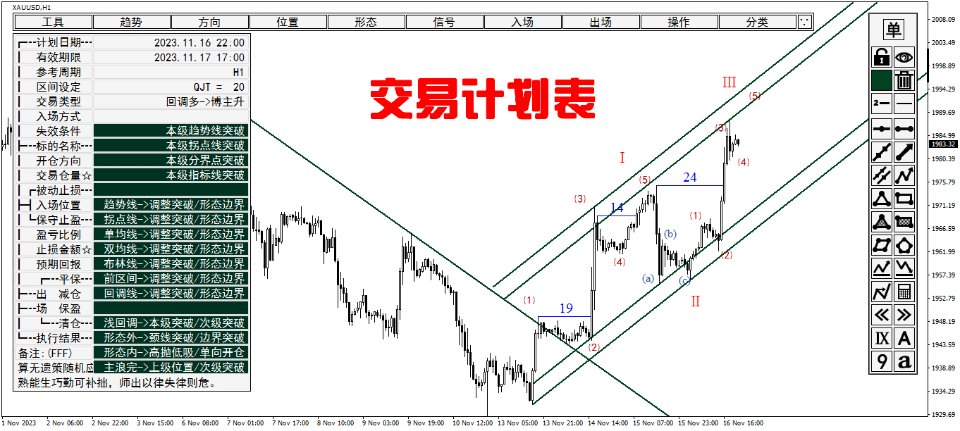
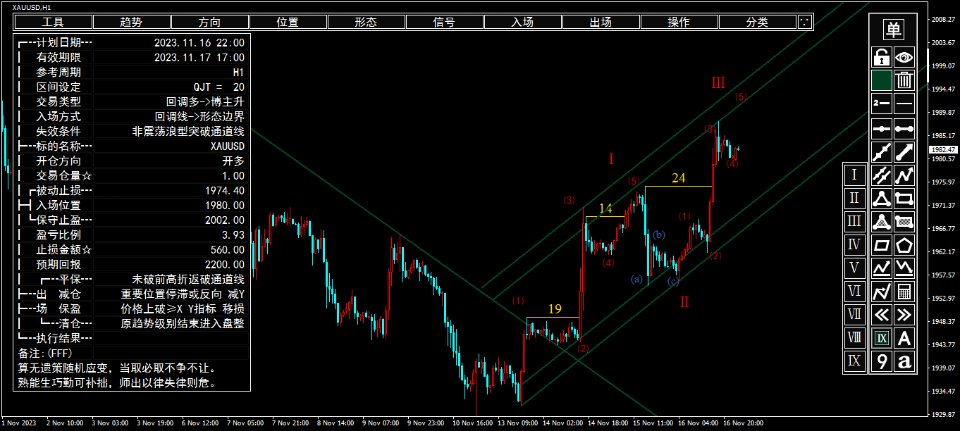
InpDivideLine10=*******************************交易计划表*******************************
InpSHPTSheetByClickOBJName=
InpClilckRightPBarSHPTSheet=true
InpRightPBarSHPTSheetRate1=0.9
InpRightPBarSHPTSheetRate2=1.0
InpTradePlanSheetSpaceString=-
InpTradePlanSheet_TF=M1|M5|M15|M30|H1|H4|D1|W1|MN1|M5 + M1|M15 + M5|H1 + M15|H4 + H1|D1 + H4|W1 + D1|M15 + M5 + M1|H1 + M15 + M5|H4 + H1 + M15|D1 + H4 + H1|W1 + D1 + H4
InpTradePlanSheet_QJT=QJT =   5|QJT =  10|QJT =  20|QJT =  30|QJT =  40|QJT =  50|QJT =  60|QJT =  70|QJT =  80|QJT =  90|QJT = 100|QJT = 120|QJT = 150
InpTradePlanSheet_TradeTypeA=回调多->博主升|突破多->博主升|回调多->博反转|突破多->博反转|超卖多->博反转|多反弹->博反转|区间多->做震荡|-|
InpTradePlanSheet_TradeTypeB=反弹空->博主跌|突破空->博主跌|反弹空->博反转|突破空->博反转|超买空->博反转|空回调->博反转|区间空->做震荡
InpTradePlanSheet_EntryModeA=本级趋势线突破|本级拐点线突破|本级分界点突破|本级指标线突破|-|
InpTradePlanSheet_EntryModeB=趋势线->调整突破/形态边界|拐点线->调整突破/形态边界|单均线->调整突破/形态边界|双均线->调整突破/形态边界|布林线->调整突破/形态边界|前区间->调整突破/形态边界|回调线->调整突破/形态边界|-|
InpTradePlanSheet_EntryModeC=浅回调->本级突破/次级突破|形态外->颈线突破/边界突破|形态内->高抛低吸/单向开仓|主浪完->上级位置/次级突破
InpTradePlanSheet_FailureCondition=
InpTradePlanSheet_OpenDirection=开多|开空|加多|加空|-|平多|平空|减多|减空|-|平多 && 开空|平空 && 开多
InpTradePlanSheet_BreakEvenA=盈利点数 ≥ X|盈利金额 ≥ X|价格上破 ≥ X|价格下破 ≤ X|盈亏比达 ≥ X|
InpTradePlanSheet_BreakEvenB=走势主浪特征不明显|未破前高出现反向标K|未破前低出现反向标K|未破前高折返破趋势线|未破前低折返破趋势线|
InpTradePlanSheet_BreakEvenC=未破前高折返破通道线|未破前低折返破通道线|突破幅度小于0.382折返|未达到主浪幅度就折返|入场位在右肩附近不启用
InpTradePlanSheet_PositionReduceA=盈利点数 ≥ X 减Y|盈利金额 ≥ X 减Y|价格上破 ≥ X 减Y|价格下破 ≤ X 减Y|盈亏比达 ≥ X 减Y|
InpTradePlanSheet_PositionReduceB=重要位置停滞或反向 减Y|外延三点停滞或反向 减Y|复合主浪级别被破坏 减Y|小级别背驰引发停滞 减Y|快升浪幅度达标后停滞 减Y|快跌浪幅度达标后停滞 减Y|
InpTradePlanSheet_PositionReduceC=快升浪加速后迅速回撤 减Y|快跌浪加速后迅速反弹 减Y|同级别突破幅度达0.9倍 减Y|主浪幅度0.9倍后破导拐 减Y|5以下区间破10EMA 减Y|10左右区间破20EMA 减Y|突破15期唐奇安通道 减Y
InpTradePlanSheet_ProfitProtectionA=盈利点数≥X 移损Y|盈利金额≥X 移损Y|价格上破≥X 移损Y|价格下破≤X 移损Y|盈亏比达≥X 移损Y|
InpTradePlanSheet_ProfitProtectionB=盈利点数≥X 保盈Y|盈利金额≥X 保盈Y|价格上破≥X 保盈Y|价格下破≤X 保盈Y|盈亏比达≥X 保盈Y|
InpTradePlanSheet_ProfitProtectionC=盈利点数≥X Y指标 移损|盈利金额≥X Y指标 移损|价格上破≥X Y指标 移损|价格下破≤X Y指标 移损|盈亏比达≥X Y指标 移损
InpTradePlanSheet_CloseAllA=盈利点数 ≥ X|盈利金额 ≥ X|价格上破 ≥ X|价格下破 ≤ X|盈亏比达 ≥ X|
InpTradePlanSheet_CloseAllB=突破分界点趋势逆转|突破通道线趋势逆转|突破趋势线趋势逆转|原趋势级别结束进入盘整|突破导航分界点主浪结束|突破导航通道线主浪结束|突破导航趋势线主浪结束|
InpTradePlanSheet_CloseAllC=向下突破30期唐奇安通道|向上突破30期唐奇安通道|调整周期足够后不创新高折返|调整周期足够后不创新低折返
InpTradePlanSheet_ExecutionResult=止损|止盈|中断|扫平保|扫移损|扫保盈|减仓后扫移损|减仓后扫保盈
InpDivideLine11=*******************************价格观测区*******************************
InpClilckRightPBarDrawPRng=true
InpRightPBarDrawPRngAutoChangeTF=true
InpChangeTFByClickRngInfo=true
InpRightPBarDrawPRngRate1=0.0
InpRightPBarDrawPRngRate2=0.1
InpRecColorB=2631720
InpRecColorW=11119017
InpDivideLine12=*******************************报警设置*******************************
InpAlertR0=100.0
InpAlertTotalLen=60
InpAlertWavLen=18
InpAlertWav=关键位置.wav
InpAlertWavFB=斐波回调.wav
InpAlertWavEP=斐波扩展.wav
InpAlertWavShortName1=趋势
InpAlertWav1=趋势线.wav
InpAlertWavShortName2=通道
InpAlertWav2=通道线.wav
InpAlertWavShortName3=分A
InpAlertWav3=分界点A.wav
InpAlertWavShortName4=前高
InpAlertWav4=前高.wav
InpAlertWavShortName5=前低
InpAlertWav5=前低.wav
InpAlertWavShortName6=颈线
InpAlertWav6=颈线.wav
InpPlanTradeAlertOnOff=true
InpAlertWavOP=计划开仓价.wav
InpAlertWavSL=计划止损价.wav
InpAlertWavTP=计划止盈价.wav
InpAlertDefaultPlaySound=true
InpAlertDefaultAlert=true
InpAlertDefaultNotification=false
InpAlertDefaultEMail=false
InpAlertDefaultContinuously=false
InpAlertDefaultTF=15
InpClickPriceAxisSHProperty=false
InpClickPriceAxisRate1=0.75
InpClickPriceAxisRate2=0.85
InpDivideLine13=*******************************快捷键设置*******************************
InpKeyScrShootSetting=74
InpKeySaveChartPic=79
InpChartPicWithDate=true
InpKeyShowHideTipPic=85
InpKeyShowHideHisPic=89
InpKeyTipPicOnBack=66
InpKeyChangeChartColorRev=188
InpShowCurPriceLine=false
InpKeyShowRecInfo=73
InpKeyStopPlaySound=192
InpKeyMainTabShowHide=81
InpKeyShowHideMarkETab=87
InpKeyChangeMarkETabPosition=0
InpKeySetOBJStyle=0
InpKeyShowPlanSheet=84
InpKeyShowPlanTradeLines=76
InpKeyKbarShowHide=75
InpKeyShowHideAlertLines=77
InpShowHideAlertLinesChangeSelect=false
InpIncreaseWidthShowAlertLines=0
InpShowHideAlertLinesDotSize=7
InpShowHideAlertLinesKbarSpace=2
InpKeyOBJDelete=68
InpKeyOBJShowHide=72
InpKeyOBJLock=83
InpKeyTrendHLock=67
InpKeyOBJDeleteByClick=17
InpOBJDeleteByClickOnlyDTCreated=false
InpKeyDeleteWaveMark=0
InpBackspaceKey=90
InpApplyTFChange=true
InpLastTFKey=90
InpNextTFKey=88
InpSkipM30=true
InpTFFontName=Impact
InpTFFontSize=180
InpTFFontColor=2175488
InpApplyMainTFChange=true
InpMainTFKey=9
InpMainTF1=1440
InpMainTF2=60
InpKeyChartShiftSize=65
InpShiftValue=15
InpKeyCopyTLine=86
InpKeyHReverseTLine=78
InpKeyHReverseTLine1=50
InpKeyHReverseTLine2=51
InpKeyChangeColor2RedGreen=71
InpKeyChangeColor2RedBlue=82
InpKeyVerticalMove=190
InpKeyQJT=0
InpKeyFibo=70
InpKeyExpansion=69
InpKeyHLine=0
InpKeyTLine2=0
InpKeyTLine=0
InpKeyTLineArr=0
InpKeyChannel=0
InpKeyTLineNArr=0
InpKeyTriangle=0
InpKeyRectangle=0
InpKeyTrianglefill=0
InpKeyRectanglefill=0
InpKeyRectangle2=0
InpKeyPolygon=0
InpKeyBuyPL=0
InpKeySellPL=0
InpVersionDT=1702944000
InpDivideLine14=************************************************************************


추천 제품
Dark Sniper
Dmitriy Kashevich
Dark Sniper arrow indicator. complete lack of redrawing percentage of correct indicator predictions from 80 85% The arrow indicates the direction of the next candle and the possible direction of the trend in the future.  suitable for small m1 timeframes. It is recommended to open deals from 1 to 2 candles. The signal appears on the last candle advantages of the indicator: 1. leading signals. 2.complete lack of redrawing 3. high signal accuracy.
Night ghost
Dmitriy Kashevich
Night Ghost - Arrow indicator for binary options. This is a reliable assistant to you in the future! - No redrawing on the chart -Works great on EUR/USD currency pairs! -Indicator accuracy up to 90% (Especially at night) -No long setup required (Perfectly set up for Binary Options) - Not late signals - The appearance of a signal on the current candle -Perfect for M1 period (No More!) - Eye-friendly candle color (Red and Blue) -Installed Alert Working with it: - Blue arrow
DMAX pro
Danny Teoh Kok Keong
DMAX SIGNAL IS VERY POWERFUL TOOL TO HELP YOU ENTRY,ITS CAN DETECT OVERSOLD AND OVERBOUGHT IN FOREX MARKET. ITS CAN TRADE 24 FOREX PAIR IN MARKET, 80% ACCURATE RESULT. MANY TRADER FAIL BECAUSE OF ENTRY POINT AND EXIT POINT , SIGNAL OF DMAX WILL GIVE VERY GOOD SIGNAL TO LET YOU KNOW WHERE TO ENTRY AND EXIT.  RISK MANAGEMENT IS VERY IMPORTANT IN TRADING FOREX, PLEASE DONT RISK OVER 5% PER TRADE IS FORE MARKET
PRO Renko System
Oleg Rodin
5 (25)
PRO Renko System 은 RENKO 차트 거래를 위해 특별히 고안된 매우 정확한 거래 시스템입니다. 이것은 다양한 거래 상품에 적용될 수있는 보편적 인 시스템입니다. 체계는 효과적으로 당신에게 정확한 반전 신호에 접근을 주는 소위 시장 소음을 중화합니다. 이 표시기는 사용하기가 매우 쉽고 신호 생성을 담당하는 매개 변수가 하나만 있습니다. 당신은 쉽게 당신의 선택의 어떤 무역 계기에 공구를 적응시킬 수 있고 renko 막대기의 크기. 나는 항상 당신이 내 소프트웨어로 수익성있게 거래 할 수 있도록 추가 지원을 제공 할 준비가되어 있습니다! 나는 당신에게 행복하고 수익성있는 거래를 기원합니다! 구매 후 저에게 연락하십시오! 내 렌코 차트 생성기를 보내드립니다. 또한 내 개인 권장 사항 및 시스템의 다른 모듈을 무료로 공유 할 것입니다!
Trend Flasher
Amarnath K M
Trend Flasher Trend is your friend is the age old saying quote in trading arena, there are though many ways to gauge the trend and its direction, more scientific measure and logically meaningful will be an ATR break outs to identify and spot the trend and its acceleration, so we created this easy to use trend identification panel and optimized super trend based multi time frame panel entry system to aid and help the traders to make their trading decision. Unique Features of Trend Flasher 1
Signal From Level
Yaroslav Varankin
Binary Options Support Resistance Indicator This indicator is designed for binary options trading and effectively shows retracements from support and resistance levels. Signals appear on the current candle. A red arrow pointing downwards indicates a potential selling opportunity, while a blue arrow pointing upwards suggests buying opportunities. All that needs adjustment is the color of the signal arrows. It is recommended to use it on the M1-M5 timeframes as signals are frequent on these timef
Black series MT4
Dmitriy Kashevich
1 (1)
Black series MT4 - The indicator is designed for trading on binary options with Timeframe M1-M5-M15 Multicurrency (Works on cryptocurrency and currency pairs) The signal appears when the candle opens Up to 90% correct signals There is no signal redrawing at all Can be used with other indicators. Good for scalping! In Settings there is: -Indicator working methods -I Allert Arrow color Red signal down Blue signal up Also watch the video how the indicator works and signals
Cosmic Diviner X Planet
Olena Kondratenko
4 (2)
This unique multi-currency strategy simultaneously determines the strength of trends and market entry points, visualizing this using histograms on the chart. The indicator is optimally adapted for trading on the timeframes М5, М15, М30, Н1. For the convenience of users, the indicator renders the entry point (in the form of an arrow), recommended take profit levels (TP1, TP2 with text labels) and the recommended Stop Loss level. The take profit levels (TP1, TP2) are automatically calculated for
ReboltP
David Theodore Caro-greene
Rebalance Overlay Technology (Rebolt) enables the trader to visualize the flow of money from one chart to another chart. Rebolt Probability indicates the probability that money has flowed from one chart to another chart for a specified length of time over a number of intervals specified by the user. When Rebolt reads Cyan or Blue these are buying signs good for the length of time specified by the user or until a conflicting signal arises. When Rebolt reads Violet or Red there are selling signs
The Serpent Rider Binary Options
Ellan Dirgantara Tholkhah
Embark on the pinnacle of Binary Options evolution. Our indicator isn't just adaptive—it's relentless. Picture a ninja riding a serpent, shadowing its every move; that's how this tool trails the market trend, unwavering till the end. Built upon the foundational prowess of the Ichimoku indicator and honed with an array of fine-tuned oscillators, it epitomizes accuracy and precision. Dive deep without getting lost in the Ichimoku's intricacies—our indicator simplifies the process for you. Perhaps
Renko, Heiken Ashi, Ticks Bar, Range Bar.    Easy switching, easy setup, all in one window.        Place the Custom Chart indicator and view Renko, Heiken Ashi, Tick bar, Range bar charts in real time at real chart.    Position the offline chart window so that the indicator control panel is visible.    Switch the chart mode by click of a button.    Connect to the output chart any indicator, expert advisor without any restrictions.    No, it doesn't work in the tester.    Yes, you can use an
BBMA Strategy
Sergei Gromov
The indicator for determining key patterns for the BBMA strategy will perfectly complement the Fibo Musang strategy, and can also be used as an independent tool. IMPORTANT! Contact me immediately after purchase to receive the second file! If you have any questions, I will help you deal with the indicator. Designed to save market analysis time; Sends push notifications to the phone when key moments of the strategy have arisen (Extrem A, Csak, cross the BB line with a candle) Advantages Easy to u
Strong Retracement Points Pro demo edition! SRP (Strong Retracement/Reversal Points) is a powerful and unique support and resistance indicator. It displays the closest important levels which we expect the price retracement/reversal! If all level are broken from one side, it recalculates and draws new support and resistance levels, so the levels might be valid for several days depending on the market! If you are still hesitating to start using this wonderful tool, you can check this link to see h
Market Secret
Ramzi Abuwarda
세계적인 바이너리 옵션 거래에서는 정확한 시장 분석과 전략적인 의사 결정이 핵심입니다. 수익성 있는 기회를 찾아내는 뛰어난 거래 지표를 찾는 여정은 끝이 없습니다. 비밀 지표(Secret Indicator)가 등장합니다 - 최고이며 강력한 MT4 바이너리 옵션 거래 도구로서의 명성을 얻은 주목할 만한 도구입니다. 비밀 지표는 경험있는 트레이더와 전문 프로그래머들로 구성된 팀에 의해 수년간의 세심한 연구, 개발 및 테스트를 통해 만들어졌습니다. 독특한 알고리즘과 고급 수학적 모델은 바이너리 옵션의 빠른 속도로 변동하는 세계에서 트레이더에게 무적의 이점을 제공하기 위해 정교하게 조정되었습니다. 비밀 지표를 다른 거래 지표와 구분 짓는 특징은 놀라운 정확도로 수익성 있는 거래 기회를 발견하는 능력입니다. 이 신호는 강력한 기술적 지표, 가격 행동 분석 및 시장 감성 평가의 조합에서 유도됩니다. 이 다각적 접근법은 비밀 지표가 단기 변동과 장기 추세 모두를 포착하여 트레이더에게 시
Fnix l long position
Monique Ellen Miranda Dos Santos
지금 한국어로 번역하겠습니다: 금융 시장에서 장기 기회를 찾고 계신 투자자이신가요? 여러분에게 커스텀 장기 트렌드 인디케이터를 소개합니다. 이 인디케이터는 일일, 주간 및 월간 차트보다 긴 시간대에서 포지션을 거래하려는 트레이더를 위해 디자인되었습니다. 명확하고 정확한 신호로, 여러분은 정보에 기반한 결정을 내릴 수 있을 것입니다. 주요 기능: 장기 전략: 이 인디케이터는 장기 거래에 헌신된 투자자에게 완벽합니다. 추천 시간대: 최상의 결과를 얻기 위해 이 인디케이터를 일간보다 긴 시간대에서 사용하는 것을 추천합니다. 정확한 신호: 인디케이터에서 생성된 신호와 캔들스틱 종가를 기다려, 신중한 결정을 내리십시오. 대기 주문: 최적의 사용을 위해 바이 스톱 또는 셀 스톱과 같은 대기 주문을 사용하는 것을 고려하십시오. 적절한 로트 크기: 작은 잔고를 가진 계정은 효과적인 리스크 관리를 위해 0.01의 로트 크기를 사용할 수 있습니다. 추천 통화 쌍: 이 인디케이터에 적합한 통화 쌍으로는
Currency Weight FX ( CW8) You are going to see the Forex Treasure If you think in Forex Trading you are dealing with one chart only, then you are on your way to be plunged into misery. The weight of one's currency will affect other currency or currencies. This Currency Weight FX is a breakthrough in trading tools With Currency Weight FX   ( CW8 ) indicator you will see each weight of major currency. This currency WEIGHT is very much different from currency STRENGTH most people usually mean.
Forex scalping indicator that does not redraw its arrows. It works best on M5, M15, M30, H1 timeframes. The default settings are for M5 timeframe. The picture below shows an example of working on the H1 chart with the "period=0.35" parameter value. You can download the demo version and test it yourself. Now we use the signals of this indicator in almost all of our scalping strategies. According to our calculations, the accuracy of its signals is about 95% depending on the timeframe. The indicato
Blahtech Market Profile
Blahtech Limited
4.61 (18)
Was: $249  Now: $99   Market Profile defines a number of day types that can help the trader to determine market behaviour. A key feature is the Value Area, representing the range of price action where 70% of trading took place. Understanding the Value Area can give traders valuable insight into market direction and establish the higher odds trade. It is an excellent addition to any system you may be using. Blahtech Limited presents their Market Profile indicator for the MetaTrader community. Ins
스캘핑 인스턴트 인디케이터. 지표의 기저값과 함께 매수 또는 매도 신호가 화살표로 표시됩니다. 화살표와 4개의 시간대를 표시하는 지하 표시기가 예보에서 일치할 때 강한 신호로 간주됩니다. 이 지표에는 Skalping 인스턴트 지표가 제공하는 하나의 결과로 축소된 많은 알고리즘과 작업이 포함되어 있습니다. 즉, 거래자에게 시장의 방향을 알려줍니다. 따라서 그는 제공 1. 스캘핑 신호(그림 1) 그림 1-D1과 같이 D1 차트의 선택된 기간과 지표의 지하 섹션에 매수 신호가 있습니다. 신호는 지체 없이 도착합니다. 이 경우 스캘핑 전략을 사용하여 거래하는 것이 좋습니다. 2. 신호 수정 또는 추세. 그림 2와 같이 지하실에서 그래프의 모든 기간에 대해. 모든 기간은 빨간색 영역 -> 매도 위치에 있습니다. 차트 자체의 기간과 지하 지표가 일치할 때 색상이 변경될 때까지 거래를 보류하십시오. 따라서 지표는 다른 전략에 상당히 적응할 수 있습니다. 주요 통화 쌍에 사
FiboZag
Andriy Sydoruk
Indicator FiboZag - transfer the indicator to the chart and the Fibonacci levels will be built automatically on the last ZigZag turn. The main advantage lies in the correct construction of Fibonacci levels and markup of price levels. Simple, visual and effective use. The indicator is not redrawn and does not lag. Works on all currency pairs and on all timeframes.
This is a new strategy for SUPPLY DEMAND areas It is based on a calculation using the tick volume to detect the big price action in market for both bear /bull actions this smart volume action candles are used to determine the supply and demand areas prices in between main supply and demand lines indicate sideway market  up arrows will be shown when prices moves above the main supply and the secondary supply lines Down arrows will be shown when prices moves below the main demand and the secondary
GeoWprPro
Georgij Komarov
WPR by Profile, or WPR for Professionals Geo_WprPro is one of the well-known currency profile indicators. It simultaneously displays two WPR indicators with different parameters in the matrix form on all timeframes of multiple currency pairs forming the currency profile . As follows from the description, " WPR is a leading indicator that often goes ahead of the price chart. The oscillator frequently reaches extreme values before the price reversal as if anticipating that event: it almost always
ReversalPatterns
Thushara Dissanayake
이 기술 지표는 차트에서 다양한   반전 캔들스틱 패턴을   사용하여 가격 행동을 자동으로 식별하고 분석합니다. 해당 패턴 이름과 함께 화살표 기호를 편리하게 그려주어 최신 반전 캔들스틱 패턴을 쉽게 파악할 수 있습니다. 이 지표를 사용하면 차트 분석을 이전에 식별된 캔들 패턴과 빠르게 식별하고 비교할 수 있습니다. 표시기에는 Dragonfly Doji, Gravestone Doji, Hammer, Pin Bar 등과 같이 간단하고 복잡한 다양한 구현된 촛대 패턴이 포함됩니다. 이러한 패턴은 일반적인 추세 및 과거 데이터를 기반으로 필터링되어 신뢰할 수 있는 신호를 보장합니다. 지표는 화살표를 그리고 차트에 패턴 이름을 표시하여 식별된 패턴을 시각적으로 나타냅니다. 또한 더 나은 시각적 경험을 위해 모든 개체의 화살표 유형과 색상을 사용자 지정할 수 있는 유연성이 있습니다. 패턴 식별 기능 외에도 표시기는 사용자 정의를 위한 다양한 매개변수를 제공합니다. 매수 및 매도 신호의 색상
Gioteen Volatility Index (GVI)   - your ultimate solution to overcoming market unpredictability and maximizing trading opportunities. This revolutionary indicator helps you in lowering your losing trades due to choppy market movements. The GVI is designed to measure market volatility, providing you with valuable insights to identify the most favorable trading prospects. Its intuitive interface consists of a dynamic red line representing the volatility index, accompanied by blue line that indicat
If you are using volume spread analysis, whether your are a beginner or an expert, this system will give you a lot of features and help in your analysis. Please watch the video to see all the features. Features With one click you will find all the VSA patterns on your chart . Bars without opening price. Easy to read volume indicator. Bar reader (Bar type - Close type - Volume type - Spread type). Daily and weekly levels (Pivot - Camarilla - Fibo). Very light on the trading platform and moving
WanaScalper MT4
Isaac Wanasolo
1 (1)
A scalping indicator based on mathematical patterns, which on average gives signals with relatively small SL, and also occasionally helps to catch big moves in the markets (more information in the video) This indicator has three main types of notifications: The first type warns of a possible/upcoming signal on the next bar The second type indicates the presence of a ready signal to enter the market/open a position The third type is for SL and TP levels - you will be notified every time price r
This is an indicator with real-time reminder function, which can realize real-time monitoring of four harmonic patterns of multiple cycles (30 minute chart, 1 hour chart, 4 hour chart, 1 day chart), and help traders to have insight into market reversal opportunities. Gartly Bat Butterfly Cypher Before loading into the chart, you need to manually input the switch parameters, which are the harmonic patterns   and time period you want to monitor: M30 / H1 / H4 / D1. It is on  when the corresponding
Urgently
Tatiana Savkevych
The Urgently indicator is designed to quickly determine the situation in the market, reflect the state of the market and signal profitable levels for opening trades. Market conditions change quickly enough, requiring constant calibration of trading strategies. Recommended for use in conjunction with any of the oscillators. The Urgently forex market trend indicator shows the trend direction and entry points. It smooths out price fluctuations when generating a signal by averaging the data and the
PZ Mean Reversion MT4
PZ TRADING SLU
2.33 (3)
평균 회귀 거래에 대한 전문적이고 정량적인 접근 방식을 구현하는 고유한 지표입니다. 이는 가격이 예측 가능하고 측정 가능한 방식으로 평균으로 전환되고 반환된다는 사실을 이용하여 비정량적 거래 전략을 훨씬 능가하는 명확한 진입 및 퇴장 규칙을 허용합니다. [ Installation Guide | Update Guide | Troubleshooting | FAQ | All Products ] 명확한 거래 신호 놀랍도록 쉬운 거래 사용자 정의 가능한 색상 및 크기 성능 통계 구현 대부분의 거래 전략을 능가합니다. 적절한 SL 및 TP 레벨을 표시합니다. 이메일/음향/시각 알림을 구현합니다. 작동 원리 이 지표는 더 높은 기간에서 완전히 사용자 정의 가능한 이동 평균 주변의 표준 편차를 측정하고 추세 추종 접근 방식을 사용하여 정확하게 거래를 찾습니다. 거래는 현재 차트의 가격 동작을 살펴보고 선택한 더 높은 기간에서 계산된 평균 가격대로 가격이 돌아오면 닫힙니다. 코딩 방식 때문
Atomic Analyst
Issam Kassas
5 (3)
우선적으로 언급할 점은이 거래 지표가 다시 그리지 않고 지연되지 않으며 이를 통해 수동 및 로봇 거래 모두에 이상적이라는 점입니다. Atomic Analyst는 가격의 강도와 모멘텀을 활용하여 시장에서 더 나은 이점을 찾는 PA Price Action Indicator입니다. 고급 필터를 장착하여 잡음과 거짓 신호를 제거하고 거래 잠재력을 높이는 데 도움이 됩니다. 복잡한 지표의 다중 레이어를 사용하여 Atomic Analyst는 차트를 스캔하고 복잡한 수학적 계산을 간단한 신호와 색상으로 변환하여 초보 트레이더가 이해하고 일관된 거래 결정을 내릴 수 있도록합니다. "Atomic Analyst"는 새로운 및 경험이 풍부한 트레이더를위한 종합적인 거래 솔루션입니다. 프리미엄 지표와 최고 수준의 기능을 하나의 거래 전략에 결합하여 모든 종류의 트레이더에 대한 다재다능한 선택지가되었습니다. 인트라데이 거래 및 스캘핑 전략 : 빠르고 정확한 일일 거래 및 단기 거래를 위해 설계
이 제품의 구매자들이 또한 구매함
Quantum Trend Sniper Indicator MT4
Bogdan Ion Puscasu
4.59 (39)
소개       Quantum Trend Sniper Indicator는   추세 반전을 식별하고 거래하는 방식을 변화시키는 획기적인 MQL5 지표입니다! 13년 이상의 거래 경험을 가진 숙련된 트레이더 팀이 개발한       Quantum Trend Sniper 표시기       매우 높은 정확도로 추세 반전을 식별하는 혁신적인 방법으로 거래 여정을 새로운 차원으로 끌어올리도록 설계되었습니다. ***Quantum Trend Sniper Indicator를 구입하면 Quantum Breakout Indicator를 무료로 받을 수 있습니다!*** Quantum Trend Sniper Indicator는 추세 반전을 식별하고 세 가지 이익실현 수준을 제안할 때 경고, 신호 화살표를 제공합니다. 초보자 거래자와 전문 거래자 모두에게 적합합니다. Quantum EA 채널:       여기를 클릭하세요 MT5 버전:       여기를 클릭하세요
Advanced Currency Strength28 Indicator
Bernhard Schweigert
4.9 (663)
현재 26% 할인 초보자 또는 전문가 트레이더를 위한 최고의 솔루션! 이 지표는 우리가 독점 기능과 새로운 공식을 통합했기 때문에 독특하고 고품질이며 저렴한 거래 도구입니다. 단 하나의 차트로 28 Forex 쌍의 통화 강도를 읽을 수 있습니다! 새로운 추세 또는 스캘핑 기회의 정확한 트리거 포인트를 정확히 찾아낼 수 있기 때문에 거래가 어떻게 개선될지 상상해 보십시오. 사용 설명서: 여기를 클릭  https://www.mql5.com/en/blogs/post/697384 그것이 첫 번째, 원본입니다! 쓸모없는 지망생 클론을 사지 마십시오. 더 스페셜  강력한 통화 모멘텀을 보여주는 하위 창의 화살표 GAP가 거래를 안내합니다! 기본 또는 호가 통화가 과매도/과매도 영역(외부 시장 피보나치 수준)에 있을 때 개별 차트의 기본 창에 경고 표시가 나타납니다. 통화 강도가 외부 범위에서 떨어질 때 풀백/반전 경고. 교차 패턴의 특별 경고 추세를 빠르게 볼 수 있는
TPSpro RFI Levels
Roman Podpora
5 (13)
A key element in trading is zones or levels from which decisions to buy or sell a trading instrument are made. Despite attempts by major players to conceal their presence in the market, they inevitably leave traces. Our task was to learn how to identify these traces and interpret them correctly. Reversal First Impulse levels (RFI)   -  Version MT5                INSTRUCTIONS                 RUS                 ENG                                       R ecommended to use with an indicator   -  
Advanced Supply Demand
Bernhard Schweigert
4.92 (310)
현재 33% 할인! 초보자나 전문 트레이더를 위한 최고의 솔루션! 이 보조지표는 우리가 다수의 독창적 기능과 새로운 공식을 통합한 독특하고 고품질이며 저렴한 거래 도구입니다. 이 업데이트를 통해 이중 시간대를 표시할 수 있습니다. 더 높은 TF를 표시할 수 있을 뿐만 아니라 차트 TF와 더 높은 TF 모두를 표시할 수 있습니다: 중첩 영역 표시. 모든 Supply Demand 트레이더들이 좋아할 것입니다. :) 중요한 정보 공개 Advanced Supply Demand의 잠재력을 극대화하려면 다음을 방문하십시오. https://www.mql5.com/ko/blogs/post/720245   진입 또는 목표의 명확한 트리거 포인트를 정확히 찾아냄으로 해서 거래가 어떻게 개선될지 상상해 보십시오. 새로운 알고리즘을 기반으로 매수자와 매도자 간의 잠재적인 불균형을 훨씬 더 쉽게 분간할 수 있습니다. 왜냐하면 가장 강한 공급영역과 가장 강한 수요 영역과 과거에 어떻게 진행 되었는지를(이
TPSproTREND PrO
Roman Podpora
5 (15)
TPSpro TRENDPRO  - is a trend indicator that automatically analyzes the market and provides information about the trend and each of its changes, as well as giving signals for entering trades without redrawing! The indicator uses each candle, analyzing them separately. referring to different impulses - up or down impulse. Exact entry points into transactions for currencies, crypto, metals, stocks, indices!  -  Version MT5               DETAILED DESCRIPTION        /       TRADING SETUPS           
현재 20% 할인 ! 초보자 또는 전문가 트레이더를 위한 최고의 솔루션! 이 대시보드 소프트웨어는 28개의 통화 쌍에서 작동합니다. 2가지 주요 지표(Advanced Currency Strength 28 및 Advanced Currency Impulse)를 기반으로 합니다. 전체 Forex 시장에 대한 훌륭한 개요를 제공합니다. 고급 통화 강도 값, 통화 이동 속도 및 모든(9) 시간대의 28 Forex 쌍에 대한 신호를 보여줍니다. 추세 및/또는 스캘핑 기회를 정확히 파악하기 위해 차트의 단일 지표를 사용하여 전체 시장을 볼 수 있을 때 거래가 어떻게 개선될지 상상해 보십시오! 잠재적인 거래를 식별하고 확인하면서 강력한 통화와 약한 통화를 더욱 쉽게 식별할 수 있도록 이 지표에 기능을 내장했습니다. 이 표시기는 통화의 강세 또는 약세가 증가 또는 감소하는지 여부와 모든 시간대에서 수행되는 방식을 그래픽으로 보여줍니다. 추가된 새로운 기능은 현재 시장 조건 변화에 적
Scalper Inside PRO
Alexey Minkov
4.75 (57)
SALE NOW! Limited Time Offer! An exclusive indicator that utilizes an innovative algorithm to swiftly and accurately determine the market trend. The indicator automatically calculates opening, closing, and profit levels, providing detailed trading statistics. With these features, you can choose the most appropriate trading instrument for the current market conditions. Additionally, you can easily integrate your own arrow indicators into Scalper Inside Pro to quickly evaluate their statistics and
RelicusRoad Pro
Relicus LLC
4.78 (139)
이제 $ 147 (몇 가지 업데이트 후 $ 499 증가) - 무제한 계정 (PCS 또는 MACS) RelicusRoad 사용 설명서 + 교육 비디오 + 비공개 Discord 그룹 액세스 + VIP 상태 시장을 보는 새로운 방법 RelicusRoad는 외환, 선물, 암호화폐, 주식 및 지수에 대한 세계에서 가장 강력한 거래 지표로서 거래자에게 수익성을 유지하는 데 필요한 모든 정보와 도구를 제공합니다. 우리는 초보자부터 고급까지 모든 거래자가 성공할 수 있도록 기술적 분석 및 거래 계획을 제공합니다. 미래 시장을 예측할 수 있는 충분한 정보를 제공하는 핵심 거래 지표입니다. 우리는 차트에서 말이 안 되는 여러 지표 대신 완전한 솔루션을 믿습니다. 타의 추종을 불허하는 매우 정확한 신호, 화살표 + 가격 조치 정보를 표시하는 올인원 표시기입니다. 강력한 AI를 기반으로 하는 RelicusRoad는 누락된 정보와 도구를 제공하여 교육하고 성공적인 트레이더인 트레이딩 전문
Quantum Breakout Indicator PRO
Bogdan Ion Puscasu
4.96 (26)
소개       Quantum Breakout PRO   , 브레이크아웃 존 거래 방식을 변화시키는 획기적인 MQL5 지표! 13년 이상의 거래 경험을 가진 숙련된 트레이더 팀이 개발한   Quantum Breakout PRO는   혁신적이고 역동적인 브레이크아웃 영역 전략으로 거래 여정을 새로운 차원으로 끌어올리도록 설계되었습니다. Quantum Breakout Indicator는 5개의 이익 목표 영역이 있는 브레이크아웃 영역의 신호 화살표와 브레이크아웃 상자를 기반으로 한 손절 제안을 제공합니다. 초보자 거래자와 전문 거래자 모두에게 적합합니다. Quantum EA 채널:       여기를 클릭하세요 MT5 버전 :   여기를 클릭하세요 중요한! 구매 후 설치 매뉴얼을 받으려면 개인 메시지를 보내주십시오. 추천: 기간: M15 통화쌍: GBPJPY, EURJPY, USDJPY,NZDUSD, XAUUSD 계정 유형: 스프레드가 매우 낮은 ECN, Ra
기적적인 외환 지표 소개: 정확한 트레이딩의 힘을 발휘하세요 모든 시간대에서 뛰어난 결과를 제공하는 최고의 외환 지표를 찾는데 지친 적이 있나요? 더 이상 찾을 필요가 없습니다! 기적적인 외환 지표가 도래하여 귀하의 트레이딩 경험을 혁신하고 수익을 새로운 고도로 끌어올립니다. 최첨단 기술과 수년간의 정성스런 개발을 토대로 기적적인 외환 지표는 외환 시장에서의 힘과 정확성의 정점으로 떠오릅니다. 이 탁월한 도구는 모든 수준의 트레이더의 요구를 충족시키고 지속적인 수익을 추구하는 데에서 비길 데 없는 우위를 제공하기 위해 설계되었습니다. 기적적인 외환 지표의 가장 큰 장점은 그 뛰어난 적응성에 있습니다. 당신이 데이 트레이더, 스윙 트레이더이든 장기 포지션을 선호하든, 이 지표는 모든 시간대에서 뛰어난 결과를 제공하기 위해 최적화되었습니다. 그러나 그 정확성과 시장의 복잡한 움직임을 포착하는 능력이 참으로 빛을 발하는 것은 1시간 기간대에서 사용할 때입니다. 기적적인 외환 지표의 정확성
How to use Pair Trading Station Pair Trading Station is recommended for H1 time frame and you can use it for any currency pairs. To generate buy and sell signal, follow few steps below to apply Pair Trading Station to your MetaTrader terminal. When you load Pair Trading Station on your chart, Pair Trading station will assess available historical data in your MetaTrader platforms for each currency pair. On your chart, the amount of historical data available will be displayed for each currency pai
The BB Reversal Arrows technical trading system has been developed to predict reverse points for making retail decisions. The current market situation is analyzed by the indicator and structured for several criteria: the expectation of reversal moments, potential turning points, purchase and sale signals. The indicator does not contain excess information, has a visual understandable interface, allowing traders to make reasonable decisions. All arrows appear to close the candle, without redr
GOLD Impulse with Alert
Bernhard Schweigert
4.56 (9)
이 지표는 Advanced Currency IMPULSE with ALERT  +   Currency Strength Exotics  의 2가지 제품의 슈퍼 조합입니다. 그것은 모든 시간 프레임에 대해 작동하며 8개의 주요 통화와 하나의 기호에 대한 강약의 충동을 그래픽으로 보여줍니다! 이 표시기는 금, 이국적인 쌍, 상품, 지수 또는 선물과 같은 기호에 대한 통화 강도 가속을 표시하는 데 특화되어 있습니다. 금, 은, 오일, DAX, US30, MXN, TRY, CNH 등의 진정한 통화 강도 가속(충동 또는 속도)을 표시하기 위해 9번째 줄에 모든 기호를 추가할 수 있습니다. 새로운 기본 알고리즘을 기반으로 구축되어 잠재적인 거래를 훨씬 더 쉽게 식별하고 확인할 수 있습니다. 이는 통화의 강세 또는 약세가 가속되는지 여부를 그래픽으로 표시하고 가속 속도를 측정하기 때문입니다. 자동차의 속도계처럼 생각하면 됩니다. 가속화할 때 Forex 시장에서 동일한 일이 분명히
Up down v6T
Guner Koca
5 (1)
Thise indicator is up down v6  comes with tradingwiev version. purchased people, after installed on terminal ,contact me on mql5  to get BONUS  TradingView version. up-down indicator is no repaint and works all pairs and lower than weekly time frames charts. it is suitable also 1 m charts for all pairs. and hold long way to signal. dont gives too many signals. when red histogram cross trigger line that is up signal.and price probably will down when blue histogram cross trigger line that is dow
TrendMaestro
Stefano Frisetti
5 (2)
note: this indicator is for METATRADER4, if you want the version for METATRADER5 this is the link:  https://www.mql5.com/it/market/product/108106 TRENDMAESTRO ver 2.4 TRENDMAESTRO recognizes a new TREND in the bud, he never makes mistakes. The certainty of identifying a new TREND is priceless. DESCRIPTION TRENDMAESTRO identifies a new TREND in the bud, this indicator examines the volatility, volumes and momentum to identify the moment in which there is an explosion of one or more of these data a
FX Power MT4 NG
Daniel Stein
5 (9)
모닝 브리핑 여기 mql5 와 텔레그램에서 FX Power MT4 NG 는 오랫동안 인기 있는 통화 강도 측정기인 FX Power의 차세대 버전입니다. 이 차세대 강도 측정기는 무엇을 제공합니까? 기존 FX Power에서 좋아했던 모든 것 PLUS GOLD/XAU 강도 분석 더욱 정밀한 계산 결과 개별 구성 가능한 분석 기간 더 나은 성능을 위한 사용자 정의 가능한 계산 한도 특별 멀티더 많은 것을보고 싶은 사람들을위한 특별한 다중 인스턴스 설정 모든 차트에서 좋아하는 색상을위한 끝없는 그래픽 설정 수많은 알림 옵션, 중요한 것을 다시는 놓치지 않도록 Windows 11 및 macOS 스타일의 둥근 모서리가 있는 새로운 디자인 마법처럼 움직이는 인디케이터 패널 FX 파워 키 특징 모든 주요 통화의 완전한 강세 이력 모든 시간대에 걸친 통화 강세 이력 모든 브로커 및 차트에서 고유 계산 결과 100% 신뢰할 수있는 실시간100 % 신뢰할 수있는 실시간 계산-> 다시 칠하지 않음
FX Volume
Daniel Stein
4.6 (35)
모닝 브리핑을 통해 세부 정보와 스크린샷으로 매일 시장 업데이트를 받으세요 여기 mql5 및 텔레그램에서 FX 거래량은 브로커의 관점에서 시장 심리에 대한 실제 통찰력을 제공하는 최초이자 유일한 거래량 지표입니다. 브로커와 같은 기관 시장 참여자가 외환 시장에서 어떤 포지션을 취하고 있는지에 대한 훌륭한 통찰력을 COT 보고서보다 훨씬 빠르게 제공합니다. 차트에서 이 정보를 직접 확인하는 것은 트레이딩의 진정한 판도를 바꾸고 획기적인 솔루션입니다. 다음과 같은 고유한 시장 데이터 인사이트의 이점 비율 는 통화의 매수/매도 포지션 비율을 백분율로 표시 비율 변화 는 선택한 기간 내 매수 비율과 비율 변화를 표시 총 거래량 는 해당 통화의 총 거래량(롱 및 숏)을 로트 단위로 보여줍니다 Volumes Long 는 해당 통화의 모든 롱 포지션의 거래량을 보여줍니다 Volumes Short 는 해당 통화의 모든 숏 포지션의 거래량을 보여줍니다 Net Long 는 순 롱 포지션의 거래량
Connect Indicator
Sukunthakan Ngernbamrung
Connect Indicator is a tool used for connecting indicators between the MQL market and MT4. The connected indicators are made by our group and can be used for other applications, such as sending messages to the Line application or Telegram application. If you have any questions, please don't hesitate to ask us to receive support. Function and indicator buffer Buffer one is the high price of the previous candle. Buffer two is the high price of the previous candle. Usage To connect indicators to fu
MTF Supply Demand Zones
Georgios Kalomoiropoulos
4.83 (23)
자동화된 수요 및 공급 구역의 차세대. 모든 차트에서 작동하는 새롭고 혁신적인 알고리즘. 모든 구역은 시장의 가격 움직임에 따라 동적으로 생성됩니다. 두 가지 유형의 경고 --> 1)가격이 영역에 도달할 때 2)새로운 영역이 형성될 때 당신은 더 이상 쓸모없는 지표를 얻을 수 없습니다. 입증된 결과로 완벽한 거래 전략을 얻을 수 있습니다.     새로운 기능:     가격이 공급/수요 영역에 도달하면 경고     새로운 공급/수요 구역이 생성되면 알림     푸시 알림 알림     핍의 영역 너비 레이블     기동특무부대에 한 번 더 시간이 주어집니다. 따라서 현재보다 위의 2개의 시간 프레임 대신 현재보다 높은 3개의 시간 프레임을 볼 수 있습니다.     Alerts/Zones/MTF 기능을 활성화/비활성화하는 버튼 당신이 얻는 이점:     거래에서 감정을 제거하십시오.     거래 항목을 객
FREE DEMO ONLY WORK EURO USD PAIR this indicator almost grail,no repaint and all pairs ,all timeframe indicator. there is red and blue histograms.if gold x sign comes on red histogram that is sell signal. if blue x sign comes on blue histogram that is buy signal. in thise indicator there is g1 value. this g1 value is wariable and use for to see the signals depending on which pair you are looking. this g1 value has been setled default for euro usd pair. for different pairs it has to be changed.
Price Action Entry Alerts
Stephen Sanjeeve Sahayam
5 (3)
이 지표는 매수 또는 매도 압력에 대한 모든 막대를 선별하고 볼륨이 가장 높은 4가지 유형의 캔들 패턴을 식별합니다. 이 양초는 여러 선형 필터를 사용하여 필터링되어 매수 또는 매도 신호를 표시합니다. 신호는 더 높은 시간 프레임 방향과 함께 거래량이 많은 시간에 거래될 때 가장 잘 작동합니다. 모든 필터는 사용자 정의가 가능하며 독립적으로 작동합니다. 버튼 클릭으로 단일 방향의 신호를 볼 수 있습니다. 또한 이 지표에는 의사 결정 과정을 지원할 수 있는 가장 중요한 가격 조치 및 스마트 머니 개념이 포함되어 있습니다. 하나의 도구에서 신호 및 거래 교육을 모두 제공합니다. 특징: 신호는 다시 칠하지 않습니다. Engulfing candles, Rejection candles, Expanded range candles 및 Pinbars를 식별합니다. 각 유효한 신호에 대해 여러 항목, 손절매 및 여러 이익 실현 수준을 표시합니다. 대량 세션으로 필터링합니다. 지원/저항 수준 및
Cycle Sniper
Elmira Memish
4.39 (36)
NEW YEAR SALE PRICE FOR LIMITED TIME!!! Please contact us after your purchase and we will send you the complimentary indicators to complete the system Cycle Sniper is not a holy grail but when you use it in a system which is explained in the videos, you will feel the difference. If you are not willing to focus on the charts designed with Cycle Sniper and other free tools we provide, we recommend not buying this indicator. We recommend watching the videos about the indiactor and system before pu
Entry Points Pro
Yury Orlov
4.7 (225)
다시 색을 칠하지 않고 거래에 진입할 수 있는 정확한 신호를 제공하는 MT4용 지표입니다. 외환, 암호화폐, 금속, 주식, 지수 등 모든 금융 자산에 적용할 수 있습니다. 매우 정확한 추정값을 제공하고 매수와 매도의 가장 좋은 시점을 알려줍니다. 하나의 시그널로 수익을 내는 지표의 예와 함께 비디오 (6:22)시청하십시오! 대부분의 거래자는 Entry Points Pro 지표의 도움으로 첫 거래 주 동안 트레이딩 결과를 개선합니다. 저희의   Telegram Group 을 구독하세요! Entry Points Pro 지표의 좋은점. 재도색이 없는 진입 신호 신호가 나타나고 확인되면(시그널 캔들이 완성된 경우) 신호는 더 이상 사라지지 않습니다. 여타 보조지표의 경우 신호를 표시한 다음 제거되기 때문에 큰 재정적 손실로 이어집니다. 오류 없는 거래 게시 알고리즘을 통해 트레이드(진입 또는 청산)를 할 이상적인 순간을 찾을 수 있으며, 이를 통해 이를 사용하는 모든 거래자의
TakePropips Donchian Trend Pro
Eric John Pajarillaga Aldana
4.82 (17)
TakePropips Donchian Trend Pro   (MT4)는 Donchian 채널을 사용하여 추세의 방향을 자동으로 감지하고 진입 및 퇴장 거래 신호를 제공하는 강력하고 효과적인 도구입니다! 이 다기능 지표에는 추세 스캐너, 거래 신호, 통계 패널, 스크리너, 거래 세션 및 경고 내역 대시보드가 포함됩니다. 거래 신호를 제공하고 차트 분석 시간을 절약하도록 설계되었습니다! 다음 블로그 게시물에서 사용자 설명서 및 설치 가이드를 다운로드할 수 있습니다.   https://www.mql5.com/en/blogs/post/751368 오늘 50% 할인을 받으세요! 가격이 $98에서 $49로 인하되었습니다! 전략 테스터에서 이 지표를 테스트할 수 있습니다(비주얼 모드 활성화). 실시간 차트에서 테스트하고 싶다면 저에게 메시지를 보내 7일 평가판을 받을 수도 있습니다. 자세한 내용은 설명 아래에 비디오 자습서도 제공됩니다. 질문이 있거나 도움이 필요하면 저에게 연락하십시오.
Best Currency Strength Indicator
Tumelo Patrick Rakotsoane
4.55 (47)
Advanced Currency Strength Indicator The Advanced Divergence Currency Strength Indicator. Not only it breaks down all 28 forex currency pairs and calculates the strength of individual currencies across all timeframes , but, You'll be analyzing the WHOLE forex market in 1 window (In just 1 minute) . This indicator is very powerful because it reveals the true movements of the market.  It is highly recommended to  analyze charts knowing the performance of individual currencies or the countries ec
Royal Wave Pro M4
Vahidreza Heidar Gholami
5 (3)
Royal Wave is a Trend-Power oscillator which has been programmed to locate and signal low-risk entry and exit zones. Its core algorithm statistically analyzes the market and generates trading signals for overbought, oversold and low volatile areas. By using a well-designed alerting system, this indicator makes it easier to make proper decisions regarding where to enter and where to exit trades. Features Trend-Power Algorithm Low risk Entry Zones and Exit Zones Predictions for Overbought and Over
Trend Arrow Super
Aleksandr Makarov
5 (1)
Trend Arrow Super Live signal: Click to view The indicator not repaint or change its data. A professional, yet very easy to use Forex system. The indicator gives accurate BUY\SELL signals. Trend Arrow Super is very easy to use, you just need to attach it to the chart and follow simple trading recommendations. Buy signal: Arrow + Histogram in green color, enter immediately on the market to buy. Sell signal: Arrow + Histogram of red color, enter immediately on the market to sell. Please
The "Easy Ichimoku Wave Meter" indicator is a basic tool to automatically determine Waves according to Ichimoku! The indicator gives the possibility to simultaneously apply the Wave Theory, Time Theory and Target Price Theory according to the "Little Ichimoku" strategy developed by Sense Hosoda on the MT4 platform.  The use of this tool allows not only novice traders to instantly (fully automatic) determine the waves and their rapid interpretation, it also allows to automatically measure the p
XQ Indicator MetaTrader 4
Marzena Maria Szmit
3 (2)
Step into the realm of Forex trading with confidence and precision using XQ, a cutting-edge Forex indicator designed to elevate your trading game to unprecedented heights. Whether you're a seasoned trader or just stepping into the world of currency exchange,   XQ Forex Indicator   empowers you with the insights and signals needed to make informed trading decisions. The signal conditions are a combination of three indicators, and XQ Forex Indicator only display  medium and long-term trends . The
Reversal Sniper
Elmira Memish
5 (3)
Reversal Sniper is designed to find the extreme reversals of the price. Indicator collects data of Cycle Sniper Indicator. NOTE: REVERSAL SNIPER Indicator is made for Cycle Sniper Users as an additional tool.  However, it can be used by the traders who look for finding out strong reversal levels. Indicator works on all timeframes and all instruments. Reversal  Sniper  Checks: Harmonic Patterns RSI Zig Zag and Harmonic Swings Cycle Sniper Indicator's Buy / Sell Signals The complex algo i
제작자의 제품 더 보기
1. Compound Drawings (1) Line segment with arrow (2) Continuous line segment (broken line) (3) Parallelogram (4) Polygon (5) Profit and loss ratio measurement tools 2.   Backtracking  By the Z key  in the process of drawing the line Line types that support Z-key backtracking: continuous line segments (broken line) ,channels,parallelograms,polygons, and fibo extensions. 3.Automatic Adsorption (1) Click the "Lock-Button" to switch the automatic adsorption switch before drawing the line (2)
Part One : Characteristics Integrated line drawing and wave marking function Automatic adsorption( namely Auto Search High/Low )during Drawing Draw zigzag Lines and Fibo/Expansion at the same time Calculate the scale rate of  Interval Spans which is called Qjt for short Continuously delete objects by click Deleting drawings in batch Show/Hide Drawings and Wave-Marks Quickly save current chart as picture to certain folder Show/Hide main panel by  click certain zone of PriceAxis or by hotkey W Swi
LuXiwu Trend Trading  special wave marking tool 0.Main table show hide Click the  bottom  10% area of price axis to show or hide main table,or by default key Q. 1. QJT search Click the high or low point of the main wave to automatically find the QJT . If there is overlap between the inner and outer intervals, click the button << or >> to adjust the left and right, or manually drag the adjustment after completion.If there is a failure wave, you can use the system's own trend line to draw the
注意️测试模式并不能完全正常运行 所以那个免费模拟是个摆设 和实际效果相差甚远 实际效果比GIF图片里面要流畅不存在卡顿和性能问题 十年前的i3都没有任何压力 ____ 由于MT5的画线功能比较基础,迈达克官方也无意改进升级,但是后起之秀TradingView的出现极大拓展了画线分析部分的功能 (当然TV的优势远不止于此),甚至国内的很多看盘软件的画线功能也比MT4原生的画线功能要强大。当然市面上传播的画线工具肯定也是有很多的包括五年前我写的一些相对简单的工具。 但是现存的所有加起来也无法和便捷画线工具第三版相提并论,这是MT史上最强的画线工具没有之一,这是使用画线工具的朋友给出的评价。 本工具初版5-6千行代码,经过一年的升级优化写到第三版已经超过2万行代码(当然空行大括号和注释的占比也不会很低估计在10-20%左右我的代码很规范 每一个变量都不会瞎命名也不会对只用得到一两次的功能单独写一个函数当然也不会在需要反复调用的时候一遍遍复制雷同代码),最终功能呈现就是本文档所见这样几十个功能改进当然有些细节本文档也没有具体讲需要用户观看讲解视频学习使用。 ____ 本工具细
필터:
리뷰 없음
리뷰 답변