KT ATR Bands MT5

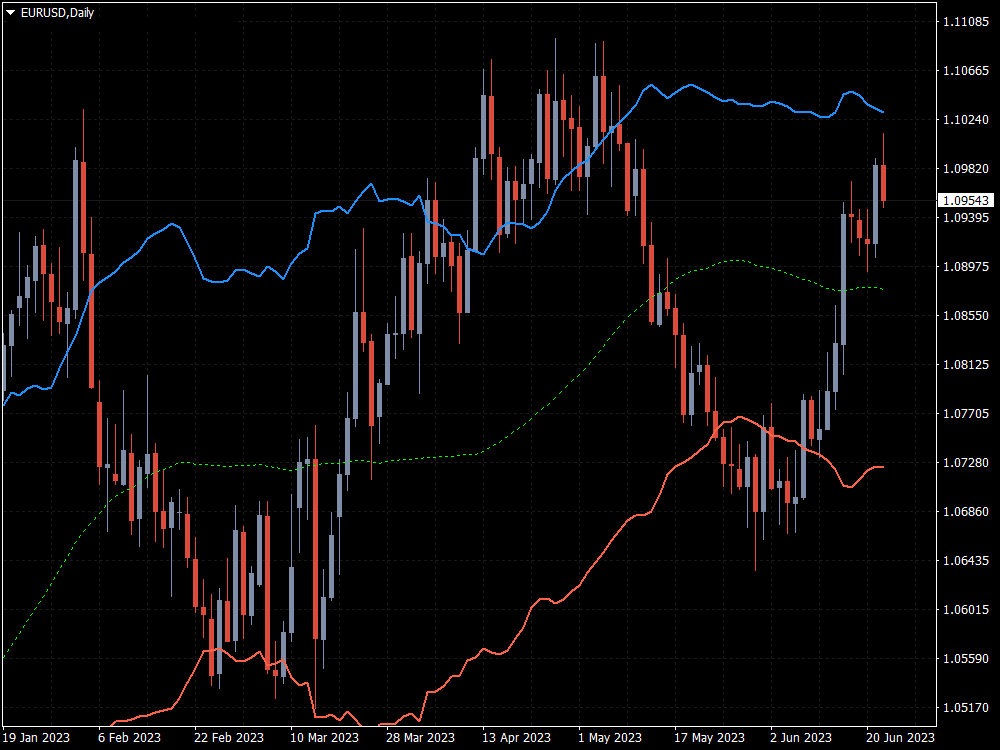
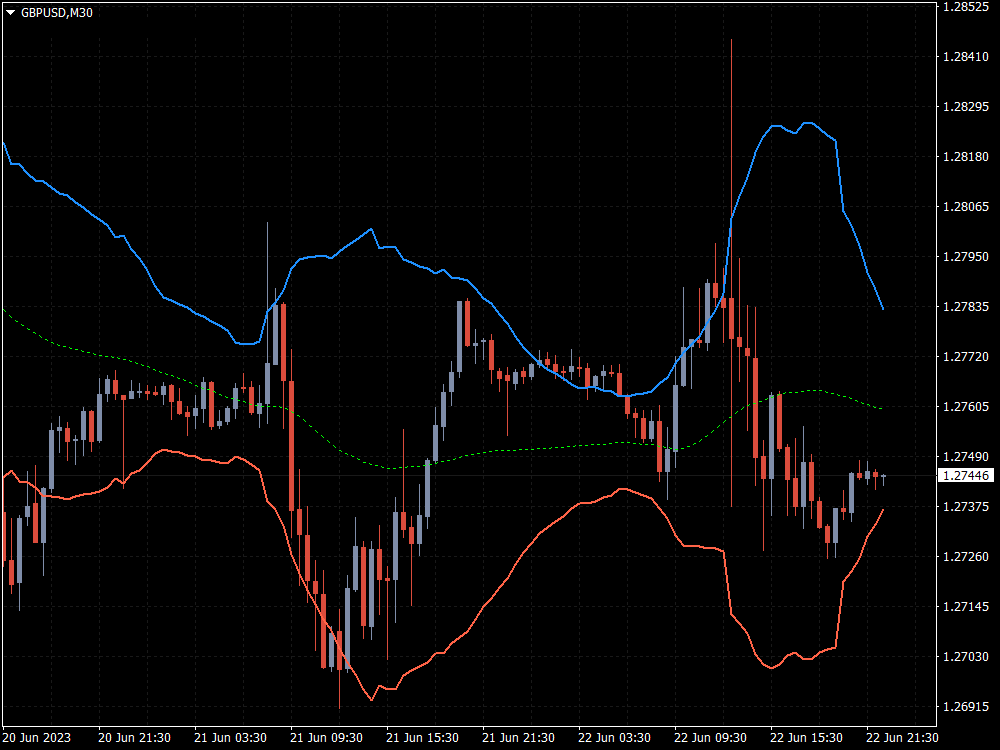
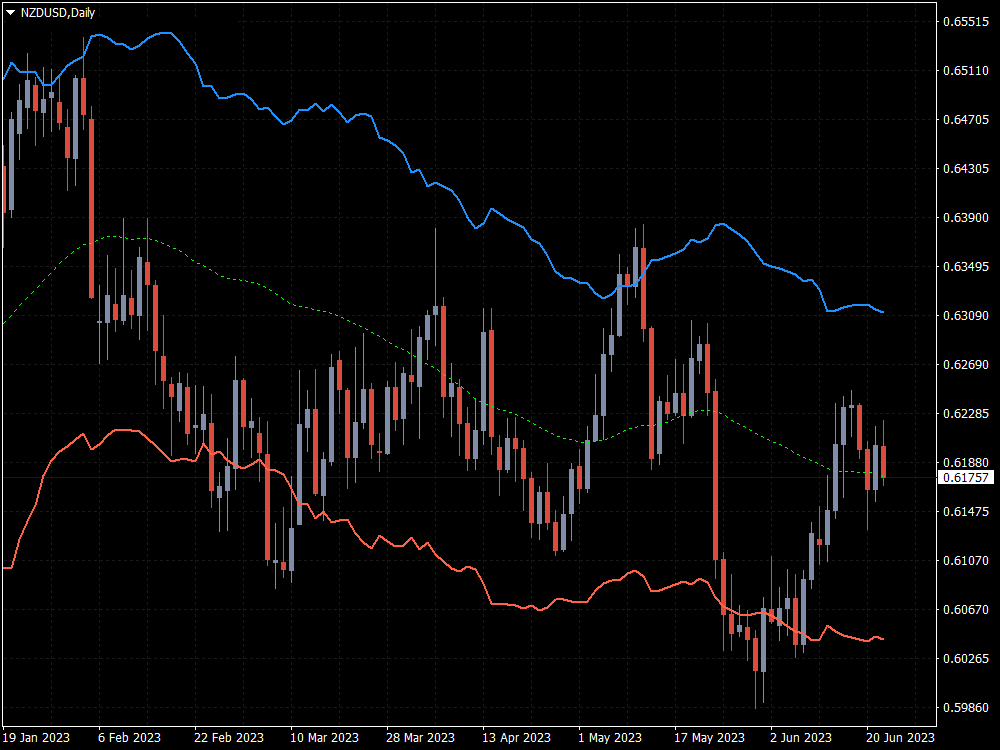
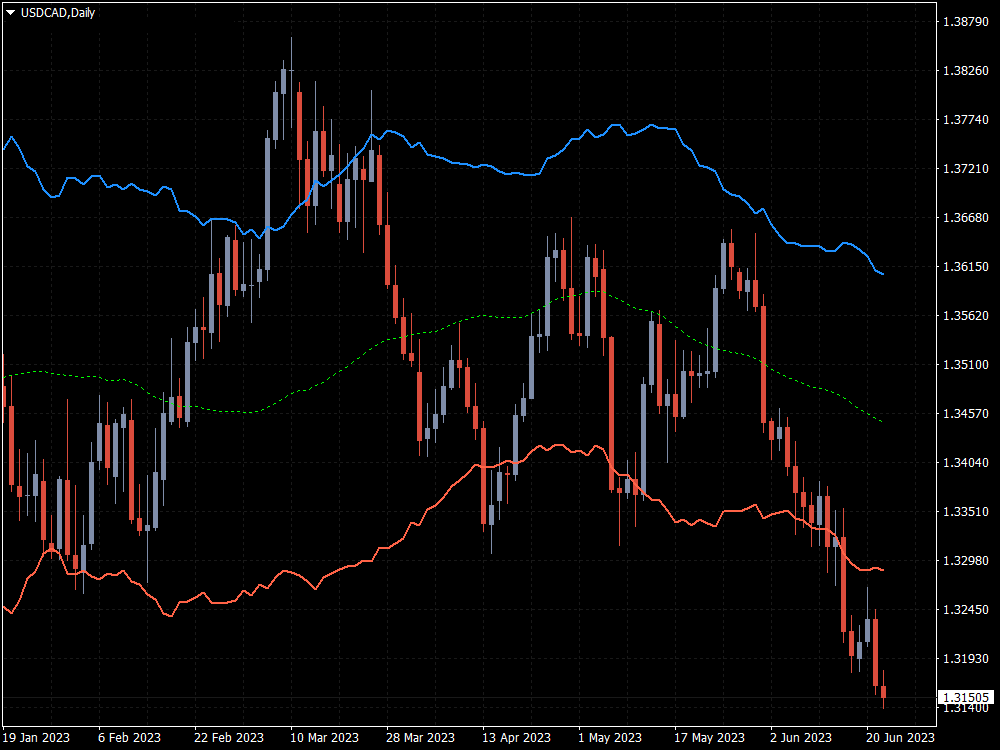
KT ATR Bands는 평균 진폭(ATR)과 이동 평균을 결합하여 변동성 밴드를 차트에 시각적으로 표시합니다. 이 밴드는 일반적으로 가격 반전 가능성이 높은 지점이나 변동성이 높은 시기와 낮은 시기를 식별하는 데 유용합니다.

기능

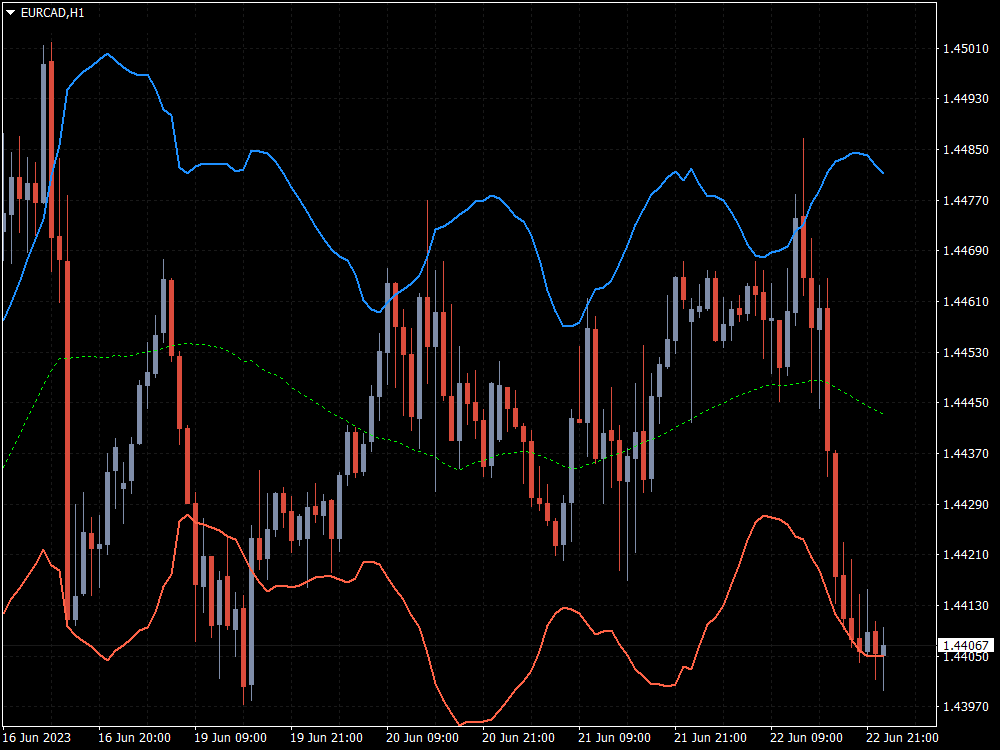
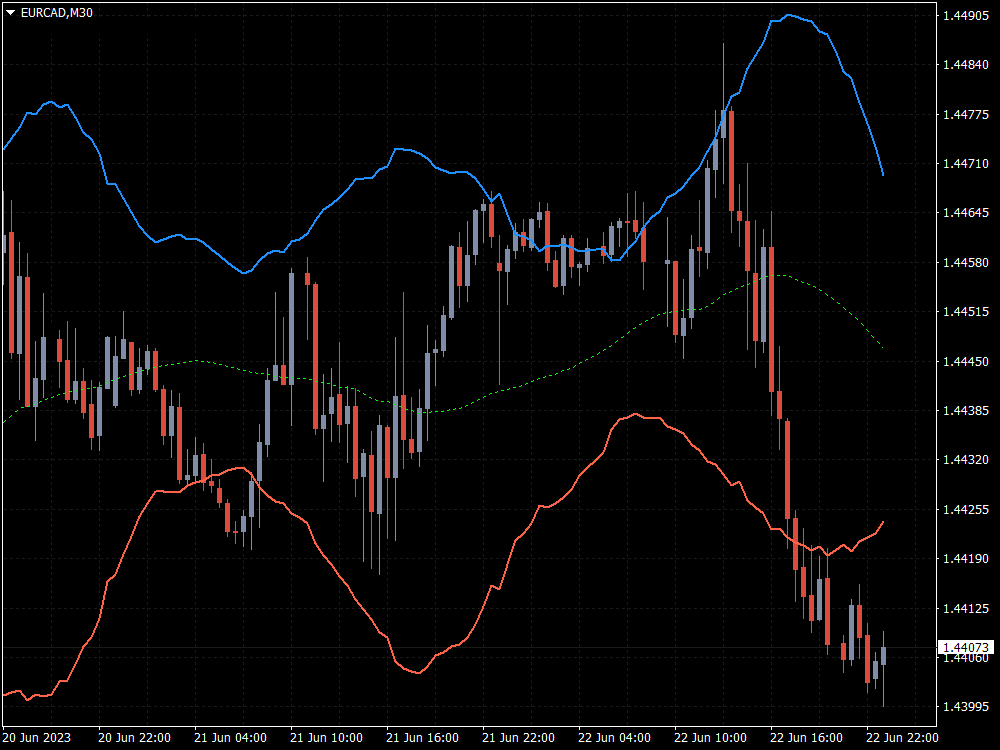
  • 다중 시간 프레임 기능: 예를 들어, 일봉 기준의 ATR 밴드를 1시간 차트에서 표시할 수 있습니다.
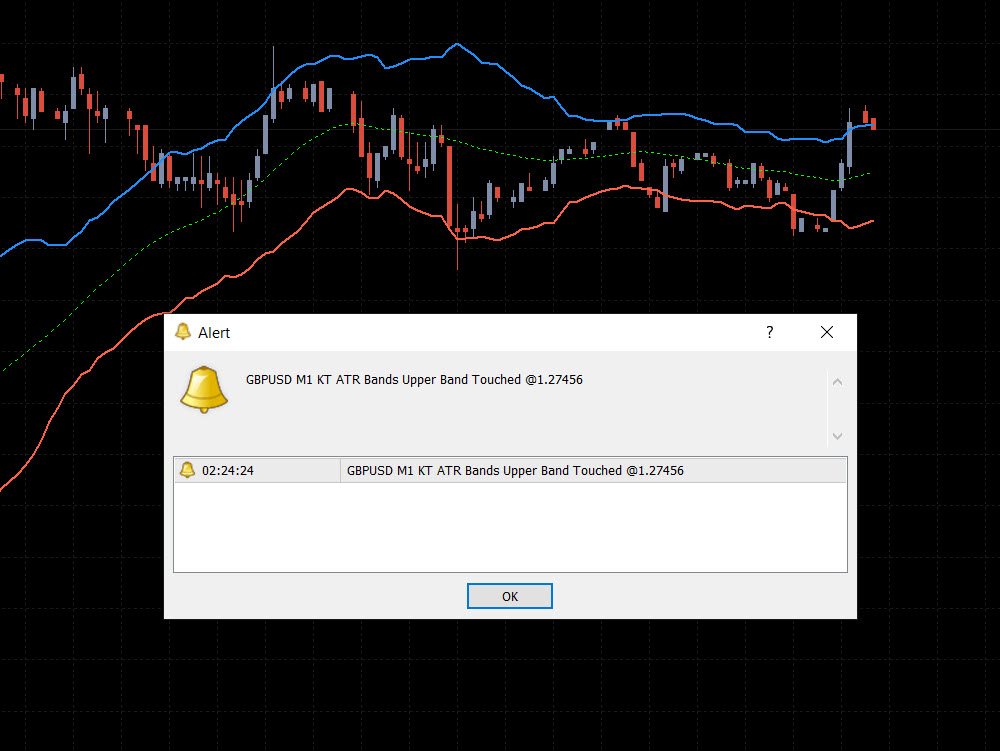
  • 스마트 알림: 각 밴드에 대해 개별적으로 알림을 설정할 수 있으며, 알림 간 최소 시간 간격도 지정할 수 있어 불필요한 알림을 줄일 수 있습니다.
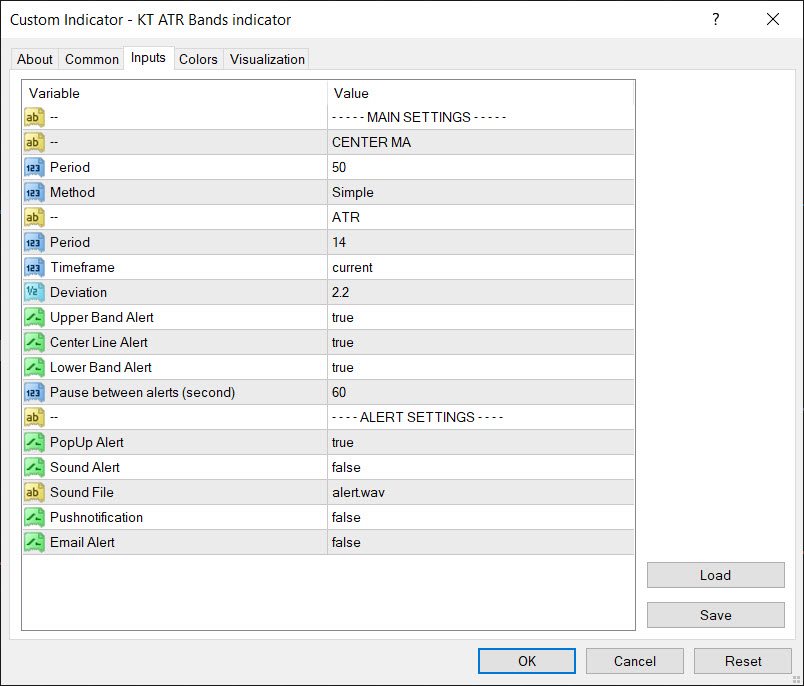
  • 완전한 사용자 설정 가능: ATR 기간, MA 방식, 색상 등 다양한 요소를 자유롭게 설정할 수 있습니다.
  • 처음부터 자체 개발: 성능을 최적화하고 오류를 방지하기 위해 코드가 완전히 새롭게 작성되었습니다.

ATR 밴드 이해하기

트레이딩 세계에는 수많은 보조 지표가 존재하며, ATR Bands는 그 중에서도 시장의 변동성을 분석하는 데 효과적인 도구입니다.

이 지표를 MT4/MT5에 설정하는 방법, 진입 전략을 구성하는 방법, 손절 및 이익 실현 수준을 설정하는 방법에 대해 살펴봅니다.

ATR 밴드의 배경

ATR 밴드는 자산 가격 위와 아래에 표시되는 변동성 기반 채널입니다.

ATR 값은 특정 기간 동안의 전체 가격 범위를 기준으로 계산되며, 일반적으로 14기간이 사용됩니다.

변동성은 자산의 가격이 얼마나 빠르게 오르거나 내리는지를 나타내며, 트렌드의 강도와 반전 가능성을 판단하는 데 중요합니다.

ATR 값과 배수를 조절하면 밴드가 시장의 변화에 얼마나 민감하게 반응할지를 조정할 수 있습니다.

이는 켈트너 채널과 같은 다른 변동성 기반 지표와 유사합니다.

추천 제품
Bollinger Bands Reversal Strategy:   Automatically sells at the upper band and buys at the lower band. Smart Position Averaging:   Opens multiple positions to lower entry costs during pullbacks. Optimized for XAUUSD:   Proven results on Gold with high-profit potential. Works best in uncertain sideways Market  How It Works: This expert advisor (EA) capitalizes on mean-reversion in volatile uncertain markets by executing   precision trades when price touches Bollinger Bands : SELL   triggered at
FREE
Visual Wave Indicator
AL MOOSAWI ABDULLAH JAFFER BAQER
Visual Waves Indicator: Ride the Trend with Clarity Unlock a smarter way to trade with the Visual Waves Indicator, a sophisticated tool designed to provide clearer, more reliable trend signals on the MetaTrader 4 platform. Are you tired of the false signals and market noise generated by traditional moving averages? The Visual Waves Indicator is your solution. It moves beyond basic calculations to offer a truly adaptive analysis of market momentum, helping you identify trading opportunities with
KT COG Advanced MT5
KEENBASE SOFTWARE SOLUTIONS
KT COG is an advanced implementation of the center of gravity indicator presented by John F. Ehlers in the May 2002 edition of Technical Analysis of Stocks & Commodities magazine. It's a leading indicator which can be used to identify the potential reversal points with the minimum lag. The COG oscillator catches the price swings quite effectively. MT4 version of the same indicator is available here KT COG Advanced MT4 Calculation of COG The COG indicator is consist of the two lines. The main l
Overview Donchian Long Edge is a modern take on Richard Donchian’s classic channel breakout strategy — adapted specifically for long-only momentum and reversal entries. It combines the proven logic of Donchian breakouts with ATR-based buffers, rearm logic, and session-aware filters. The indicator highlights buy signals only , designed for trend-following and range-reversal trading approaches. This version introduces session start/end markers and time-based signal filtering , making it especially
RBreaker
Zhong Long Wu
RBreaker Gold Indicators는 금 선물을 위한 단기 데이 트레이딩 전략으로, 추세 추종과 데이 내 반전의 두 가지 거래 방식을 결합합니다. 추세 장에서 수익을 포착할 수 있을 뿐만 아니라, 시장이 반전될 때 적시에 이익을 확정하고 추세에 맞춰 반대 포지션을 잡을 수 있습니다. 이 전략은 미국 잡지 Futures Truth에서 15년 연속으로 가장 수익성 높은 트레이딩 전략 상위 10위 안에 선정되었습니다. 긴 라이프사이클을 자랑하며, 현재까지 국내외에서 널리 사용되고 연구되고 있습니다. 본 지표는 2026년 금 선물의 움직임을 반영하여 14일 ATR 지표를 기반으로 돌파 계수 A, 관찰 계수 B, 반전 계수 R을 보다 합리적인 값으로 정의했습니다. 매우 훌륭한 지표이며, 안정적인 연간 수익성을 달성했습니다. 강력히 추천합니다~ 위 지표는 변동성이 높은 상품에 적합하며, 매개변수는 금 선물, 주가 지수 선물 등에 적합합니다. 다른 상품이 필요한 경우 돌파 계수 A
The chaos wave
Letlhogo Mokgatle
This is the best indicator we have created by far, this indicator replicates the well known heiken ashi indicator,  but with a more precise entry point, this indicator can work on all time-frames and is strong on all the time frames , this indicator does not repaint nor does it lag , this indicator strategy combined with price action will change your trading experience , elevate your experience to the next level.
Visual Heatmap Book Analyzer
Alexandre Moraes De Souza Lima
Visual Heatmap Book Analyser This indicator monitors the market liquidity and generates colors based on order patterns, quantities, and renewal activities in the book. This allows you to visualize the order flow and identify areas of high and low liquidity and activity. The indicator uses machine learning techniques to analyze the order behavior in the book, enabling it to detect patterns and trends in orders, allowing you to make informed decisions about your trading operations. The color pale
Candle Countdown — MT5용 정확한 캔들 종료 시간 카운트다운 Candle Countdown은 차트 위에 현재 캔들이 종료될 때까지 남은 시간 을 표시하는 간단하고 정확한 도구입니다. 진입 시점이 캔들 마감에 의존하는 경우, 몇 초의 차이도 중요합니다. 이 인디케이터는 정확한 시간을 보여주어 서두르거나 추측하지 않고 결정을 내릴 수 있도록 도와줍니다. 캔들 종료 시간을 정확하게 제어하기 위한 인디케이터입니다. 표시 내용: 캔들 종료까지 남은 시간 현재 서버 시간 스프레드 Stop Level 타이머는 틱에 의존하지 않고 플랫폼의 내부 타이머를 통해 업데이트되므로, 시장 움직임이 적은 상황에서도 안정적으로 동작합니다. 이로 인해 낮은 변동성 구간에서도 부드럽고 안정적인 카운트다운을 제공합니다. 모든 정보는 배경 블록에 표시되어 어떤 차트 색상에서도 잘 보이며, 차트 분석을 방해하지 않습니다. 캔들 종료 시점이 가까워질수록 타이머 색상이 변경되어 빠르게 상황을 파악할 수
FREE
Ravi Gold SMC
Ravinath Parak
Product:   SMC-based automated trading robot for XAUUSD (Gold) on M1 timeframe. Core Strategy:   Enters trades using institutional Smart Money Concepts (SMC)—Liquidity Sweeps, Order Blocks, Fair Value Gaps, and Breaker Blocks—with traditional swing levels as a fallback. Key Feature – Intelligent Hedge:   Places a pending hedge order exactly at the original position’s stop loss. The hedge activates only if the stop is hit, trails profits faster (10 pips vs. 60 pips for the original), and is de
Angle of Moving Average MT5 로 거래 의사 결정을 향상시키세요. 이 혁신적인 인디케이터는 이동 평균의 기울기를 정량화하여 트렌드 방향과 모멘텀에 대한 명확한 통찰력을 제공합니다. 지정된 바 수에 걸쳐 이동 평균의 각도 기울기를 측정하는 원칙에 기반한 이 도구는 2010년경 트레이딩 커뮤니티에서 개념화된 이후 기술적 분석의 핵심 요소로 자리 잡았습니다. Forex Factory와 같은 포럼에서 널리 논의되고 시장 다이내믹스의 직관적인 시각화로 찬사를 받은 Angle of Moving Average는 복잡한 오실레이터에 대한 강력한 대안으로, 지나치게 복잡한 공식의 노이즈 없이 강세 또는 약세 바이어스를 직접적으로 측정합니다. 트레이더들은 Angle of Moving Average를 트렌드 강도, 잠재적 반전, 최적의 진입/청산 지점을 직관적인 히스토그램 디스플레이—상승 모멘텀은 녹색, 하락 이동은 적색—를 통해 신호로 나타내는 뛰어난 능력으로 높이 평가합니다. 현
Pure Path
Jean Carlos Souza
ST Pure Path Indicator Description for Metatrader ST Pure Path Indicator Description for Metatrader This document aims to provide a clear and accessible description of the ST Pure Path indicator, developed for the Metatrader platform. It is designed to assist traders, especially those with little experience, in identifying market trends and decision points visually and intuitively. 1. Visual Identification The ST Pure Path appears on the chart as a continuous, solid line , with a thickness of 2
FREE
Tops and Bottoms Indicator
Josue De Matos Silva
4.6 (5)
Tops & Bottoms Indicator FREE   Tops abd Bottoms:   An effective indicator for your trades The tops and bottoms indicator helps you to find  ascending and descending channel formations with indications of ascending and/or descending tops and bottoms. In addition, it  show possibles  opportunities with a small yellow circle when the indicator encounters an impulse formation. This indicator provide to you  more security and speed in making entry decisions. Also test our FREE advisor indicator:  
FREE
Follow The Line MT5
Oliver Gideon Amofa Appiah
4.6 (35)
This indicator obeys the popular maxim that: "THE TREND IS YOUR FRIEND" It paints a GREEN line for BUY and also paints a RED line for SELL. (you can change the colors). It gives alarms and alerts of all kinds. IT DOES NOT REPAINT and can be used for all currency pairs and timeframes. Yes, as easy and simple as that. Even a newbie can use it to make great and reliable trades. NB: For best results, get my other premium indicators for more powerful and reliable signals. Get them here: https://www.m
FREE
CustomRSI50 Alert and Mail at Cross - 알림 및 이메일 기능이 포함된 맞춤형 RSI 지표 설명 CustomRSI50 Alert and Mail at Cross는 인기 있는 상대강도지수(RSI)를 기반으로 한 고급 기술 지표로, RSI 레벨이 50 임계값을 교차할 때 즉각적인 알림과 이메일 통지를 통해 자동화된 거래를 간소화하도록 설계되었습니다. 이 지표는 RSI의 명확하고 맞춤 가능한 시각화를 제공하며, 많은 트레이더들에게 모멘텀 분석에서 중요한 50 레벨에 특별히 중점을 둡니다. 주요 특징 50 레벨 교차 시 알림 및 이메일 통지 발송 구성 가능한 RSI 기간 강조된 50 참조 레벨 맞춤 가능한 적용 가격 유형 별도 창에서 표시 쉬운 해석을 위한 0에서 100까지의 고정 척도 맞춤 설정 가능한 매개변수 RSI_Period: RSI 계산 기간 설정 가능 (기본값: 14) applied_price: 계산에 사용할 가격 유형 선택 가능 (기본값: 종가) En
Market Sessionsync** is a cutting-edge trading session indicator designed to enhance your trading experience by visually breaking down the market's daily rhythm. With a compact window overlaid on your chart, this indicator provides a split-second understanding of the current trading session through: Basic setup: Set Difference between your local time and your broker time , set DST(Daylight Saving Time) ON or OFF , set timescale sync you want to use (Local, Broker, CET) - A vertical time marker
FREE
Donchian Breakout And Rsi
Mattia Impicciatore
4.5 (2)
개요 이 지표는 클래식 돈치안 채널(Donchian Channel) 의 향상된 버전으로, 실전 트레이딩을 위한 다양한 기능이 추가되었습니다. 표준 세 개의 선(상단, 하단, 중앙선) 외에도 브레이크아웃 을 감지하여 차트에 화살표로 시각적으로 표시하며, 차트를 깔끔하게 보기 위해 현재 추세 방향의 반대 라인만 표시 합니다. 지표 기능: 시각적 신호 : 브레이크아웃 시 컬러 화살표 표시 자동 알림 : 팝업, 푸시 알림, 이메일 RSI 필터 : 시장의 상대 강도를 기반으로 신호 검증 사용자 맞춤 설정 : 색상, 선 두께, 화살표 코드, RSI 임계값 등 동작 원리 돈치안 채널은 다음을 계산합니다: 상단선 : 최근 N개의 종가 완료 캔들에서 가장 높은 고가 하단선 : 최근 N개의 종가 완료 캔들에서 가장 낮은 저가 중앙선 : 고가와 저가의 평균값 상방 브레이크아웃 은 종가가 상단선을 돌파할 때 발생하며, 하방 브레이크아웃 은 종가가 하단선 아래로 내려갈 때 발생합니다. 이 지표는: 세 개의
FREE
Antique Trend
Nadiya Mirosh
The Antique Trend Indicator is a revolutionary trend trading and filtering solution with all the important features of a trend tool built into one tool! The Antique Trend indicator is good for any trader, suitable for any trader both for Forex and binary options. There is no need to configure anything, everything has been perfected by time and experience, it works great during flats and trends. The Antique Trend indicator is a tool for technical analysis of financial markets, reflecting curren
The SMC Analyzer STF is a powerful, single-timeframe Smart Money Concepts (SMC) analysis tool designed for precision trade confirmations based on core SMC components. It evaluates market structure across four levels of confirmation using elements such as Break of Structure (BOS), Change of Character (CHoCH), Order Blocks (OB), Fair Value Gaps (FVGs), Liquidity Zones, and Higher Timeframe Trend Bias. Each level has configurable elements (BOS, OB, FVG, Liquidity Zones, Higher Timeframe Trend). The
Bollinger Trend Lines – MT4 & MT5 Bollinger Trend Lines is a professional volatility-based trend indicator designed to clearly identify trend direction and dynamic stop levels using Bollinger Bands. Fuses on one core principle: follow the trend, ignore noise, and let volatility define the stop. How it works The indicator builds trailing trend lines using Bollinger Bands: In an uptrend , the lower band trails price and can only rise In a downtrend , the upper band trails price and can only
True Day
Aurthur Musendame
5 (1)
True Days is a tool designed specifically for the trader who wants to catch intraday volatility in price charts.  True day makes it easier for the trader to avoid trading in the dead zone - a period in time where markets are considered dead or non volatile. The trader can concentrate on finding opportunities only during periods of profound market movements. By default the indicator gives you a true day starting at 02:00 to 19:00 hours GMT+2. You can adjust according to your Time Zone. By deafult
FREE
ICONIC Reversal Engine Quality over quantity. Trade only the reversals that matter. The Problem: Noise, Overload, False Signals Most indicators flood charts with arrows but ignore context. A hammer in a strong downtrend is irrelevant. An engulfing without volume is a trap. Result: analysis paralysis, missed moves, costly errors. The Solution: Your Analytical Co-Pilot The ICONIC Reversal Engine is not “just another arrow.” It explains why a setup matters. Every signal is stress-tested through a
FREE
Holiday Sales Zones Indicator The Zones Indicator is your everyday Trading tool that  leverages advanced algorithms, including ICT institutional concepts like order blocks , engulfing candle patterns , and Level interactions , to identify critical levels of supply and demand (Resistance & Support). Visual signals are generated and clearly marked on the chart, providing a straightforward guide for traders to spot key opportunities. Key Features Advanced Algorithmic Analysis : Identifies supply
BB Engulfing Bar V2 MT5
Nedyalka Zhelyazkova
The indicator defines the Bullish and Bearish Engulfing Bar. The pattern has greater reliability when the open price of the engulfing candle is well above the close of the first candle, and when the close of the engulfing candle is well below the open of the first candle. For an engulfing bar to be valid it must fully engulf at least one previous bar or candle - includes all the body and the wick. The engulfing bar can engulf more than one bar as long as it completely engulfs the previous bar.
FREE
Pips On Candles
Giuseppe Nittoli
Pips on Candles shows the number of pips involved in each candle on the chart. It is possible to set 3 different ranges for counting on each single candle via the RangeType parameter: With "HighLow" you count the pips present between the minimum and the maximum. The number is shown under each candlestick on the chart. With "OpenClose" you count the pips present between the opening and closing price of the candle. The number is shown under each candlestick on the chart. With "HighDistAndLowDist"
Stop Guessing the Trend. See it Clearly. The SuperTrend is one of the most popular and reliable trend-following indicators in the world for a reason: it works. But standard versions can be hard to read in real-time. Titan SuperTrend Pro takes this classic algorithm and upgrades it for the modern trader. It provides crystal-clear visual signals on your chart and instant alerts to your phone, ensuring you never miss a major trend reversal again. It is built on the robust ATR (Average True Range) c
Double TMA with Reversal Zones
Clayton Prickett
4.5 (10)
Note from Developer: This is the lite version of the Double TMA with Bands Indicator. You can find the paid version that comes with alerts and on screen signal arrows built in here . I will also be selling an EA based on this trading system soon once all backtesting and optimization have been completed. Unlock your trading potential with the Double TMA Indicator with Reversal Detection! Designed for swing and reversal trading, this versatile tool integrates two Triangular Moving Averages (
FREE
Smart Buy Sell Signal is a powerful and easy-to-use trend trading indicator designed for traders who want clear and reliable buy and sell signals. The indicator uses an ATR-based smart trailing algorithm to detect trend reversals and generate precise entry signals. When the market trend changes, the indicator automatically plots Buy and Sell arrows directly on the chart, helping traders quickly identify trading opportunities. To improve decision making, the indicator also includes a Multi-Timefr
Trendline mt5 indicator
David Muriithi
4 (2)
Are you tired of drawing trendlines every time you're analyzing charts? Or perhaps you would like more consistency in your technical analysis. Then this is for you. This indicator will draw trend lines automatically when dropped on a chart. How it works Works similar to standard deviation channel found on mt4 and mt5. It has 2 parameters: 1. Starting Bar 2. Number of bars for calculation The   starting bar   is the bar which drawing of the trend lines will begin, while the   number of bars for c
FREE
BeansAssist
Ivanvielle Bonifacio Dupaya
BeansAssist Gives you fruitful information of the price of the symbol that you are trading. Improve your trades simply by following the suggestion that it gives you. Tracks deal stats daily so you keep track of your performance. Don't let emotions take control, be a better and profitable trader with BeansAssist to guide you. *Note: This utility is not for free 
# Wilders Volatility Trend Following Optimised 지표 문서 ## 소개 Wilders Volatility Trend Following Optimised 지표는 MetaTrader 5를 위한 정교한 추세 추종 기술 분석 도구입니다. 이 지표는 시장 상황에 동적으로 적응하는 고급 적응형 추세 추종 시스템을 구현하여 트레이더에게 명확한 진입 및 퇴출 신호를 제공하는 동시에 최적의 이익 실현 및 손절매 수준을 자동으로 계산합니다. 이 지표는 추세 기반 전략을 따르는 트레이더를 위해 설계되었으며, 시장 변동성 변화에 대응하는 적응형 리스크 매개변수를 통해 거래 관리를 최적화하는 것을 목표로 합니다. ## 주요 기능 - **적응형 추세 추종** : 시장 추세를 자동으로 식별하고 추적 - **동적 포지션 관리** : 최적의 진입, 퇴출, 손절매 및 이익 실현 수준 계산 - **변동성 기반 매개변수** : 평균 실제 범위(ATR)를 사용하여 시장 변동성
이 제품의 구매자들이 또한 구매함
SuperScalp Pro
Van Minh Nguyen
4.72 (18)
SuperScalp Pro – 고급 다중 필터 스캘핑 인디케이터 시스템 SuperScalp Pro는 클래식 Supertrend와 여러 지능형 확인 필터를 결합한 고급 스캘핑 인디케이터 시스템입니다. 해당 인디케이터는 M1부터 H4까지 모든 타임프레임에서 효율적으로 작동하며, 특히 XAUUSD, BTCUSD 및 주요 외환 통화쌍에 적합합니다. 독립형 시스템으로 사용하거나 기존 거래 전략에 유연하게 통합할 수 있습니다. 이 인디케이터는 11개 이상의 필터를 통합하며, 빠른/느린 EMA, 추세 판별용 3개의 EMA, EMA 기울기(EMA slope), RSI, ADX, 거래량(Volume), VWAP, 볼린저 밴드 돌파(Bollinger Bands Breakout) 및 MACD 다이버전스 필터 등을 포함합니다. 스마트 캔들 필터는 캔들 종가를 확인하여 약한 신호를 제거하고, 3 EMA와 MACD 다이버전스 필터를 결합한 추세 인식 메커니즘은 더 높은 승률의 신호를 선별하는 데 도움을 줍니
Power Candles MT5
Daniel Stein
4.75 (8)
Power Candles – 모든 시장을 위한 강도 기반 진입 신호 Power Candles 는 Stein Investments의 검증된 강도 분석을 가격 차트에 직접 제공합니다. 가격 움직임에만 반응하는 대신, 각 캔들은 실제 시장 강도를 기준으로 색상화되어 모멘텀 형성, 강도 가속, 명확한 추세 전환을 즉시 파악할 수 있습니다. 모든 시장을 위한 단일 로직 Power Candles는 모든 거래 심볼 에서 자동으로 작동합니다. 현재 심볼이 Forex인지 비-Forex 시장인지 자동으로 감지하여 내부적으로 적절한 강도 모델을 적용합니다. Forex 및 Gold 는 FX Power Delta 값을 사용합니다 (절대값 범위 최대 100) 지수, 크립토 및 CFD 는 IX Power Strength 값을 사용합니다 (절대값 범위 최대 50) 필요한 강도 계산은 Power Candles에 완전히 내장되어 있습니다. 캔들 색상이나 신호 로직을 위해 추가 인디케이터는 필요하지 않습니다. 가격
Entry In The Zone and SMC Multi Timeframe is a real-time 2-in-1 market analysis tool that combines market structure analysis and a No Repaint BUY / SELL signal system into a single indicator, built on Smart Money Concepts (SMC) — a widely adopted framework used by professional traders to understand market structure. This indicator helps you see the market more clearly, make decisions based on structure rather than guesswork, and focus on high-probability zones where price is more likely to react
Divergence Bomber
Ihor Otkydach
4.9 (86)
이 지표를 구매하신 분께는 다음과 같은 혜택이 무료로 제공됩니다: 각 거래를 자동으로 관리하고, 손절/익절 수준을 설정하며, 전략 규칙에 따라 거래를 종료하는 전용 도우미 툴 "Bomber Utility" 다양한 자산에 맞게 지표를 설정할 수 있는 셋업 파일(Set Files) "최소 위험", "균형 잡힌 위험", "관망 전략" 모드로 설정 가능한 Bomber Utility의 셋업 파일 이 전략을 빠르게 설치, 설정, 시작할 수 있도록 돕는 단계별 영상 매뉴얼 주의: 위의 모든 보너스를 받기 위해서는 MQL5 개인 메시지 시스템을 통해 판매자에게 연락해 주세요. 독창적인 커스텀 지표인 “Divergence Bomber(다이버전스 봄버)”를 소개합니다. 이 지표는 MACD 다이버전스(괴리) 전략을 기반으로 한 올인원(All-in-One) 거래 시스템입니다. 이 기술 지표의 주요 목적은 가격과 MACD 지표 간의 다이버전스를 감지하고, **향후 가격이 어느 방향으로 움직일지를 알려주는
Azimuth Pro
Ottaviano De Cicco
5 (6)
Azimuth Pro V2: Synthetic Fractal Structure and Confirmed Entries for MT5 Overview Azimuth Pro is a multi-level swing structure indicator by Merkava Labs . Four nested swing layers, swing-anchored VWAP, ABC pattern detection, three-timeframe structural filtering, and closed-bar confirmed entries — one chart, one workflow from micro-swings to macro-cycles. This is not a blind signal product. It is a structure-first workflow for traders who care about location, context, and timing. V2 Launch Offe
OmniSync Projection
Antonio-alin Teculescu
5 (1)
Chronos Fractal Engine is an innovative price projection indicator for MetaTrader 5, designed to transform your technical analysis by intelligently identifying and projecting historical price patterns. Built upon an advanced correlation algorithm and the fractal principles of the market, this powerful tool visualizes potential future price movements, giving you a unique edge in your trading decisions. What is Chronos Fractal Engine? At its core, the Chronos Fractal Engine employs a sophisticat
이 지표를 구매하면 제 프로페셔널 트레이드 매니저를 무료로 드립니다. 우선 이 거래 시스템이 리페인팅, 리드로잉 및 레이그 인디케이터가 아니라는 점을 강조하는 것이 중요합니다. 이는 수동 및 로봇 거래 모두에 이상적인 것으로 만듭니다. 온라인 강좌, 설명서 및 프리셋 다운로드. "스마트 트렌드 트레이딩 시스템 MT5"은 새로운 및 경험이 풍부한 트레이더를 위해 맞춤형으로 제작된 종합적인 거래 솔루션입니다. 10개 이상의 프리미엄 인디케이터를 결합하고 7개 이상의 견고한 거래 전략을 특징으로 하여 다양한 시장 조건에 대한 다목적 선택이 가능합니다. 트렌드 추종 전략: 효과적인 트렌드 추이를 타기 위한 정확한 진입 및 손절 관리를 제공합니다. 반전 전략: 잠재적인 트렌드 반전을 식별하여 트레이더가 범위 시장을 활용할 수 있게 합니다. 스캘핑 전략: 빠르고 정확한 데이 트레이딩 및 단기 거래를 위해 설계되었습니다. 안정성: 모든 인디케이터가 리페인팅, 리드로잉 및 레이그가 아니므로 신뢰
Trend Screener Pro MT5
STE S.S.COMPANY
4.85 (104)
트렌드 표시기, 트렌드 트레이딩 및 필터링을 위한 획기적인 고유 솔루션, 하나의 도구 안에 내장된 모든 중요한 트렌드 기능! Forex, 상품, 암호 화폐, 지수 및 주식과 같은 모든 기호/도구에 사용할 수 있는 100% 다시 칠하지 않는 다중 시간 프레임 및 다중 통화 표시기입니다. Trend Screener는 차트에 점이 있는 화살표 추세 신호를 제공하는 효율적인 지표 추세 추종 지표입니다. 추세 분석기 표시기에서 사용할 수 있는 기능: 1. 트렌드 스캐너. 2. 최대 이익 분석이 있는 추세선. 3. 추세 통화 강도 측정기. 4. 경고가 있는 추세 반전 점. 5. 경고가 있는 강력한 추세 점. 6. 추세 화살표 Trend Screener Indicator가 있는 일일 분석 예, 일일 신호 성능...등은 여기에서 찾을 수 있습니다. 여기를 클릭하십시오. LIMITED TIME OFFER : Trend Screener Indicator는 50$ 및 평생 동안만 사용할 수 있습니다.
Meridian Pro
Ottaviano De Cicco
5 (1)
Meridian Pro: Professional Multi-Timeframe Trend Matrix for MT5 Overview Meridian Pro is a multi-timeframe trend matrix by Merkava Labs that compresses directional state, strength, momentum condition and matrix agreement into one compact panel. One adaptive engine, applied consistently from M1 to W1. No per-symbol tuning. No indicator stacking. One structured readout across every asset and every timeframe. Launch Offer — Get Meridian Pro for USD 99 (introductory). Regular price: USD 149. 1. Why
Quantum TrendPulse
Bogdan Ion Puscasu
5 (22)
SuperTrend   ,   RSI   ,   Stochastic   의 힘을 하나의 포괄적인 지표로 결합하여 트레이딩 잠재력을 극대화하는 궁극의 트레이딩 도구   인 Quantum TrendPulse를   소개합니다. 정밀성과 효율성을 추구하는 트레이더를 위해 설계된 이 지표는 시장 추세, 모멘텀 변화, 최적의 진입 및 종료 지점을 자신 있게 식별하는 데 도움이 됩니다. 주요 특징: SuperTrend 통합:   주요 시장 추세를 쉽게 따라가고 수익성의 물결을 타세요. RSI 정밀도:   매수 과다 및 매도 과다 수준을 감지하여 시장 반전 시점을 파악하는 데 적합하며 SuperTrend 필터로 사용 가능 확률적 정확도:   변동성이 큰 시장에서 숨겨진 기회를 찾기 위해 확률적 진동   을 활용하고 SuperTrend의 필터로 사용 다중 시간대 분석:   M5부터 H1 또는 H4까지 다양한 시간대에 걸쳐 시장을 최신 상태로 유지하세요. 맞춤형 알림:   맞춤형 거래 조건이 충족되면
Btmm state engine pro
Garry James Goodchild
5 (3)
BTMM State Engine Pro is a MetaTrader 5 indicator for traders who use the Beat The Market Maker approach: Asian session context, kill zone timing, level progression, peak formation detection, and a multi-pair scanner from a single chart. It combines cycle state logic with a built-in scanner dashboard so you do not need the same tool on many charts at once. What it does Draws the Asian session range; session times can follow broker server offset or be set in inputs. Tracks level progression (L
FX Trend MT5 NG
Daniel Stein
5 (4)
FX Trend NG: 차세대 멀티 마켓 트렌드 인텔리전스 개요 FX Trend NG 는 다중 시간 프레임 기반의 전문 트렌드 분석 및 시장 모니터링 도구입니다. 몇 초 만에 전체 시장 구조를 파악할 수 있도록 설계되었습니다. 여러 차트를 일일이 전환할 필요 없이, 어떤 종목이 추세에 있는지, 어디에서 모멘텀이 약화되고 있는지, 그리고 어떤 시간 프레임이 서로 정렬되어 있는지 즉시 확인할 수 있습니다. 출시 기념 특별 혜택 – FX Trend NG 를 $30 (6개월) 또는 $80 평생 라이선스 로 이용할 수 있습니다. 이미 Stein Investments 고객이신가요? -> 메시지를 보내 전용 고객 그룹에 참여하세요. 설정이나 사용 방법이 필요하신가요? -> Stein Investments 공식 페이지 를 방문하세요. 1. FX Trend NG가 특별한 이유 3단계 추세 로직 – 단순한 Buy / Sell이 아닙니다 • 대부분의 지표는 Buy 또는 Sell 두 가지 상태만 제
Gann Made Easy MT5
Oleg Rodin
5 (2)
Gann Made Easy 는 mr.의 이론을 사용하여 최고의 거래 원칙을 기반으로 하는 전문적이고 사용하기 쉬운 Forex 거래 시스템입니다. W.D. 간. 이 표시기는 Stop Loss 및 Take Profit Levels를 포함하여 정확한 BUY 및 SELL 신호를 제공합니다. PUSH 알림을 사용하여 이동 중에도 거래할 수 있습니다. 구매 후 거래 방법 안내 및 유용한 추가 지표를 무료로 받으시려면 저에게 연락주세요! 아마도 Gann 거래 방법에 대해 이미 여러 번 들었을 것입니다. 일반적으로 Gann의 이론은 초보자 거래자뿐만 아니라 이미 거래 경험이 있는 사람들에게도 매우 복잡한 것입니다. Gann의 거래 방식은 이론적으로 적용하기 쉽지 않기 때문입니다. 나는 그 지식을 연마하고 Forex 지표에 최고의 원칙을 적용하기 위해 몇 년을 보냈습니다. 표시기는 적용하기가 매우 쉽습니다. 차트에 첨부하고 간단한 거래 권장 사항을 따르기만 하면 됩니다. 지표는 지속적으로 시장 분석
ARICoins
Temirlan Kdyrkhan
ARICoin is a powerful trading companion designed to generate high-probability entry signals with dynamic TP/SL/DP levels based on volatility. Built-in performance tracking shows win/loss stats, PP1/PP2 hits, and success rates all updated live. Key Features: Buy/Sell signals with adaptive volatility bands Real-time TP/SL/DP levels based on ATR Built-in MA Filter with optional ATR/StdDev volatility Performance stats panel (Success, Profit/Loss, PP1/PP2) Alerts via popup, sound, push, or email Cust
Trend indicator AI mt5
Ramil Minniakhmetov
5 (16)
트렌드 인공 지능 지표는 실행 가능한 진입 점 및 반전 경고와 추세 식별을 결합하여 상인의 시장 분석을 향상시킬 훌륭한 도구입니다. 이 표시기는 사용자가 자신감과 정밀도로 외환 시장의 복잡성을 탐색 할 수 있도록 지원합니다 기본 신호 외에도 트렌드 인공 지능 지표는 풀백 또는 되돌림 중에 발생하는 2 차 진입 점을 식별하여 거래자가 기존 트렌드 내에서 가격 수정을 활용할 수 있도록합니다. 중요한 장점: ·작동 4 및 5 *명확한 구매 또는 판매 신호 *다시 칠하지 않습니다 *모든 자산에서 작동 나는 전보 사기에 개 또는 세트를 판매하지 않도록주의. 모든 설정은 블로그에 여기에 무료.  중요! 지침 및 보너스를 얻기 위해 구입 후 즉시 저에게 연락! 진짜 가동 감시는 뿐 아니라 나의 다른 제품 여기에서 찾아낼 수 있습니다: https://www.mql5.com/en/users/mechanic/seller&nbsp ; 설정 및 입력: 모든 자산에 대해 기본 설정을 권
Power Bar MT5
Daniel Stein
실제 자금을 투입하기 전에 어떤 전략이 내 심볼에서 효과적인지 확인하세요. Power Bar는 모든 심볼과 모든 타임프레임에서 극단적인 가격 바 를 감지한 다음, 3가지 다른 트레이딩 전략을 즉시 백테스트하여 승률, 수익 팩터, 손익을 나란히 비교할 수 있습니다. 모든 것이 하나의 인터랙티브 패널에 담겨 있습니다. 추측 없음. 커브 피팅 없음. 오직 데이터뿐입니다. Power Bar가 특별한 이유 대부분의 인디케이터는 신호를 주고 그것이 효과가 있는지는 추측에 맡깁니다. Power Bar는 한 걸음 더 나아갑니다 - 모든 신호를 세 가지 전략 에 대해 테스트하고 통계를 보여줍니다. FlipFlop, Momentum, Reversal을 원클릭으로 전환하고 숫자가 즉시 변하는 것을 확인하세요. FlipFlop - 항상 포지션 유지. 신호에 진입하고, 반대 신호에 청산. 당사의 연구에 따르면 US30, US500, DAX와 같은 추세가 있는 지수에서 가장 효과적입니다. Momentum
Atomic Analyst MT5
Issam Kassas
3.94 (31)
우선적으로 언급할 점은이 거래 지표가 다시 그리지 않고 지연되지 않으며 이를 통해 수동 및 로봇 거래 모두에 이상적이라는 점입니다. 사용자 매뉴얼: 설정, 입력 및 전략. Atomic Analyst는 가격의 강도와 모멘텀을 활용하여 시장에서 더 나은 이점을 찾는 PA Price Action Indicator입니다. 고급 필터를 장착하여 잡음과 거짓 신호를 제거하고 거래 잠재력을 높이는 데 도움이 됩니다. 복잡한 지표의 다중 레이어를 사용하여 Atomic Analyst는 차트를 스캔하고 복잡한 수학적 계산을 간단한 신호와 색상으로 변환하여 초보 트레이더가 이해하고 일관된 거래 결정을 내릴 수 있도록합니다. "Atomic Analyst"는 새로운 및 경험이 풍부한 트레이더를위한 종합적인 거래 솔루션입니다. 프리미엄 지표와 최고 수준의 기능을 하나의 거래 전략에 결합하여 모든 종류의 트레이더에 대한 다재다능한 선택지가되었습니다. 인트라데이 거래 및 스캘핑 전략 : 빠르고 정확한 일일
우선적으로, 이 거래 도구는 전문적인 거래에 이상적인 비-다시 그리기 및 지연되지 않는 지표입니다.  온라인 강좌, 사용자 매뉴얼 및 데모. 스마트 가격 액션 컨셉트 인디케이터는 신규 및 경험 많은 트레이더 모두에게 매우 강력한 도구입니다. Inner Circle Trader Analysis 및 Smart Money Concepts Trading Strategies와 같은 고급 거래 아이디어를 결합하여 20가지 이상의 유용한 지표를 하나로 결합합니다. 이 인디케이터는 스마트 머니 컨셉트에 중점을 두어 대형 기관의 거래 방식을 제공하고 이동을 예측하는 데 도움을 줍니다.  특히 유동성 분석에 뛰어나 기관이 어떻게 거래하는지 이해하는 데 도움을 줍니다. 시장 트렌드를 예측하고 가격 변동을 신중하게 분석하는 데 탁월합니다. 귀하의 거래를 기관 전략에 맞추어 시장의 동향에 대해 더 정확한 예측을 할 수 있습니다. 이 인디케이터는 시장 구조를 분석하고 중요한 주문 블록을 식별하고 다양
Crystal Heikin Ashi Signals
Muhammad Jawad Shabir
5 (2)
Crystal Heikin Ashi Signals - Professional Trend & Signal Detection Indicator Advanced Heikin Ashi Visualization with Intelligent Signal System for Manual & Automated Trading Final Price: $149 ---------> Price goes up $10 after every 10 sales . Limited slots available — act fast . Overview Crystal Heikin Ashi Signals is a professional-grade MetaTrader 5 indicator that combines pure Heikin Ashi candle visualization with an advanced momentum-shift detection system. Designed for both manual traders
FX Power MT5 NG
Daniel Stein
5 (31)
FX Power: 통화 강세 분석으로 더 스마트한 거래 결정을 개요 FX Power 는 어떤 시장 상황에서도 주요 통화와 금의 실제 강세를 이해하기 위한 필수 도구입니다. 강한 통화를 매수하고 약한 통화를 매도함으로써 FX Power 는 거래 결정을 단순화하고 높은 확률의 기회를 발견합니다. 트렌드를 따르거나 극단적인 델타 값을 사용해 반전을 예측하고자 한다면, 이 도구는 귀하의 거래 스타일에 완벽히 적응합니다. 단순히 거래하지 말고, FX Power 로 더 스마트하게 거래하세요. 1. FX Power가 거래자에게 매우 유용한 이유 통화와 금의 실시간 강세 분석 • FX Power 는 주요 통화와 금의 상대적 강세를 계산하고 표시하여 시장 역학에 대한 명확한 통찰력을 제공합니다. • 어떤 자산이 앞서고 있고 어떤 자산이 뒤처지는지 모니터링하여 보다 현명한 거래 결정을 내릴 수 있습니다. 포괄적인 멀티 타임프레임 뷰 • 단기, 중기 및 장기 타임프레임에서 통화와 금의 강세를
Auto Optimized Parabolic RSI: 고급 3D 모멘텀 엔진 대부분의 개인 투자자용 보조지표는 시장의 변동성이 변하는 순간 무용지물이 되는 정적인 입력값에 의존하기 때문에 실패합니다. Auto Optimized Parabolic RSI는 자체적인 수학적 우위를 지속적으로 재계산하여 "보조지표 노후화" 문제를 해결하며, 기관급 퀀트 트레이딩의 적응력을 귀하의 MT5 터미널에 직접 제공합니다. 핵심 이점: 맞춤형 인메모리 3D 최적화 표준 자동 최적화 도구들은 일반적인 보조지표 호출로 터미널에 과부하를 일으켜 MT5 플랫폼을 멈추게 하는 경우가 많습니다. 이 도구는 이러한 병목 현상을 완전히 우회합니다. 맞춤형 네이티브 RAM 기반 계산기로 구축된 내부 엔진은 차트를 로드하거나 타임프레임을 변경할 때마다 빛처럼 빠른 3D 그리드 검색을 실행합니다. RSI 기간(주기), SAR 스텝(가속도) 및 SAR 최대치(속도 제한)를 동시에 스캔하여 플랫폼 지연 없이 수만 개의 파라
Bill Williams Advanced
Siarhei Vashchylka
5 (11)
Bill Williams Advanced is designed for automatic chart analysis using Bill Williams' "Profitunity" system. The indicator analyzes four timeframes at once. Manual (Be sure to read before purchasing) Advantages 1. Analyzes the chart using Bill Williams' "Profitunity" system. Signals are displayed in a table in the corner of the screen and on the price chart. 2. Finds all known AO and AC signals, as well as zone signals. Equipped with a trend filter based on the Alligator. 3. Finds "Divergence Bar
Weltrade Spike Sentinel
Batsirayi L Marango
5 (1)
Introducing Indicator for PainX and GainX Indices Traders on Weltrade Get ready to experience the power of trading with our indicator, specifically designed for Weltrade   broker's PainX and GainX Indices.  Advanced Strategies for Unbeatable Insights Our indicator employs sophisticated strategies to analyze market trends, pinpointing optimal entry and exit points.  Optimized for Maximum Performance To ensure optimal results, our indicator is carefully calibrated for 5-minute timeframe charts on
RelicusRoad Pro MT5
Relicus LLC
5 (24)
RelicusRoad Pro: 퀀트 시장 운영 체제 70% 할인 평생 이용권 (한정 시간) - 2,000명 이상의 트레이더와 함께하세요 왜 대부분의 트레이더는 "완벽한" 지표를 가지고도 실패할까요? 진공 상태에서 단일 개념 만으로 거래하기 때문입니다. 문맥 없는 신호는 도박입니다. 지속적인 승리를 위해서는 컨플루언스(중첩) 가 필요합니다. RelicusRoad Pro는 단순한 화살표 지표가 아닙니다. 완전한 퀀트 시장 생태계 입니다. 독점적인 변동성 모델링을 사용하여 가격이 이동하는 "공정 가치 로드"를 매핑하고, 단순 노이즈와 실제 구조적 돌파를 구분합니다. 추측은 그만두세요. 기관급 로드 로직으로 거래를 시작하세요. 핵심 엔진: "Road" 알고리즘 시스템의 중심에는 시장 상황에 실시간으로 적응하는 동적 변동성 채널인 Road Algo 가 있습니다. 세이프 라인(평형) 과 가격이 수학적으로 반전될 가능성이 높은 확장 레벨 을 투영합니다. Simple Road: 일반적인 시장을 위
RFI levels PRO MT5
Roman Podpora
3.67 (3)
이 지표는 추세 반전 지점과 가격 반등 영역을 정확하게 보여줍니다.       주요 투자자들   . 새로운 트렌드가 형성되는 곳을 파악하고 최대한 정확하게 의사결정을 내리며 모든 거래를 완벽하게 통제합니다. TREND LINES PRO   지표와 함께 사용할 때 최대의 잠재력을 발휘합니다.  VERSION MT4 지표가 보여주는 내용: 새로운 추세의 시작 시 활성화되는 반전 구조 및 반전 수준. 최소한의 위험 대비 수익률을 갖는 이익 실현   (TAKE PROFIT)   및   손절매(STOP LOSS)   레벨 표시       RR 1:2   . 지능형 손실 감소 로직이 적용된 손절매 기능. 지정된 지표에서 두 가지 추세 유형에 대한 반전 패턴을 표시합니다. 지표: 트렌드를 따라   트렌드 라인 프로   (글로벌 트렌드 변화) 트렌드 프로   (빠른 트렌드 변화) 간단하고 효과적입니다       스캐너       실시간 추세 (신규). 다중 시간 프레임 도구 필터링. 표시하다  
CGE Trading Suite
Carl Gustav Johan Ekstrom
5 (1)
CGE Trading Suite delivers the analytical edge typically reserved for professional trading desks. The platform integrates a full suite of analytical tools into one seamless workflow: dynamic grid mapping, liquidity behavior analysis, ECM, trend lines, MIDAS, trade cycles, and directional channel projections. Together, these provide a unified view of market structure and momentum. Directional clarity is further enhanced by the capital flow index, which measures currency basket strength to identif
Berma Bands
Muhammad Elbermawi
5 (8)
Berma Bands(BBs) 지표는 시장 동향을 파악하고 이를 활용하려는 트레이더에게 귀중한 도구입니다. 가격과 BBs 간의 관계를 분석함으로써 트레이더는 시장이 추세 단계인지 범위 단계인지를 분별할 수 있습니다. 자세한 내용을 알아보려면 [ Berma Home Blog ]를 방문하세요. 버마 밴드는 세 개의 뚜렷한 선으로 구성되어 있습니다. 어퍼 버마 밴드, 미들 버마 밴드, 로어 버마 밴드입니다. 이 선들은 가격 주위에 그려져 전체 추세에 대한 가격 움직임을 시각적으로 표현합니다. 이 밴드들 사이의 거리는 변동성과 잠재적인 추세 반전에 대한 통찰력을 제공할 수 있습니다. 버마 밴드 라인이 각각에서 분리될 때, 그것은 종종 시장이 횡보 또는 범위 이동 기간에 접어들고 있음을 시사합니다. 이는 명확한 방향 편향이 없음을 나타냅니다. 트레이더는 이러한 기간 동안 추세를 파악하기 어려울 수 있으며 더 명확한 추세가 나타날 때까지 기다릴 수 있습니다. 버마 밴드 라인이 단일 라인으로
ARIPoint
Temirlan Kdyrkhan
ARIPoint is a powerful trading companion designed to generate high-probability entry signals with dynamic TP/SL/DP levels based on volatility. Built-in performance tracking shows win/loss stats, PP1/PP2 hits, and success rates all updated live. Key Features: Buy/Sell signals with adaptive volatility bands Real-time TP/SL/DP levels based on ATR Built-in MA Filter with optional ATR/StdDev volatility Performance stats panel (Success, Profit/Loss, PP1/PP2) Alerts via popup, sound, push, or email Cu
Advanced Supply Demand MT5
Bernhard Schweigert
4.53 (15)
현재 33% 할인! 초보자나 전문 트레이더를 위한 최고의 솔루션! 이 보조지표는 우리가 다수의 독창적 기능과 새로운 공식을 통합한 독특하고 고품질이며 저렴한 거래 도구입니다. 이 업데이트를 통해 이중 시간대를 표시할 수 있습니다. 더 높은 TF를 표시할 수 있을 뿐만 아니라 차트 TF와 더 높은 TF 모두를 표시할 수 있습니다: 중첩 영역 표시. 모든 Supply Demand 트레이더들이 좋아할 것입니다. :) 중요한 정보 공개 Advanced Supply Demand의 잠재력을 극대화하려면 다음을 방문하십시오. https://www.mql5.com/ko/blogs/post/720245   진입 또는 목표의 명확한 트리거 포인트를 정확히 찾아냄으로 해서 거래가 어떻게 개선될지 상상해 보십시오. 새로운 알고리즘을 기반으로 매수자와 매도자 간의 잠재적인 불균형을 훨씬 더 쉽게 분간할 수 있습니다. 왜냐하면 가장 강한 공급영역과 가장 강한 수요 영역과 과거에 어떻게 진행 되었는지를(이전
PZ Trend Trading MT5
PZ TRADING SLU
3.8 (5)
Capture every opportunity: your go-to indicator for profitable trend trading Trend Trading is an indicator designed to profit as much as possible from trends taking place in the market, by timing pullbacks and breakouts. It finds trading opportunities by analyzing what the price is doing during established trends. [ Installation Guide | Update Guide | Troubleshooting | FAQ | All Products ] Trade financial markets with confidence and efficiency Profit from established trends without getting whip
제작자의 제품 더 보기
ACB Breakout Arrows MT5
KEENBASE SOFTWARE SOLUTIONS
3.5 (2)
ACB Breakout Arrows 지표는 특별한 돌파 패턴을 감지하여 시장에서 중요한 진입 신호를 제공합니다. 이 지표는 차트를 지속적으로 스캔하면서 한 방향으로 움직임이 자리 잡을 때를 포착하여 큰 움직임 직전에 정확한 진입 신호를 제공합니다. 다중 종목 및 다중 시간대 스캐너는 여기에서 확인하세요 - ACB Breakout Arrows MT5용 스캐너 핵심 기능 지표가 자동으로 손절(Stop Loss) 및 익절(Take Profit) 수준을 제공합니다. 모든 시간대의 돌파 신호를 추적하는 MTF 스캐너 대시보드 포함. 데이 트레이더, 스윙 트레이더 및 스캘퍼에게 적합합니다. 신호 정확도를 높이기 위해 최적화된 알고리즘 사용. 손익분기점 또는 빠른 수익 목표를 위한 특별한 라인 (Quick Profit Line) 제공. 승률, 성공 비율, 평균 수익 등의 성과 분석 지표 제공. 재도색 없음. 신호는 고정되어 신뢰할 수 있습니다. 거래 확인 - ACB Trade Filter 지
KT Heiken Ashi Smoothed MT4
KEENBASE SOFTWARE SOLUTIONS
KT Heiken Ashi Smoothed 는 표준 Heiken Ashi 를 한층 더 부드럽게 처리한 버전으로, 추세 전환 시 매수/매도 화살표도 함께 표시합니다. 복잡한 설정 없이 시장의 핵심 변화를 직관적으로 보여주기 때문에 바쁜 트레이더에게 유용합니다. 상태가 약세에서 강세로 전환되면 매수 화살표가 나타납니다. 상태가 강세에서 약세로 전환되면 매도 화살표가 나타납니다. 모바일 알림, 이메일, 소리, 팝업 경고를 모두 지원합니다. Heiken Ashi Smoothed 란? 표준 Heiken Ashi 에 존재하는 잡음과 허위 신호를 제거하기 위해 두 개의 이동 평균으로 가격 데이터를 부드럽게 처리합니다. 약간의 지연은 있지만, 스윙 포인트와 새롭게 형성되는 추세를 명확히 드러내며, 평소 시야에 잘 들어오지 않는 가격 변화를 확인할 수 있습니다. 이를 통해 트레이더는 진입·청산 전략과 리스크 관리를 세밀하게 조정할 수 있습니다. 활용 이 지표는 외환, 원자재, 주식 등 다양한
KT Psar Arrows
KEENBASE SOFTWARE SOLUTIONS
KT Psar Arrows는 표준 파라볼릭 SAR 지표를 사용하여 차트에 화살표를 표시합니다. 캔들의 고가가 SAR에 닿을 때 상승 화살표가 표시되고, 캔들의 저가가 SAR에 닿을 때 하락 화살표가 표시됩니다. 신호는 봉이 마감되기를 기다리지 않고 실시간으로 생성됩니다.  특징 Parabolic SAR 지표를 활용한 거래 전략을 실험하고 싶은 트레이더에게 유용한 도구입니다.  시장 반전 포인트를 찾는 데 사용할 수 있습니다. 사용자 정의 PSAR 입력 지원. MT4의 모든 알림 기능을 지원합니다. 주의사항: Parabolic SAR은 후행성 및 엄격한 기계적 지표입니다. 모든 잠재적 거래는 명확히 정의된 규칙에 따라 필터링해야 합니다.     입력 파라미터 PSAR 스텝: 스텝 값을 입력하세요. PSAR 최대값: 최대값을 입력하세요. PSAR 점 표시: PSAR 점을 표시하거나 숨길 수 있습니다. PSAR 점을 표시하지 않아도 화살표는 정상 작동합니다. 나머지 입력 항목은 직관적
Use of support and resistance in systematic trading is very subjective. Every trader has their own idea and way to plotting the support and resistance levels on the chart. KT Support and Resistance indicator take out this ambiguity out of the situation and automatically draws support and resistance levels following an algorithmic approach using a unique multi-timeframe analysis. When launched on the chart, It immediately scan the most significant extreme points across all the available timefra
ACB Trade Filter MT5
KEENBASE SOFTWARE SOLUTIONS
ACB Trade Filter indicator provides a way to filtering out the low probability trading entries in a trading strategy. The indicator uses a sophisticated filtration algorithm based on the market sentiment and trend. The MT4 version of the same indicator is available here ACB Trade Filter MT4 Applications Works great with our indicator ACB Breakout Arrows MT5 Filter out low probability signals from any indicator. Avoid over-trading and minimize the losses. Trade in the direction of market sentime
KT Round Numbers MT5
KEENBASE SOFTWARE SOLUTIONS
KT Round Numbers plots the round number levels which are also commonly known as psychological levels in the Forex world. In the context of Forex trading, round number levels are those levels in which there are two or more zeroes at the end. They are named as 00 levels on the chart. Some traders also consider the halfway points as a valid round number level. They are named as 50 levels on the chart. Use of round number levels in trading Round number levels work as strong support and resistance
KT Momentum Arrows MT5
KEENBASE SOFTWARE SOLUTIONS
5 (2)
KT Momentum Arrows 인디케이터는 순간적인 돌파 신호에 기반한 도구로, 밴드의 이탈 범위와 특정 방향으로 나타나는 변동성을 계산하여 신호를 생성합니다. 이 도구는 가격의 강한 움직임이 시작되는 시점을 빠르게 감지할 수 있도록 설계되었습니다. 가격이 상단 밴드를 상향 돌파하여 마감되면 매수 신호가 생성되며, 하단 밴드를 하향 돌파하여 마감되면 매도 신호가 생성됩니다. 밴드의 이탈과 변동성에 동시에 영향을 주는 '계수' 입력값이 있으며, 이는 거래 종목 및 시간 프레임에 따라 신중하게 분석 및 선택해야 합니다. 주요 특징 재도색 없음! 모멘텀 트레이더를 위한 훌륭한 진입 도구입니다. 승률, 손익비, 평균 수익 등 성과 분석 기능 포함. 단타, 스윙, 스캘핑 모든 스타일에 적합합니다. 입력 파라미터 히스토리 바:  지표 계산에 사용할 바의 수. 모멘텀 계수:  밴드 이탈 및 변동성 측정에 사용하는 계수. 성과 분석:  수익 추세선을 포함한 성과 분석 표시 여부.  알림
KT Asian Breakout
KEENBASE SOFTWARE SOLUTIONS
4 (1)
KT Asian Breakout carefully analyzes the range-bound market during the Asian session and then fires a long or short trade after doing some preassessment based on its inbuilt technical analysis module. The executed orders are closed within a day before the completion of the next day session. The inbuilt technical analysis module checks for the session range and compares it with the last 20 days price movement. If it finds any erratic price movement within the session, the orders are not executed
KT RSI Divergence Robot MT4
KEENBASE SOFTWARE SOLUTIONS
KT RSI Divergence robot은 가격과 RSI(Relative Strength Index) 오실레이터 사이에 형성되는 일반 및 숨겨진 다이버전스를 거래하는 100% 자동화된 전문가용 어드바이저입니다. 다이버전스 신호는 무료로 제공되는 RSI Divergence 지표에서 가져옵니다. 모든 다이버전스가 성공적인 가격 반전을 보장하는 것은 아닙니다. 따라서 이 EA는 원시 다이버전스 신호에 내장된 기술적 분석 모듈을 결합하여, 선택된 일부 다이버전스 이후 나타나는 가격 비효율성을 공략합니다. 권장 사항 Pairs:   EURUSD, EURCAD, EURCHF, EURJPY, GBPJPY,USDCHF, USDJPY, XAUUSD Time-Frame:   1시간 Account Type:   제한 없음 Leverage:    1:100 R isk:   거래당 1% 특징 RSI 다이버전스 신호를 자동으로 거래하며, 수동 거래로는 구현이 거의 불가능한 다양한 고급 기능을 제공합
KT CCI Divergence MT5
KEENBASE SOFTWARE SOLUTIONS
KT CCI Divergence shows the regular and hidden divergence created between the price and CCI oscillator. Divergence is one of the vital signals that depicts the upcoming price reversal in the market. Manually spotting the divergence between price and CCI can be a hectic and ambiguous task. Limitations of KT CCI Divergence   Using the CCI divergence as a standalone entry signal can be risky. Every divergence can't be interpreted as a strong reversal signal. For better results, try to combine it w
ACB Breakout Arrows
KEENBASE SOFTWARE SOLUTIONS
4.15 (34)
ACB Breakout Arrows 지표는 특별한 돌파 패턴을 감지하여 시장에서 매우 중요한 진입 신호를 제공합니다. 이 지표는 차트를 지속적으로 스캔하며 한 방향으로 안정적인 모멘텀이 형성되는지를 확인하고, 주요 움직임 직전에 정확한 진입 신호를 제공합니다.  다중 심볼 및 다중 타임프레임 스캐너 받기 – ACB Breakout Arrows MT4용 스캐너 주요 기능 지표가 자동으로 손절(Stop Loss) 및 이익실현(Take Profit) 레벨을 제공합니다. 모든 시간대의 돌파 신호를 추적하는 MTF 스캐너 대시보드가 포함되어 있습니다. 단타 트레이더, 스윙 트레이더, 스캘퍼에게 적합합니다. 정확도를 높이기 위한 최적화된 알고리즘 사용. 손익분기(Breakeven) 또는 단기 목표를 위한 특수 라인(퀵 프로핏 라인) 제공. 승률, 성공률, 평균 수익 등과 같은 성과 분석 지표 제공. 리페인트 없음 – 한번 생성된 신호는 사라지지 않습니다. 거래 확인 -  신뢰도 낮은 신호를
ACB Trade Filter MT4
KEENBASE SOFTWARE SOLUTIONS
5 (1)
The ACB Trade Filter indicator provides a solution for filtering out the low probability trading setups in a trading strategy. The indicator uses a sophisticated filtration algorithm based on the market sentiment and trend. Applications Works great with our indicator " ACB Breakout Arrows ". Filter out low probability signals from any indicator. Avoid overtrading and minimize the losses. Trade in the direction of market sentiment and trend. Avoid the choppiness in the market. How to use Only L
KT Momentum Arrows
KEENBASE SOFTWARE SOLUTIONS
KT Momentum Arrows 인디케이터는 순간적인 돌파 신호에 기반한 도구로, 밴드의 이탈 범위와 특정 방향으로 나타나는 변동성을 계산하여 신호를 생성합니다. 이 도구는 가격의 강한 움직임이 시작되는 시점을 빠르게 감지할 수 있도록 설계되었습니다. 가격이 상단 밴드를 상향 돌파하여 마감되면 매수 신호가 생성되며, 하단 밴드를 하향 돌파하여 마감되면 매도 신호가 생성됩니다. 밴드의 이탈과 변동성에 동시에 영향을 주는 '계수' 입력값이 있으며, 이는 거래 종목 및 시간 프레임에 따라 신중하게 분석 및 선택해야 합니다. 주요 특징 재도색 없음! 모멘텀 트레이더를 위한 훌륭한 진입 도구입니다. 승률, 손익비, 평균 수익 등 성과 분석 기능 포함. 단타, 스윙, 스캘핑 모든 스타일에 적합합니다. 입력 파라미터 히스토리 바:  지표 계산에 사용할 바의 수. 모멘텀 계수:  밴드 이탈 및 변동성 측정에 사용하는 계수. 성과 분석:  수익 추세선을 포함한 성과 분석 표시 여부.  알림
KT COG Advanced MT4
KEENBASE SOFTWARE SOLUTIONS
1 (1)
KT COG is an advanced implementation of the center of gravity indicator presented by John F. Ehlers in the May 2002 edition of Technical Analysis of Stocks & Commodities magazine. It's a leading indicator which can be used to identify the potential reversal points with the minimum lag. The COG oscillator catches the price swings quite effectively. MT5 version of the same indicator is available here KT COG Advanced MT5 Calculation of COG The COG indicator is consist of the two lines. The main l
KT Pin Bar
KEENBASE SOFTWARE SOLUTIONS
KT Pin Bar identifies the pin bar formation which is a type of price action pattern which depicts a sign of reversal or rejection of the trend. When combined with support and resistance, BRN and other significant levels, Pin Bar pattern proved to be a very strong sign of reversal. Basically, a pin bar is characterized by a small body relative to the bar length which is closed either in upper or lower 50% part of its length. They have very large wicks and small candle body. A pin bar candlestic
KT Trend Magic
KEENBASE SOFTWARE SOLUTIONS
KT Trend Magic shows the trend depiction on chart using the combination of market momentum and volatility. A smoothing coefficient is used to smooth out the noise from the signal.It can be used to find out the new entries or confirm the trades produced by other EA/Indicators. Usage Drag n drop MTF scanner which scans for the new signals across multiple time-frames. Find new entries in the trend direction. Improve the accuracy of other indicators when used in conjunction. Can be used as a dynami
KT Auto Fibo
KEENBASE SOFTWARE SOLUTIONS
KT Auto Fibo는 현재 추세 방향에 따라 피보나치 되돌림 레벨을 자동으로 그립니다. 고점과 저점은 차트에 표시된 최대값과 최소값을 사용하여 자동으로 선택됩니다. 사용자는 차트를 확대/축소하거나 스크롤하여 피보나치 레벨을 적절히 조정할 수 있습니다. 모드 자동:  차트 영역을 기반으로 피보나치 레벨을 자동으로 그립니다. 수동: 피보나치 레벨을 한 번만 그리고, 이후에는 앵커 포인트를 수동으로 조정할 수 있습니다. 사용 방법: 미래 수익 목표를 논리적으로 예측하는 데 도움이 됩니다. 지지/저항선이나 추세선과 결합하면 강력한 반전 가능성을 제공합니다. 추세 시장에서 저위험 진입 기회를 제공합니다. 입력 매개변수 자동:  사람의 개입 없이 피보나치 되돌림 레벨을 자동으로 그립니다. 수동:  피보나치 되돌림 레벨을 한 번만 그리고, 이후에는 앵커 포인트를 직접 늘릴 수 있습니다. 미되돌림 영역 표시: 가격 되돌림이 아직 닿지 않은 차트 영역을 표시하거나 숨깁니다. 나머지 입력 항
KT Ichimoku Trader
KEENBASE SOFTWARE SOLUTIONS
1 (1)
KT Ichimoku Trader is a fully automated expert advisor that offers five popular trading strategies based on the Ichimoku indicator. Each strategy has it's own entry and exit method without any interference to other strategies. The Ichimoku system can be applied to all major currency pairs and metals. However, we found that it performs reasonably well mainly on two pairs.   MT5 Version is available here  https://www.mql5.com/en/market/product/35043 Features Trade up to 5 famous trading strategi
KT Volatility Oscillator
KEENBASE SOFTWARE SOLUTIONS
KT 변동성 오실레이터는 과거와 현재의 시장 데이터를 수학적 공식으로 분석하여 오실레이터 형태로 결과를 표시합니다. 증가하는 파동과 감소하는 파동은 각각 자산의 높은 변동성과 낮은 변동성을 나타냅니다.  간단히 말해, 변동성은 일정 기간 동안 자산 가격이 얼마나 변동했는지를 측정하는 지표입니다. 변동성이 없다면 시장의 움직임이 거의 없을 것이고, 트레이더들은 가격 변동을 통해 수익을 얻을 수 없을 것입니다. 외환 시장에서 변동성 활용 외환 시장에서 변동성을 적절히 활용하면 보다 효과적으로 거래할 수 있으며, 기대치를 현실에 맞춰 조정하는 데 도움이 됩니다.  높은 변동성 추세 기반 시스템은 변동성이 높은 시장에서 큰 스윙과 더 긴 포지션 보유 기간 덕분에 매우 잘 작동합니다. 고변동성 구간에서 발생하는 돌파는 더 많은 핍스를 획득할 수 있는 기회를 제공합니다. 낮은 변동성 평균 회귀 시스템은 시장이 평균값으로 되돌아가려는 성질이 있기 때문에 낮은 변동성 환경에서 특히 효과적입니다
KT COG Robot
KEENBASE SOFTWARE SOLUTIONS
KT COG Robot is a fully automated Expert Advisor based on the KT COG Indicator . The COG indicator was originally presented by John F. Ehlers in the May 2002 edition of Technical Analysis of Stocks & Commodities magazine. The EA fires a long trade when COG line cross above the signal line and a short trade is fired when the COG line cross below the signal line.  Adaptive Filtration Our adaptive filtration algorithm combines the original COG formula with the major trend direction and market acce
ACB Breakout Arrows EA
KEENBASE SOFTWARE SOLUTIONS
이 EA는 저희의 커스텀 인디케이터인 "ACB Breakout Arrows" 를 기반으로 한 100% 자동화된 전문가용 어드바이저입니다. 양방향으로 자주 발생하는 돌파 패턴을 이용하며, 외부 입력 값인 "Signal Sensitivity"를 통해 진입 신호의 강도를 조절할 수 있습니다. 거래 확인 ACB Breakout Arrows EA는 또 다른 커스텀 인디케이터인 ACB Trade Filter 를 사용하여 거래 진입 조건을 필터링할 수 있는 기능을 제공합니다. 강력한 매수: 위쪽 화살표 + 초록색 히스토그램 + 상승 추세 강력한 매도: 아래쪽 화살표 + 빨간색 히스토그램 + 하락 추세 히스토그램이 회색이고 추세가 횡보일 경우, EA는 거래를 피합니다. EA는 모든 인디케이터와 의존 파일을 백그라운드에서 로드하며, 차트에는 표시되지 않습니다. 주요 기능 오랜 기대 끝에 이제 ACB Breakout Arrows 인디케이터 로 완전 자동 매매가 가능합니다. ACB Trade F
KT London Breakout
KEENBASE SOFTWARE SOLUTIONS
First thirty minutes are essential for a trading session. The early reaction of traders and market players sets a path for the rest of the day. KT London Breakout EA takes advantage of this phenomenon, and after analyzing the first thirty minutes of London session, it places two bidirectional pending orders. One of pending order is eventually canceled after realizing the market direction with certainty. It has been strictly tested and developed for EUR/JPY using 30-Min Time Frame. You can expe
KT Support and Resistance Levels
KEENBASE SOFTWARE SOLUTIONS
Use of support and resistance in systematic trading is very subjective. Every trader has their own idea and way to plotting the support and resistance levels on the chart. KT Support and Resistance indicator take out this ambiguity out of the situation and automatically draws support and resistance levels following an algorithmic approach using a unique multi-timeframe analysis. When launched on the chart, It immediately scan the most significant extreme points across all the available timefra
외환 거래를 한다면, 통화 강도와 통화쌍 상관관계에 대한 상세한 정보를 아는 것은 거래 실력을 한 단계 끌어올리는 데 큰 도움이 됩니다. 상관관계를 분석하면 리스크를 절반으로 줄일 수 있고, 강도 분석을 통해 수익을 극대화할 수 있습니다. 이 지표는 통화 강도 분석과 통화쌍 상관관계를 결합하여 가장 적합한 통화쌍을 선택할 수 있도록 도와주는 하이브리드 접근 방식을 제공합니다. 통화 강도 분석 활용 방법 예를 들어, 당신의 거래 전략이 AUD/JPY 매수 기회를 제공한다고 가정해 봅시다. 하지만 KT 통화 강도 분석을 통해 JPY가 AUD보다 강해지고 있다는 것을 발견했다면, 이 거래는 손실로 끝날 가능성이 높습니다. 이 지표를 사용하면 이러한 손실을 쉽게 피할 수 있습니다. 통화쌍 상관관계 활용 방법 또 다른 예로, 거래 전략이 NZD/USD와 GBP/JPY 두 통화쌍 모두에 대해 매도 기회를 제공한다고 가정해 봅시다. KT 통화쌍 상관관계 분석을 사용하면 이 두 통화쌍 간 상관
MACD Divergence Seeker
KEENBASE SOFTWARE SOLUTIONS
KT MACD Divergence Seeker trades the regular and hidden divergence signals generated by our free indicator named KT MACD Divergence indicator. Trading the standalone divergences can be a risky affair that's why the KT MACD Divergence Seeker combines the standard divergence signals with an advanced analysis module to exploit the price inefficiencies on some FX pairs. What is the Divergence exactly? As a general conception if the price is making higher highs, then macd should also be making hig
KT Asian Breakout Indicator
KEENBASE SOFTWARE SOLUTIONS
KT Asian Breakout 지표는 아시아 세션의 중요한 부분을 분석하여 가격 돌파 방향에 따라 매수 및 매도 신호를 생성합니다. 가격이 세션 최고점을 돌파하면 매수 신호가 발생하며, 가격이 세션 최저점을 돌파하면 매도 신호가 발생합니다. 유의 사항 세션 박스의 높이가 너무 넓다면, 대부분의 가격 움직임이 이미 세션 내에서 발생했기 때문에 새로운 거래를 피하는 것이 좋습니다. 돌파 캔들이 너무 크면, 가격이 신호 방향으로 계속 진행하기 전에 일시적인 되돌림이 발생할 가능성이 높습니다. 기능 매수/매도 신호에 스톱로스 및 목표 이익 수준이 포함됩니다. KT Asian Breakout 지표는 첫 번째, 두 번째 또는 세 번째 목표 이익을 기준으로 성과를 지속적으로 확인합니다. 승/패 신호 수, 성공률, 신호당 평균 핍스와 같은 세 가지 주요 성과 지표를 표시합니다. 돌파 캔들이 너무 크면 차트에 경고 메시지가 표시됩니다. 추천 설정 시간 프레임: 15분. 통화쌍: 모든 JPY
MACD Divergence MT4
KEENBASE SOFTWARE SOLUTIONS
KT MACD 다이버전스는 가격과 오실레이터 사이에 형성되는 일반 다이버전스와 숨겨진 다이버전스를 보여줍니다. 만약 당신의 거래 전략이 추세 반전을 예측한다면, MACD의 일반 다이버전스를 활용하여 잠재적인 전환 지점을 예측할 수 있습니다. 추세 지속을 기반으로 하는 전략이라면 MACD의 숨겨진 다이버전스가 적합합니다. KT MACD 다이버전스의 한계 MACD 다이버전스를 단독 진입 신호로 사용하는 것은 위험할 수 있습니다. 모든 다이버전스가 반전 신호로 해석될 수는 없습니다. 더 나은 결과를 얻으려면 가격 행동 및 기타 분석 기법과 함께 사용하는 것이 좋습니다. 기능 소개 가격과 오실레이터 간의 일반 및 숨겨진 다이버전스를 표시합니다. 비대칭 다이버전스는 정확도를 높이고 혼란을 줄이기 위해 제거됩니다. 추세 반전 및 추세 지속 전략 모두에 사용할 수 있습니다. EA(Expert Advisor)에 완벽하게 통합 가능합니다. 진입뿐만 아니라 청산 시점에도 활용할 수 있습니다. 모든
KT Bollinger Bands Trader MT4
KEENBASE SOFTWARE SOLUTIONS
KT Bollinger Bands Trader는 100% 자동화된 전문가용 어드바이저(EA)로, 낮은 변동성 구간에서 볼린저 밴드를 활용한 평균 회귀 전략을 기반으로 작동합니다. 가격은 종종 볼린저 밴드의 상단 또는 하단 라인에서 반응하지만, 항상 반전이 일어나는 것은 아닙니다. 하지만 낮은 변동성일수록 반전 가능성은 더 높아집니다. 진입 조건 가격이 볼린저 밴드의 하단선 아래에 정확히 위치할 경우 매수 포지션이 실행됩니다. 가격이 볼린저 밴드의 상단선 위에 정확히 위치할 경우 매도 포지션이 실행됩니다. 청산 조건 낮은 변동성 구간이 종료되면 기존 포지션이 자동으로 종료됩니다. 또는 지정된 손절선(Stop Loss)이나 이익 실현선(Take Profit)에 도달하면 종료됩니다. 이 EA는 널리 알려진 볼린저 밴드 전략에 기반하면서도, 트렌드 필터, 변동성 필터, Vortex, MMI, 요일 필터 등 다양한 고급 필터 기능을 내장하여 전략을 세밀하게 조정할 수 있는 유연함을 제공합니
KT CCI Divergence MT4
KEENBASE SOFTWARE SOLUTIONS
KT CCI Divergence shows the regular and hidden divergence created between the price and CCI oscillator. Divergence is one of the vital signals that depicts the upcoming price reversal in the market. Manually spotting the divergence between price and CCI can be a hectic and ambiguous task. Limitations of KT CCI Divergence   Using the CCI divergence as a standalone entry signal can be risky. Every divergence can't be interpreted as a strong reversal signal. For better results, try to combine it w
KT MA Crossover MT4
KEENBASE SOFTWARE SOLUTIONS
KT MA Crossover는 사용자가 선택한 이동 평균선의 교차를 기반으로 매수 및 매도 화살표를 차트에 표시합니다. 또한 각 연속적인 신호에 대해 적절한 알림을 생성하며, MFE(최대 유리 변동값)도 함께 표시하여 트레이더가 가능한 최대 이익 범위를 파악할 수 있도록 도와줍니다. 이동 평균 교차 전략은 전 세계 트레이더들이 가장 많이 사용하는 기본적인 거래 전략 중 하나입니다. 일반적으로 빠른 이동 평균선과 느린 이동 평균선을 조합하여 교차 방향에 따라 매수 또는 매도 진입 신호를 식별합니다. 매수 신호 – 빠른 MA가 느린 MA를 상향 돌파할 때. 매도 신호 – 빠른 MA가 느린 MA를 하향 돌파할 때. 기능 각 이동 평균의 속성을 자유롭게 설정할 수 있습니다. 각 신호에 대해 MFE 값을 제공합니다. 가볍고 효율적으로 작동하는 인디케이터로 시스템 리소스 사용이 적습니다. MetaTrader의 모든 경고 기능이 포함되어 있습니다. 단점  이동 평균은 과거 데이터를 기반으로
필터:
리뷰 없음
리뷰 답변