Visual Wave Indicator
- 지표
-
AL MOOSAWI ABDULLAH JAFFER BAQER
 To trade successfully we need to go through the proven path that others had gone and reached!
Here are 17 quotes from such successful investors:
1- Limit your size in any position so that fear does not become the prevailing instinct guiding your judgment.
Joe Vidich - 버전: 1.0
- 활성화: 5
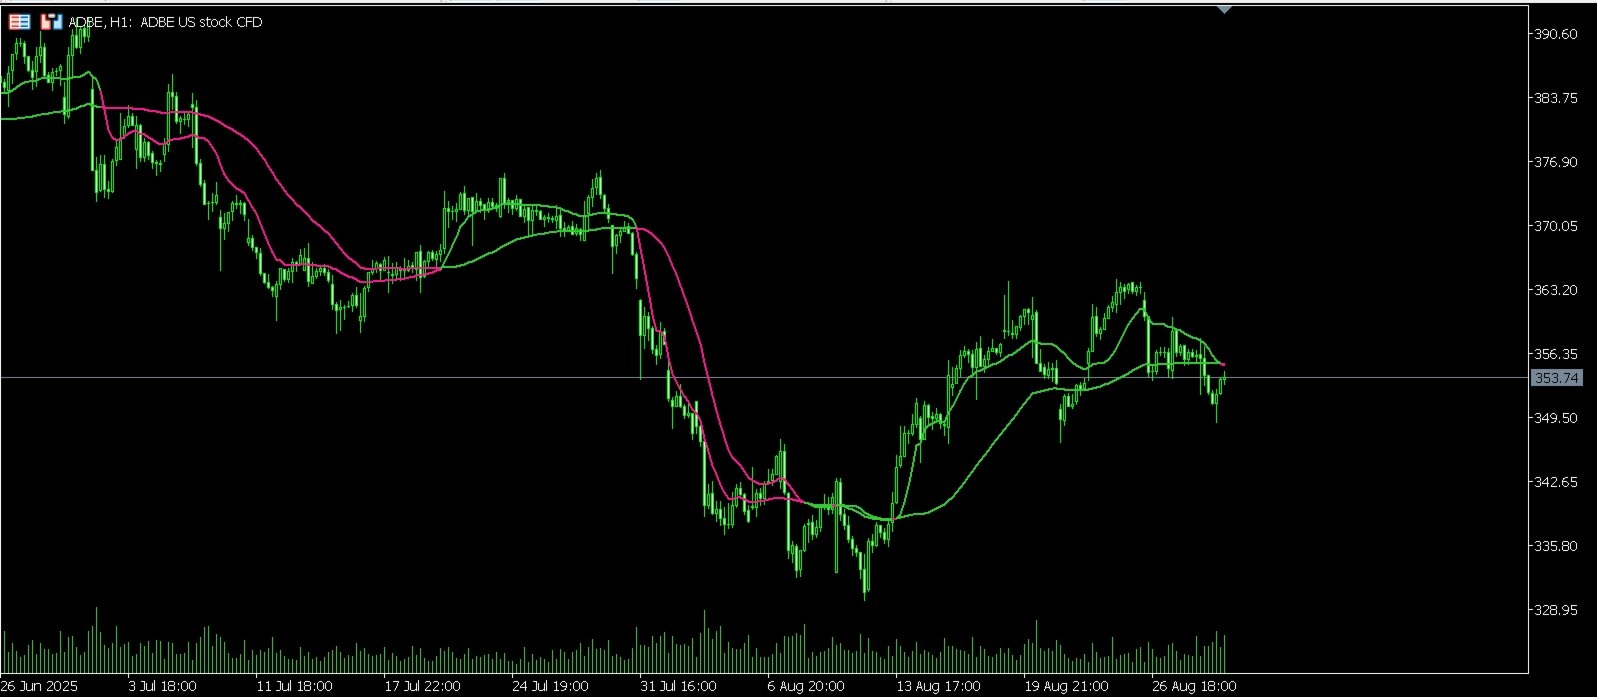
Visual Waves Indicator: Ride the Trend with Clarity
Unlock a smarter way to trade with the Visual Waves Indicator, a sophisticated tool designed to provide clearer, more reliable trend signals on the MetaTrader 4 platform.
Are you tired of the false signals and market noise generated by traditional moving averages? The Visual Waves Indicator is your solution. It moves beyond basic calculations to offer a truly adaptive analysis of market momentum, helping you identify trading opportunities with greater confidence. For a one-time price of just $30, you can elevate your trading strategy.
The Logic Behind the Waves
At the heart of the indicator are two powerful, adaptive lines: the Fast Wave and the Slow Wave. These are not your standard MAs. They are calculated using a proprietary Deviation-Scaled Moving Average (DSMA) algorithm.
Here’s how it works in detail:
-
Volatility Analysis: The indicator first calculates a "filter" based on recent price changes. This initial step measures the market's raw momentum.
-
Advanced Smoothing: This filter is then passed through a complex smoothing formula, which removes insignificant fluctuations and clarifies the underlying price movement.
-
Dynamic Adaptation: The core of the DSMA logic is its ability to adapt. It calculates the root mean square (RMS) of the smoothed data over the specified period. This RMS value represents the true volatility. The indicator uses this volatility measure to dynamically adjust its own sensitivity.
-
In a strong, trending market, the indicator becomes more responsive to price, allowing you to get in early.
-
In a choppy, sideways market, the indicator automatically becomes smoother, filtering out noise and helping you avoid false entries.
-
-
Final Calculation: The result is an exceptionally smooth yet responsive moving average that provides a much cleaner representation of the market trend than traditional tools.
How to Trade with Visual Waves
Trading with the indicator is intuitive and visual, making it suitable for both new and experienced traders.
-
Buy Signal: A potential buying opportunity arises when the Fast Wave crosses above the Slow Wave. To confirm the signal, both lines will change color to Lime Green, and a clear Up Arrow will be plotted below the corresponding candle. This indicates that short-term momentum is accelerating above the long-term trend.
-
Sell Signal: A potential selling opportunity occurs when the Fast Wave crosses below the Slow Wave. The lines will change color to Deep Pink, and a Down Arrow will appear above the candle, signaling that bearish momentum is taking control.
Key Features and Full Customization
The Visual Waves Indicator is designed for flexibility and can be tailored to your specific trading style.
-
Adaptive Waves: The core of the system is the advanced DSMA algorithm that adjusts to market volatility.
-
Clear Visual Signals: Color-coded lines and clear buy/sell arrows remove guesswork from your analysis.
-
Powerful Signal Filter: A unique feature allows you to set a minimum number of bars that must pass between signals ( InpBarsDelay ). This is an incredibly powerful tool to avoid over-trading in ranging or consolidating markets, ensuring you only act on the most significant trend changes.
-
Complete Customization: Adjust wave periods, the price type used for calculations (Close, Open, High, Low, etc.), arrow size, and the offset of the arrows from the price.
-
Detailed Logging: For advanced users, the indicator includes comprehensive logging options to monitor its behavior in the journal or a dedicated file.
Who is this Indicator For?
The Visual Waves Indicator is a versatile tool suitable for:
-
Trend Traders: Identify and follow major market trends with precision.
-
Swing Traders: Pinpoint entry and exit points for medium-term trades.
-
Scalpers: Use on lower timeframes with adjusted settings to catch short-term momentum shifts.
-
Beginners: The simple, visual signals make it easy to learn and apply.
-
Experts: The advanced customization and robust algorithm provide a powerful addition to any complex trading system.
Stop guessing where the trend is headed. Add the Visual Waves Indicator to your chart for just $30 and start trading with clarity and confidence.
Input Parameters
-
Fast Wave Period: Sets the calculation period for the faster, more responsive wave.
-
Slow Wave Period: Sets the calculation period for the slower, baseline trend wave.
-
Wave Price Type: The price used for calculation (e.g., Close, Open, Median Price).
-
Arrow Offset (points): Controls how far the buy/sell arrows are placed from the high/low of the candle.
-
Arrow Size (1-5): Adjusts the visual size of the signal arrows on the chart.
-
Enable bars between signals: Turns the signal filtering feature on or off.
-
Bars to wait between signals: The minimum number of bars that must pass before a new signal can be generated.
-
Show detailed logs in journal: Enables/disables logging.
-
Log to file instead of terminal: Switches logging output from the terminal to a file.
-
Log file name prefix: Sets the name for the log file.
-
Maximum log file size in MB: Manages the size of the log file to save disk space.