MetaTrader 5용 Expert Advisor 및 지표 - 22

The Volume Delta Indicator is a technical analysis tool that combines volume analysis with price action to identify potential trading opportunities. This indicator analyzes the difference between buying and selling pressure through candle structure analysis. Key Features Volume Delta Calculation : Measures buy/sell volume difference using candle structure analysis EMA Smoothing : Applies exponential moving average to smooth volume data Breakout Detection : Identifies price breakouts with volume
FREE

Common SL & TP EA – Manage All Positions with Shared Stop Loss and Take Profit A simple and effective tool that allows you to manage all open positions on the same symbol with one common Stop Loss (SL) line and one common Take Profit (TP) line . The Common SL & TP EA helps traders manage their risk and profit targets more easily by controlling all positions of the same symbol with two shared horizontal lines: Common Stop Loss Line (Red): Drag it on the chart to instantly update the SL of all ope
FREE

The indicator trades during horizontal channel breakthroughs. It searches for prices exceeding extreme points or bouncing back and defines targets using customizable Fibo levels with a sound alert, which can be disabled if necessary. The indicator allows you to create a horizontal channel between the necessary extreme points in visual mode quickly and easily. It automatically applies your selected Fibo levels to these extreme points (if the appropriate option is enabled in the settings). Besides

The Omega Trend Indicator is an advanced tool that has been specifically designed to detect market trends early, and follow them efficiently. The indicator draws two lines. The main (thicker) Trend Line represents the presumed lower or upper volatility limits of the current market trend. A break in the main Trend Line indicates a potential reversal or shift in the movement of the trend. The Trend Line also indicates the best point to place a stop loss order. In Omega Trend Indicator, the Trend L
FREE

Velocity Renko Heatmap is a separate-window indicator that converts standard time-based price series into Renko-style blocks and colors them by momentum speed. Each block represents a fixed Renko box size, while the color intensity reflects how fast the block was formed relative to recent average formation time. Slow movement appears dim/neutral, fast movement becomes more saturated, enabling quick visual assessment of acceleration and deceleration in trend moves. The indicator is designed for t
FREE

Growthamp는 자신만의 진입 조건을 맞춤화하려는 고객을 위해 설계된 그리드 전문가입니다.
전문가는 두 가지 입력 맞춤 이동 평균과 선택적 확률 진동을 사용하여 거래를 시작합니다.
그런 다음 선택한 주문 관리 및 마감 기능을 사용하여 주문을 수익으로 관리합니다.
신호 및 그룹 채팅: https://www.mql5.com/en/users/conorstephenson 주요 특징들
사용자 정의 가능한 항목 및 무역 관리. 36개의 다양한 이동 평균 유형 중에서 선택할 수 있습니다. 추세를 따르거나 이동 평균 교차를 사용하여 입력합니다. 거래를 추가로 필터링하기 위한 선택적 확률론적 입력. 거래를 관리하고 마감하는 다양한 방법. 선택적 마틴게일 모드. 선택적 헤징 논리. 자신만의 전략을 만들고/거래하려는 고객을 위해 설계되었습니다. 넓은 확산 및 미끄러짐 방지. 자산 한도 - Growt
FREE

It is a MetaTrader 5 integrated drawing tool inspired on the "Pointofix" software. You can paint, make annotations and drawings on the chart in real time. It works in multiple timeframes, that is, the drawings can be visualized in different timeframes. The drawings are also saved in files and can be restored even on MetaTrader restarting.
Simple and Pratical
Chart Pen is designed as simple, beautiful and innovative way to create and manage all your chart analysis. There is no existing drawing
FREE
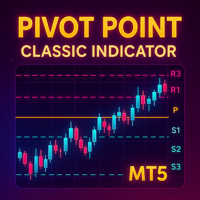
Detailed Description: The Pivot Point Classic Indicator is designed for traders who rely on classic pivot points and midpoints levels for their trading strategies. By automatically calculating and plotting these levels, the indicator provides a clear, visual representation of critical price areas where the market may reverse or break out. Key Features: Automatic Pivot Point Calculations : Automatically calculates pivot points, three support (S1, S2, S3) and resistance (R1, R2, R3) levels bas
FREE

Gilded Edge EA is a fully automated trading expert advisor designed for scalping trading on the XAUUSD (GOLD) instrument. The advisor operates on lower timeframes and uses an algorithm that analyzes short-term price movements and volatility to identify market entry points. The strategy's primary goal is to exploit local impulses while maintaining strict risk management. Key features of the strategy No order grid (optional)
The advisor does not use grid algorithms and does not hold a series of

================================================================================ LUNOX SB-KILLZONE v2.0 - Professional Session Breakout Trading System ================================================================================
OVERVIEW -------- Lunox SB-Killzone is a sophisticated algorithmic trading system designed for professional traders who understand institutional market structure and session- based trading dynamics. The Expert Advisor implements proven session breakout methodologie
FREE

Divergence Matrix SE – 스페셜 에디션
핵심 다이버전스를 정확히 표시하고 가격의 잠재적 반전 포인트를 즉시 파악하세요!
다이버전스 포인트를 자동으로 표시하여 시장 분석을 지원합니다 — 중요한 움직임을 놓치지 마세요. Divergence Matrix SE는 MACD, MACD 히스토그램, Stochastic 의 다이버전스 표시를 유지하며, 가볍고 간소화된 체험판을 제공합니다. 신뢰할 수 있는 신호를 위해 다이버전스는 발생 후 4개의 봉 이후 에 표시되어 시장의 노이즈를 걸러주고 더 안정적인 신호를 제공합니다. SE 버전은 핵심 기능에 집중하도록 설계되어, 원활하게 작동하며 깔끔한 인터페이스를 제공 — 초보자에게 적합하며 전문 트레이더의 빠른 참고용 도구로도 활용 가능합니다. SE 버전을 사용하면: 핵심 다이버전스 포인트를 자동으로 포착, 수동 검색 불필요 각 다이버전스 뒤의 추세 변화를 명확하게 이해 다이버전스 분석을 빠르게 체험하고 자신의 트레이딩 전략과 통합 더
FREE

Volume Footprint Analysis is a precision-engineered, volume-based indicator that transforms raw market volume into an intuitive, color-coded signal system. Built on concepts from Volume Spread Analysis (VSA) and Smart Money principles, this tool removes the guesswork from volume interpretation and gives traders clear, actionable insights on when to buy or sell — on any timeframe and across any trading instrument. MT4 Version - https://www.mql5.com/en/market/product/138564/ Join To Learn Mark

Capture every opportunity: your go-to indicator for profitable trend trading Trend Trading is an indicator designed to profit as much as possible from trends taking place in the market, by timing pullbacks and breakouts. It finds trading opportunities by analyzing what the price is doing during established trends. [ Installation Guide | Update Guide | Troubleshooting | FAQ | All Products ]
Trade financial markets with confidence and efficiency Profit from established trends without getting whip

STRATEGY DETAILS ______________________________________________________________________________________________________________ Indicators used: Wiliams percent range+Moving average+RVI+Awesome Oscilator+Accelerator Oscilator+Alligator+ADX+Demarker Symbol: XAUUSD Timeframe: M5,M15 Recomended: M5 No Dangerous Strategies Take profit: Fixed+Exit indicators(Envelopes+ Candle patterns) Stop loss: Fixed+Exit indicators( Envelopes, +Candle patterns ) Trading frequency: Moderate Posibble to set other m
FREE
Your safety net to turn losing trades into winners
Have you ever taken a trade at literally the worst possible moment? Have you ever bought an asset just before a significant price crash?
Or perhaps you've gone short at the worst possible moment before a rip-off rally? I have. And it sucks. It's one of the worst feelings in the world. Like a kick in the groin. To come out unscathed and in profit from these situations, I developed PZ Hedging EA. This EA will turn your losing trades into winners
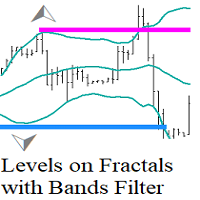
밴드 필터가 있는 프랙탈 레벨은 볼린저 밴드 인디케이터로 필터링된 프랙탈을 기반으로 한 레벨입니다.
볼린저 밴드 필터를 사용한 프랙탈 레벨은 프랙탈과 볼린저 밴드 지표를 조합하여 지지 및 저항 수준을 식별하는 기술 분석 도구입니다.
사용 방법
외부 볼린저 밴드(변동성 돌파) 뒤에 프랙탈이 형성되면 가격이 극한 수준에 도달하여 방향이 바뀔 수 있음을 나타냅니다.
이 레벨은 지지 및 저항 레벨로 사용할 수 있습니다.
프랙탈이 볼린저 밴드 위쪽에 형성되면 저항 레벨이 되고, 아래쪽 밴드 아래에 형성되면 지지 레벨이 될 수 있습니다.
이 지표는 지지 및 저항 수준을 기반으로 전략을 사용하는 트레이더와 시장 가장자리에서 거래하는 것을 선호하는 트레이더에게 유용할 수 있습니다. 지지 및 저항 수준을 만드는 데 사용되는 프랙탈을 더 잘 필터링하기 위해 기간 및 편차와 같은 볼린저 지표 매개 변수를 수정하여 현재 시장 상황에 더 잘 맞추고 더 신뢰할 수 있는 신호를 얻을 수 있습니
FREE

This EA Utility allows you to manage (with advanced filtering) unlimited open orders (manual or EA) with 16 trailing stop methods: fixed, percent, ATR Exit, Chandelier Exit, Moving Average, Candle High Low Exit, Bollinger Bands, Parabolic, Envelope, Fractal, Ichimoku Kijun-Sen, Alligator, Exit After X Minutes or Bars, RSI and Stochastic. The trailing stop can be either real or virtual, and you can exit fully or with a partial close percent on touch or bar close.
Moreover, you can add (override

Ultimate MT5 Auto SL/TP Assistant EA Our MT5 Expert Advisor is designed to automatically apply predefined SL and TP levels to any order you place – Fast, accurate, and fully automated, no manual errors, no delays. Perfect for scalpers, intraday traders, and anyone who values precision and speed. Auto SLTP Auto SL TP this is Utilities Scalper Auto SL TP fast Open Close https://www.mql5.com/en/market/product/158389
FREE
The Trend Line EA adviser trades based on the Trend Line PRO indicator signals in automatic mode. An additional set of functions allows the Trend Line PRO strategy to become break-even with any instrument in MT5: Gold, Forex, Indices, Stocks, Crypto. Big sale 50% OFF! Price $199. Regular price $399 All our signals are now available on myfxbook: click here Unique set files and all recommendations are provided free of charge. All future updates of the adviser are included in the price. After
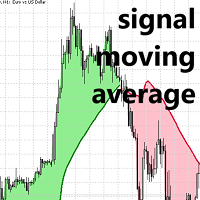
MT5용 신호 이동 평균 Lux 알고리즘
이동 평균 교차 시스템에서 신호선 사용을 위해 특별히 설계된 고유한 이동 평균 지표를 만나보세요. 이 고급 도구는 범위가 좁은 시장에서는 가격에서 벗어나는 반면, 추세가 있는 시장에서는 표준 이동 평균을 면밀히 반영한다는 점에서 차별화됩니다. 이러한 특징은 트레이더가 시장 변동으로 인한 불필요한 노이즈와 잠재적인 과매도를 방지하는 데 도움이 됩니다.
이동 평균은 범위가 좁은 시장에서는 가격에서 벗어나고, 추세가 있는 시장에서는 일반 이동 평균값에 도달합니다.
이동 평균 교차 전략은 일반적인 추세를 파악하는 데 사용되는 느린 이동 평균인 "신호선"에 의존하는 경우가 많습니다. 이 신호선은 빠른 이동 평균과 함께 사용되어 일반 가격과 신호선의 교차에서 발생할 수 있는 휩소 거래를 걸러냅니다.
제안된 지표는 범위가 좁은 기간 동안 가격에서 벗어나지 않으므로 가격과 신호선 사이에 발생하는 교차 횟수를 효과적으로 줄일 수 있습니다.
가격과
FREE
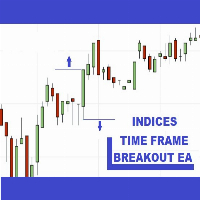
Time Frame Breakout Indices MT5
Apart from many other programs in the MQL5 market this is a REAL and EXCELLENT tool for trading Indices using a breakout strategy. After opening the markets or a t the time of announcing significant economic data, markets often try to find its direction and follow short or long trends. Time Frame Breakout Indices EA is designed to trade these trends using BreakOut strategy. It does not use any martingale or grid functionalities. We use this strategy for many

Real Miner EA is a smart trend detector robot using advanced mathematical and statistical theories. The entry filters have powerful and advanced corrections on the entry points. All trades are powered by TP/SL to control the risk of the account. Also some smart algorithms inserted inside the EA to adjust some settings based on selected symbols and timeframe automatically. So using the EA is easy for all traders. Only some major settings are added to the EA input parameters.
Prop Firm Ready

FOR CRASH 500 ONLY!! MT5
*This is a smooth heiken ashi setup meant to be used on CRASH 500 in combination with other indicators. *You are welcome to test it on other markets aswell. *I will be posting other indicators aswell to help with trading the crash 500 market. *You can use this to help smooth out price if you do struggle with reading the charts as is. * Just note heiken ashi doesnt represent real price action only smoothes it out for ease of read.
FREE
** All Symbols x All Time frames scan just by pressing scanner button ** After 18 years of experience in the markets and programming, Winner indicator is ready. I would like to share with you! *** Contact me to send you " Trend Finder indicator " free, instruction and add you in "M1 Signal Scanner group" for sharing or seeing experiences with other users. Introduction: M1 Signal Scanner is the indicator designed scalping M1 time frame to detect Small trend switching in the direction

Benefits and Usage of the Volume Bubble Tool This tool, (one of my favorites by Algo Alpha, from Tradingview) provides an advanced method of volume analysis by moving beyond traditional histograms. It leverages statistical normalization (Z-score) on lower-timeframe data to identify and classify statistically significant volume events, visualizing the dynamic between "Smart Money" (institutional) and "Retail" participants. Core Benefits Intuitive On-Chart Visualization: By plotting volume as bub

효율적인 수동 거래를 위한 맞춤형 트레이드 패널
이 트레이드 패널은 MT5에서 수동 거래를 위한 도구를 제공하며, 거래 관리를 돕는 다양한 기능을 포함하고 있습니다. 이 패널은 주문 실행, 주문 관리, 포지션 모니터링 기능을 컴팩트한 인터페이스를 통해 제공합니다. 왜 이 트레이드 패널을 선택해야 할까요? 여러 거래를 동시에 관리하거나 거래 과정을 간소화하고 싶다면, 이 맞춤형 트레이드 패널이 포지션을 효율적으로 관리할 수 있도록 필요한 모든 기능을 제공합니다. 리스크를 제어하고 거래 성과를 쉽게 모니터링할 수 있습니다.
핵심 기능 이 패널은 사용자가 다음을 수행할 수 있는 시장 주문 관리 도구를 포함하고 있습니다: 사전에 설정한 스톱로스와 테이크프로핏 기준으로 시장가 주문 실행 지정한 가격 지점에 대기 주문(펜딩 오더) 배치 하나의 인터페이스에서 여러 주문 유형을 관리 현재 포지션과 대기 주문을 모니터링 주문 관리 기능 사용자는 다음과 같은 핵심 거래 관리 기능에 접근할 수 있습
FREE

- Real price is 200$ - 50% Discount (It is 99$ now) - It is enabled for 4 purchases. Contact me for extra bonus (Gann Trend indicator), instruction or any questions! - Non-repaint, No lag - I just sell my products in Elif Kaya Profile, any other websites are stolen old versions, So no any new updates or support. - Lifetime update free Gann Gold EA MT5 Introduction W.D. Gann’s theories in technical analysis have fascinated traders for decades. It offers a unique approach beyond traditional cha

QFT Gold M5 is a XAUUSD levels and trend robot designed for the M5 timeframe. The trading system uses a sophisticated approach, in addition to other indicators to identify high probability levels where entries are to be placed. QFT Gold M5 solves the problem of how to integrate range and trend strategies especially strategies that are based on ranging.
Markets often suffer during strong trends while those based on trending markets will suffer during ranging market periods. QFT Gold M5 is

Weis Wave Scouter Basic은 MetaTrader 5용으로 설계된 당사의 유명한 인디케이터의 기본 버전으로, Wyckoff 방법론과 VSA(Volume Spread Analysis) 개념을 쉽고 효율적으로 탐색하려는 트레이더를 위해 설계되었습니다. 볼륨 파동 읽기를 기반으로 하여 시장 움직임을 명확하게 식별할 수 있으며, Richard Wyckoff가 가르친 노력 대 결과 및 수요 공급 원칙에 중점을 둡니다. Weis Wave Scouter Basic을 사용하면 기본 색상 테마(Classic)로 상승 및 하락 파동을 직관적인 히스토그램으로 시각화할 수 있어 트렌드 및 반전 해석이 쉬워집니다. Brick Size 및 Volume Scale Factor와 같은 기본 조정을 지원하며, 틱 볼륨 또는 실제 볼륨을 사용할 수 있는 옵션을 제공하여 Forex, 주식, 암호화폐 등 다양한 시장에 적합합니다. 초보자나 간단한 도구를 원하는 트레이더에게 완벽한 Weis Wave Sco
FREE

Smart Volume Activity [SVA] is an advanced analytical indicator designed for MetaTrader platforms. It reveals how institutional (Smart Money) and retail traders operate by analyzing volume behavior across multiple timeframes . Unlike ordinary volume tools, SVA automatically adapts to any chart timeframe and highlights zones of absorption — moments when large market participants absorb liquidity from weaker hands. By detecting abnormal volume spikes far beyond typical market noise, it distinguish
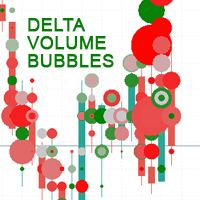
Delta Volume Bubbles is an advanced MetaTrader 5 indicator designed to visually display buy and sell pressure through dynamic, colored bubbles plotted directly on the price chart.
It calculates the net volume delta (difference between buy and sell volume) and represents it as bubbles of different sizes and colors giving traders a clear, intuitive picture of order flow activity. This indicator provides a visual form of order flow analysis , allowing traders to interpret market pressure even with
FREE

Monitoring of real trading Advisor - click here Keep in mind that the results on different brokers will be different, before using it, I recommend testing on your broker. Read the blog post with the description of the adviser before starting work and if you have any additional questions, write to me in the PM. If at your broker Symbol Name have prefix/sufix please chang symbol name at setting!!! A fully automatic Expert Advisor designed for trading on USDCHF/EURUSD/GBPUSD/EURCHF/USDCAD/GB

VISUAL ATR CANDLESTICK SCANNER PRO - 향상된 패턴 인식 Visual ATR Candlestick Scanner Pro는 일반적인 캔들스틱 패턴을 자동으로 식별하고 필터링하도록 설계된 지표로, 잠재적인 시장 반전 또는 지속에 대한 더 명확한 시각을 제공합니다. I. 주요 특징 및 기능 1. 자동화된 캔들스틱 패턴 인식 이 지표는 25가지 이상의 전문 캔들스틱 패턴을 자동으로 인식하며, 명확한 그룹으로 분류됩니다. 강한 상승 그룹 (Strong Bullish Group): 상승 장악형 (Bullish Engulfing), 적삼병 (Three White Soldiers), 샛별형 (Morning Star), 상승 킥커 (Bullish Kicker) 등. 강한 하락 그룹 (Strong Bearish Group): 하락 장악형 (Bearish Engulfing), 흑삼병 (Three Black Crows), 석별형 (Evening Star), 하락 킥커 (Bea

GoldGridBest V3 est un Expert Advisor pour le trading automatisé de l'or (XAUUSD) et autres devises Il utilise une stratégie de grille avec martingale optimisée, des filtres de volume multi-timeframes et une gestion du risque configurable. Les paramètres sont adaptables selon le capital et les conditions de marché. Vous pouvez m'écrire après l'achat pour plus d'informations et recevoir les documents nécessaires à la bonne utilisation Bonne chance... bonne chance

Grebenka - помощник для разметки графика.
Функционал: 1. позволяет непрерывно рисовать линии ZigZag в ручном режиме, используя клики мышкой. 2. позволяет включать режим, при котором любая трендовая линия с которой в данный момент проводится манипуляция, выравнивается по горизонтали.
Горячие клавиши: [Z] - включение/выключение режима рисования линий ZigZag вручную [X] - включение/выключение режима горизонтальной трендовой линии [C] - быстрая смена цвета линий ZigZag [Del] - стандартная клавиш
FREE

REMEMBER THAT TO OBTAIN POSITIVE RESULTS YOU MUST USE A RAW ACCOUNT WITH LOW SPREADS, TRADE ON SYMBOLS WITH LOWER SPREADS BETWEEN BID/ASK PRICE, ALWAYS FOLLOW THESE 3 FUNDAMENTAL RULES IN YOUR SET:
- TP AND DISTANCE MUST HAVE THE SAME VALUE
- SL MUST ALWAYS HAVE A DOUBLE VALUE OF TP AND DISTANCE
- LOT MULTIPLIER MUST HAVE A VALUE GREATER THAN 2 ( BETTER 3 ) WARNING: I would like to point out that the close function closes all open trades in the account , even those opened manually or by other

이 도구는 지정되거나 자동으로 계산된 시차가 있는 원본 시간 척도를 차트 하단에 추가합니다.
이 편리한 도구를 사용하면 차트의 가독성을 높이고 자신이나 국가에 익숙한 시간 형식으로 차트를 표시하여 정신적 스트레스를 줄일 수 있습니다.
시차를 계산할 필요가 없더라도 기본 시간 척도를 Local_Time으로 바꾸면 차트의 가독성을 높일 수 있습니다.
Local_Time은 "DD.MM hh:mm", "DD MMM hh:mm", "MM-DD hh:mm", "MM/DD hh:mm", "DD hh:mm", " hh:mm"을 사용하며 다른 국가의 사람들이 사용할 수 있도록 설계되었습니다.
유연한 매개변수 설정을 사용하면 기본 시간 척도 삭제, 시차 자동 또는 수동 계산, 일광 절약 시간 조정, 척도 간 간격 조정 등 필요에 맞게 Local_Time을 사용자 정의할 수 있습니다.
Local_Time 아래에 서브 윈도우가 생성되면 빨간색 바가 나타나며, 이를 클릭하면 하단으로 이동할 수 있
FREE

KT HalfTrend는 이동 평균 기반의 추세 지표로, 차트에 영역을 표시합니다. 상승 또는 하락 추세의 전환을 감지하면, 강세와 약세 무효화 영역을 시각적으로 차트에 표시합니다. 주 차트에 화살표로 매수/매도 강도를 표시해주며, 추세가 없을 경우 평평한 상태를 유지합니다. 이는 가격이 축적되거나 일시적으로 정체되거나 분배되고 있다는 의미일 수 있습니다. 추세가 발생하면 해당 방향으로 기울어짐이 나타납니다. 기울기가 가파를수록 추세 신호는 더 강력하며, 강한 상승 추세는 파란색, 강한 하락 추세는 빨간색으로 강조 표시될 수 있습니다.
기능
매우 직관적이고 사용하기 쉬운 독특한 인디케이터입니다. 모든 통화쌍 및 시간대에서 사용할 수 있습니다. 빠른 진입과 안정적인 진입 모두에 대한 정보를 제공합니다. 이동 평균, 파라볼릭 SAR, 색상 등을 사용자 설정할 수 있습니다.
활용 방법 일반적으로 매수 조건은 자산 가격이 인디케이터 기울기 위로 상승하고 HalfTrend가 파란색으로 바
우리는 당신에게 트렌드 거래의 세계에서 게임의 규칙을 변경하는 혁신적인 지표를 제시한다. 이 표시기는 성능을 재고하고 거래 경험을 전례없는 높이로 높이도록 설계되었습니다. 우리의 표시기는 경쟁 업체와 차별화 된 고급 기능의 고유 한 조합을 자랑합니다. "실제 가격 요인"의 첨단 기술은 가장 어렵고 휘발성 시장 상황에서도 탁월한 안정성을 보장합니다. 불안정한 패턴,깨진 지표 및 의식적이고 통제 된 거래에 작별 인사를하십시오. 표시기는 단지 아름다운 그림이 아닙니다! 지표는 거래자의 편으로 확률을 이동시켜 이익을 얻어야 합니다. 표시 신호(완전 자동 모드)에 따라 거래 결과에 익숙해: https://www.mql5.com/ko/signals/2339244 아세트렌드는 추세 지표 순위에서 1 위를 차지합니다. 인터넷에서"아세트렌드 트렌드 지표 테스트"에 대한 정보를 검색하여 자세한 내용을 확인할 수 있습니다. 아세트 렌드-거래의 최대 수익성 및 통제. 우리의 지표는 역사가 아닌 현재 시장

소개 Quantum Breakout PRO , 브레이크아웃 존 거래 방식을 변화시키는 획기적인 MQL5 지표! 13년 이상의 거래 경험을 가진 숙련된 트레이더 팀이 개발한 퀀텀 브레이크아웃 PRO 혁신적이고 역동적인 브레이크아웃 존 전략으로 거래 여정을 새로운 차원으로 끌어올리도록 설계되었습니다.
Quantum Breakout Indicator는 5개의 이익 목표 영역이 있는 브레이크아웃 영역의 신호 화살표와 브레이크아웃 상자를 기반으로 한 손절 제안을 제공합니다.
초보자 거래자와 전문 거래자 모두에게 적합합니다.
Quantum EA 채널: 여기를 클릭하세요
중요한! 구매 후 설치 매뉴얼을 받으려면 개인 메시지를 보내주십시오. 추천:
기간: M15 통화쌍: GBPJPY, EURJPY, USDJPY,NZDUSD, XAUUSD 계정 유형: 스프레드가 매우 낮은 ECN, Raw 또는 Razor 브로커 시간: GMT +3 중개인 :
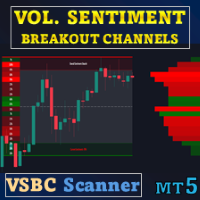
스페셜 오퍼 : ALL TOOLS , 개당 $35 입니다. 새로운 도구 는 첫 일주일 또는 처음 3회 구매 까지 $30 에 제공됩니다! Trading Tools Channel on MQL5 : MQL5 채널에 가입하고 제 최신 소식을 받아 보세요 Volume Sentiment Breakout Channels 는 동적 가격 채널 안에서 거래량 심리에 기반한 돌파 구역을 시각화해 주는 지표입니다. 단순히 가격 돌파를 기술적 이벤트로만 보는 것이 아니라, 매수/매도 거래량이 조정(콘솔리데이션) 구간에서 어떻게 분포하는지에 초점을 맞추어, 가격이 채널을 벗어날 때마다 매수자와 매도자 간의 통제권 이동을 표현합니다. 각 압축 구간 내부에서 이 지표는 영향력이 큰 영역을 식별하고, 매수측과 매도측의 우위 정도를 측정하며, 주문 흐름의 강도를 차트 상에서 실시간으로 지속적으로 업데이트합니다. 거래량 심리로 “가중치”가 부여된 채널을 가격이 상향 또는 하향 돌파할 때,

Silver Session Pivots EA – LITE (Free) This Expert Advisor demonstrates a session-based pivot trading approach specifically designed for XAGUSD (Silver) using predefined market sessions. The EA calculates session high and low levels during specific trading hours and places a trade when price breaks these levels after the session has ended. Main features Session high and low calculation based on ICT Killzones (New York time) Trades breakouts after session completion Reversed breakout logic Only
FREE

Swing 모델 기반 거래 전략에는 증가된 랏으로 두 개의 반대되는 보류 주문을 넣는 것이 포함됩니다. 시장 가격이 특정 방향으로 움직이면 주문 중 하나가 실행되고 다른 주문의 로트 크기가 늘어납니다. 이 접근 방식을 통해 거래자는 위험을 최소화하면서 이익을 얻을 수 있으므로 외환, 주식 및 상품을 거래하는 안정적인 방법이 됩니다. 금융 거래에서 이 전략을 사용하는 것은 특히 변동성이 큰 시장에서 정보에 입각한 의사 결정을 촉진하는 능력으로 널리 인식되어 왔습니다. 그 효과는 시장 동향을 파악하고 이를 활용하는 동시에 시장 위험에 대한 노출을 줄이는 능력에 기인합니다. 따라서 거래 성과를 최적화하려는 거래자들에게 인기 있는 선택입니다. ONLY for HEDGING account type EA는 세 가지 유형의 보류 주문 개시(TypeofTrade)를 제공합니다. 배치 후 자동 개설(즉시 AutoTrade 개설) 수동개설 후 개설 및 관리(수동개설 ManualTrade) 고/저 레벨

An ICT fair value gap is a trading concept that identifies market imbalances based on a three-candle sequence. The middle candle has a large body while the adjacent candles have upper and lower wicks that do not overlap with the middle candle. This formation suggests that there is an imbalance where buying and selling powers are not equal. Settings Minimum size of FVG (pips) -> FVGs less than the indicated pips will be not be drawn Show touched FVGs Normal FVG color -> color of FVG that hasn't
FREE

Understanding the levels of the previous day or week is very important information for your trading.
This indicateur allow to draw Previous day High/Low Previous week High/Low
Congifuration High & Low for: Previous day, week Line Style, color Label position, size, color Any questions or comments, send me a direct message here https://www.mql5.com/en/users/mvonline
FREE

Advanced Basket EA MT5 - Professional Portfolio Management System
Next-Generation Account-Level Basket Management for MetaTrader 5 The Advanced Basket EA MT5 is a cutting-edge portfolio management system that treats your entire account as one intelligent basket. Real-World Use Cases Case 1: Multi-EA Portfolio Management Scenario: Running 5 different EAs across 10 pairs Monitor combined P/L across all strategies Set daily profit target: $1000 → day ends when reached Daily loss limit: $400 →

The Forex Master Pattern is an alternative form of technical analysis that provides a framework which will help you to find and follow the hidden price pattern that reveals the true intentions of financial markets. This algorithm here does a good job detecting the Phase 1 of the Forex Master Pattern cycle, which is the contraction point (or Value).
On Phase 2 we get higher timeframe activation (also called Expansion), which is where price oscillates above and below the average price defined

This indicator is specifically designed for boom 1000 index. The indicator contains optimised trend filters to target buy spikes in an uptrend. The indicator also add a grid buy signal to recover some loss of the first buy signal. The indicator also provides exit signals for delayed spikes which can help with risk management .Also it analyses signals for historical data and displays percentage of good signals provided by the indicator. KEY FEATURES Non-lagging indicator. Non-repaint. Enable/d
FREE

Desenvolvido por smart2trader.com Indicador Pin Bar Color detecta e pinta automaticamente padrões de pin bar no gráfico com cores personalizáveis, oferecendo configurações flexíveis para identificação de oportunidades de trading. Além disso, através do nosso indicador Pin Bar , é possível monitorar em tempo real as formações do padrão pin bar , sendo sempre avisado nos ultimos 30 segundos antes do encerramento do candle.
Sobre o Padrão Pin Bar
O padrão Pin Bar é amplamente utilizado na análise
FREE

To get access to MT4 version please click https://www.mql5.com/en/market/product/130055  ; - This is the exact conversion from TradingView: "Ut Alart Bot Indicator". - You can message in private chat for further changes you need. Here is the source code of a simple Expert Advisor operating based on signals from Ut Bot Indicator . #property copyright "This EA is only education purpose only use it ur own risk" #property link " https://sites.google.com/view/automationfx/home " #property versio
FREE

Elliott Wave EA 어드바이저 설명 Elliott Wave AI는 A. Merrill이 설명한 M & W 파동 패턴을 기반으로 한 전문 트레이딩 솔루션입니다. 이 강력한 Expert Advisor는 높은 정확도로 파동 형성을 식별하고 거래하여 트레이더에게 엘리엇 파동 이론을 활용할 수 있는 신뢰할 수 있는 자동화된 솔루션을 제공합니다. 주요 특징 지능형 패턴 인식 - 고급 알고리즘이 탁월한 정확도로 M & W 파동 패턴을 식별 이중 신호 기술 - 포괄적인 시장 분석을 위해 진화 및 변이 신호 모두 거래 유연한 거래 방향 - 매수만, 매도만 또는 양방향 거래 선택 가능 적응형 자본 관리 - 거래 스타일에 따른 고정 볼륨 또는 위험 기반 포지션 크기 결정 멀티 타임프레임 분석 - M15를 위한 기본 설정으로 모든 타임프레임에 최적화 완전한 보호 시스템 - 맞춤형 손절매, 이익실현, 트레일링 스탑 및 손익분기점 포함 시장 및 페어 Elliott Wave EA 는 다양한 시장에서

Position Size Calculator PRO MT5 (v2.20) Position Size Calculator PRO 는 MetaTrader 5를 위한 전문적인 리스크 관리 도구입니다. 설정한 거래당 리스크, 손절매(Stop Loss) 거리, 그리고 심볼 사양(틱 가치, 틱 사이즈, 최소/최대/스텝 거래량, 증거금)을 기반으로 권장 롯(lot) 크기를 자동으로 계산해 줍니다. 비거래 운영: 이 지표는 주문을 직접 열거나 닫지 않으며 포지션을 관리하지 않습니다. 이는 자금 관리를 표준화하고 진입 전 크기 계산 실수를 줄이기 위한 의사 결정 지원 도구입니다. 차트 표시 항목 권장 롯 크기 (리스크 및 SL 거리에 따름) 진입가 / 손절매(SL) / 익절매(TP) 및 핍/포인트 거리 예상 리스크 (계좌 통화 및 %) 및 SL 도달 시 예상 손실 예상 수익 (TP 도달 시) + 손익비 (R:R Ratio) 필요 증거금 및 증거금 수준 (브로커 지원 시) 예상 손익분기점 (스프레드 포

Robô de Gradiente Linear para MT5 — Estratégia com Bandas VWAP O Robô de Gradiente Linear é o primeiro sistema brasileiro desenvolvido com base em Gradiente Linear aplicado às Bandas VWAP , voltado para operações automáticas no mini índice e no índice cheio da B3. Estratégia e funcionamento O robô identifica zonas de exaustão do preço, realizando operações de compra e venda nos pontos de maior probabilidade de reversão.
Sua gestão financeira segue parâmetros rigorosos para preservar o capital: S
SmartSwing Hybrid EA – Adaptive Grid & Trend-Stalker Strategy SmartSwing Hybrid EA is a powerful and intelligently engineered Expert Advisor built for MetaTrader 5. It is designed to combine the precision of trend-following systems with the controlled risk exposure of dynamic grid trading. Whether you're a beginner or a seasoned trader, this EA is tailored to help you grow your capital with structured entries, smart position management, and clean logic. Core Strategy SmartSwing Hybrid EA

Modified oscillator MACD. A classic indicator that combines a trend indicator with an oscillator to detect entry points. Has a multi-timeframe panel and 3 types of notifications
Benefits:
Works on all instruments and timeseries Trend indicator with oscillator for inputs Multi-period panel on all timeframes Pluggable arrows when signals appear Three types of notifications: push, email, alert
MT4 version -> HERE / Our news -> HERE
How the indicator works:
AW Classic MACD - Indicator of
FREE

The SuperTrend Strategy is a widely-used technical indicator based on the Average True Range (ATR), primarily employed as a trailing stop tool to identify prevailing market trends. The indicator is designed for ease of use while providing reliable insights into the current market trend. It operates based on two key parameters: the period and the multiplier . By default, it uses a period of 15 for the ATR calculation and a multiplier of 3 . The Average True Range (ATR) plays a crucial role in th
FREE

This is a 7-day limited-access version of KPG V4 Pro 1. After the evaluation period expires, please purchase the full product on the MQL5 Market to continue using all features.
**KPG V4 Pro 1 limited-access Smart Trading System- ** **BillionKPG Club – Precision Engineered for Steady Growth**
Hello, traders! **Quick setup tip:** For optimal performance, ensure your account meets the minimum margin requirements and set your risk parameters conservatively. If you encounter any setup challe
FREE

Introducing our advanced Forex Trading Robot, designed to work seamlessly with all currency pairs and Gold. How it works: This intelligent robot utilizes a dynamic Grid strategy, specifically optimized for trending markets. When the market is in an Uptrend, the robot will open buy positions and progressively add new buy trades as the trend strengthens. Conversely, in a Downtrend, it will open sell positions and add additional sell trades as the market moves lower. The robot's entry signals are b
FREE

Gold-O-matic is an XAUUSD-focused Expert Advisor designed to trade gold using a structured, rules-based framework. It applies layered confirmation and adaptive trade management to remain selective and consistent across changing market conditions. The EA includes configurable risk controls, built-in event-avoidance, and volatility safeguards to help reduce exposure during unstable periods. It’s also plug-and-play: simply attach it to a chart, choose your risk preference, and run it — no set file

The indicator draws supply and demand zones. The zone timeframe can be set independently of the chart timeframe. For instance, it is possible to set M5 zones on an H4 chart. The importance of zones can be adjusted using the zone strength parameter. Demand zones are displayed if at least one candle in the range of the zone is entirely above the zone. Similarly, supply zones are displayed if at least one candle within the zone is entirely below the zone.

Good old UT BOT converted from TradingView script by ' QuantNomad ', initially by ' Yo_adriiiiaan ' and ' HPotter ' - so you can bet this is powerful tool. If you know, you know. This is top of the line, while keeping it really simple.
Main function: trend identification with trend switch points , created by EMA(source) and ATR -source is CLOSE PRICE with option to use HEIKEN ASHI chart instead, for this you need "Heiken Ashi" indicator - its available as free download by MetaQuotes
One of th
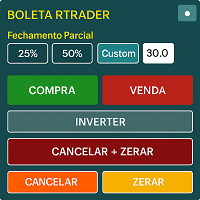
Boleta RTrader - A Boleta Mais Completa para MetaTrader 5 A ferramenta definitiva para traders que buscam precisão, agilidade e controle total sobre suas operações no MetaTrader 5.
**IMPORTANTE**: É aconselhável desabilitar no gráfico do MT5 o histórico de negociações somente quando for usar saídas parcias e precisar movimentar a ordem parcial para evitar delay. --- PRINCIPAIS FUNCIONALIDADES: EXECUÇÃO DE ORDENS **Compra e Venda Instantâneas**: Execute ordens a mercado com um único clique **

RSI Strategy EA MT5 는 MetaTrader 5 전용으로 설계된 고급 자동 거래 도구로, 상대 강도 지수(RSI) 지표를 활용하여 과매수 및 과매도 조건에 기반한 거래 진입과 청산을 자동화합니다. 이 EA는 이러한 구간 내에서 리버스 트레이딩 설정을 지원하여 거래 관리에 다재다능한 접근 방식을 제공합니다. 광범위하게 백테스트된 이 EA는 정확한 진입 방법, 유연한 청산 규칙, 그리고 최소한의 시스템 리소스 소비로 효율적인 거래를 제공합니다. 이 시스템은 세션 제어를 위한 요일/시간 필터를 포함하며, 성능 검증을 위한 히스토리 데이터 테스트를 지원합니다. 실시간 대시보드는 오픈된 거래, 계좌 자산, 시스템 메트릭을 표시하며, 직관적인 입력 메뉴는 구성을 간단하게 만듭니다. 모든 설정에 대한 자세한 문서가 제공됩니다. 자세한 문서는 여기에서 확인하세요: 일반 설정/입력 가이드 | 지표 설정/입력 가이드 | 백테스트 및 설정 파일 MT4 버전은 여기에서 다운로드할 수 있습니

FREE TRADER DASHBOARD EA (MT5) A powerful on-chart dashboard for MetaTrader 5 that allows traders to open and manage trades instantly with one click. This EA is released 100% FREE as a loving gift for the trading community.
Designed for traders who want fast execution , clear trade management , and reduced manual mistakes . Key Features 1-Click Trading Panel Trade directly from the chart using large, easy buttons: BUY / SELL BUY LIMIT / SELL LIMIT BUY STOP / SELL STOP Perfect for fast entries wi
FREE

Local Trade Copier EA 는 외부 소스에서 거래 신호를 실행해야 하거나 MAM 또는 PAMM 계정 없이 동시에 여러 계정을 관리해야 하는 개인 거래자 또는 계정 관리자를 위한 솔루션입니다. 최대 8개의 마스터 계정에서 무제한 슬레이브 계정으로 복사합니다.
[ 설치 가이드 | 업데이트 가이드 | 문제 해결 | 자주하는 질문 | 모든 제품 ]
100% 자체 호스팅 설치 및 사용이 간편함
설치 프로그램, 구성 파일, 서버, 메모리 파이프 또는 DLL이 사용되지 않음
EA를 영원히 사용하기 위한 1000번의 활성화
로컬 실행, 네트워크 대기 시간 없음
필요한 모든 기능을 구현합니다.
최대 8개의 마스터 계정 및 무제한 슬레이브 계정
모든 브로커 및 DD/NDD/ECN/STP 실행과 함께 작동
다른 계정 통화를 사용하는 계정에서 작동 라이브 계정과 데모 계정 간에 구분 없이 작동 마스터 및 슬레이브 계정에서 기호 이름의 접미사 지원
매직 넘버 및 주문 댓글로 필터링 다른 거래

The indicator is designed for easy construction of synthetic charts based on data of various financial instruments. It will be useful both arbitrage and pair trading, as well as for analysis purposes. Its main advantage is simplicity and clarity. Each chart is given as a common mathematical formula. For example, if you want to plot the spread (difference) between EURUSD and GBPUSD with coefficients 4 and 3, then set the following formula: EURUSD * 4 - GBPUSD * 3 The resulting chart is shown in t

XenClarity – Gold Breakout Monster The Ultimate XAUUSD H1 Specialist. NO Grid. NO Martingale. GRAB IT NOW: Only $95 (Target Price: $1299)! XenClarity is not just another Expert Advisor. It is an algorithmic beast engineered with one singular purpose: Total Domination of the Gold Market (XAUUSD). Forget standard indicators. XenClarity utilizes a sophisticated Level Trading Strategy , enhanced by dynamic buffers and smart money management. This tool transforms market chaos into mathematical cla

"Agulhadas" 전략을 알아보세요 이 전략은 브라질 시장에서 인기 있는 개념에서 영감을 받아, 트렌드, 시장 강도, 모멘텀을 기반으로 진입 및 청산 포인트를 식별하기 위해 5가지 기술 지표를 결합합니다. 사용되는 지표 중에는 이동 평균 교차를 시각적으로 보여주는 것으로 잘 알려진 Odair Aguiar가 개발한 유명한 Didi 지수가 포함되어 있습니다. 여기에서 주식 스캐너 다운로드 사용된 지표 Didi 지수 ADX 볼린저 밴드 Trix 스토캐스틱 전략 작동 방식 지표는 미리 정의된 기준에 따라 매수 및 매도 진입 지점에 화살표를 표시하며, 차트에 "X"로 청산 지점을 시각적으로 나타냅니다. 매수 신호 진입을 확인하기 위해 다음 세 가지 조건이 충족되어야 합니다: ADX 상승 추세 ADX가 32 이상이거나 상승 중이며, DI+가 DI-보다 높음. Didi 지수의 골든 크로스 단기 평균이 중기 평균을 상향 돌파. 볼린저 밴드 확장 상단 및 하단 밴드가 동시에 확장됨. 매도 신호
FREE

NOTE: Turn Pattern Scan ON
This indicator identifies Swing Points, Break of Structure (BoS), Change of Character (CHoCH), Contraction and Expansion patterns which are plotted on the charts It also comes with Alerts & Mobile notifications so that you do not miss any trades. It can be used on all trading instruments and on all timeframes. The non-repaint feature makes it particularly useful in backtesting and developing profitable trading models. The depth can be adjusted to filter swing points.
FREE

SMA Reentry란? SMA Reentry 는 두 개의 단순 이동평균선(SMA) — 하나는 빠른 선, 하나는 느린 선 —을 활용하여 트렌드 방향으로의 재진입 신호를 제공하는 전문 인디케이터입니다. 이 인디케이터는 느린 SMA가 정의하는 추세 속에서 가격이 빠른 SMA 위(또는 아래)로 다시 진입할 때를 명확하게 보여줍니다. 명확한 풀백(pullback), 브레이크아웃(breakout), 추세 복귀 신호를 찾는 트레이더에게 이상적인 도구입니다. 동작 원리 빠른 SMA와 느린 SMA의 크로스오버로 주요 추세를 식별합니다. 가격이 빠른 SMA 위(또는 아래)로 다시 진입할 때마다 화살표로 풀백 및 재진입 신호를 표시해 트렌드 확인을 도와줍니다. 기간, 선/화살표 색상, 화살표의 가격과의 거리 등 다양한 입력값을 자유롭게 설정할 수 있습니다. 차트에 두 SMA를 직접 표시해 시각적 분석을 용이하게 합니다. 추천 대상 트렌드 추종 전략을 사용하거나 풀백 이후 진입 시점을 최적화하고 싶은
FREE
트레이딩 전략과 기술 지표를 판매하기에 가장 좋은 장소가 왜 MetaTrader 마켓인지 알고 계십니까? 광고나 소프트웨어 보호가 필요 없고, 지불 문제도 없습니다. 모든 것이 MetaTrader 마켓에서 제공됩니다.
트레이딩 기회를 놓치고 있어요:
- 무료 트레이딩 앱
- 복사용 8,000 이상의 시그널
- 금융 시장 개척을 위한 경제 뉴스
등록
로그인
계정이 없으시면, 가입하십시오
MQL5.com 웹사이트에 로그인을 하기 위해 쿠키를 허용하십시오.
브라우저에서 필요한 설정을 활성화하시지 않으면, 로그인할 수 없습니다.