Multi Timeframe SR
- 지표
- 버전: 1.1
- 업데이트됨: 25 2월 2026

Multi-Timeframe S&R is a technical analysis indicator that detects pivot points across multiple timeframes and displays price levels where these points cluster on the chart. It integrates data from M15 up to Monthly timeframes for its analysis.
Functional Overview
-
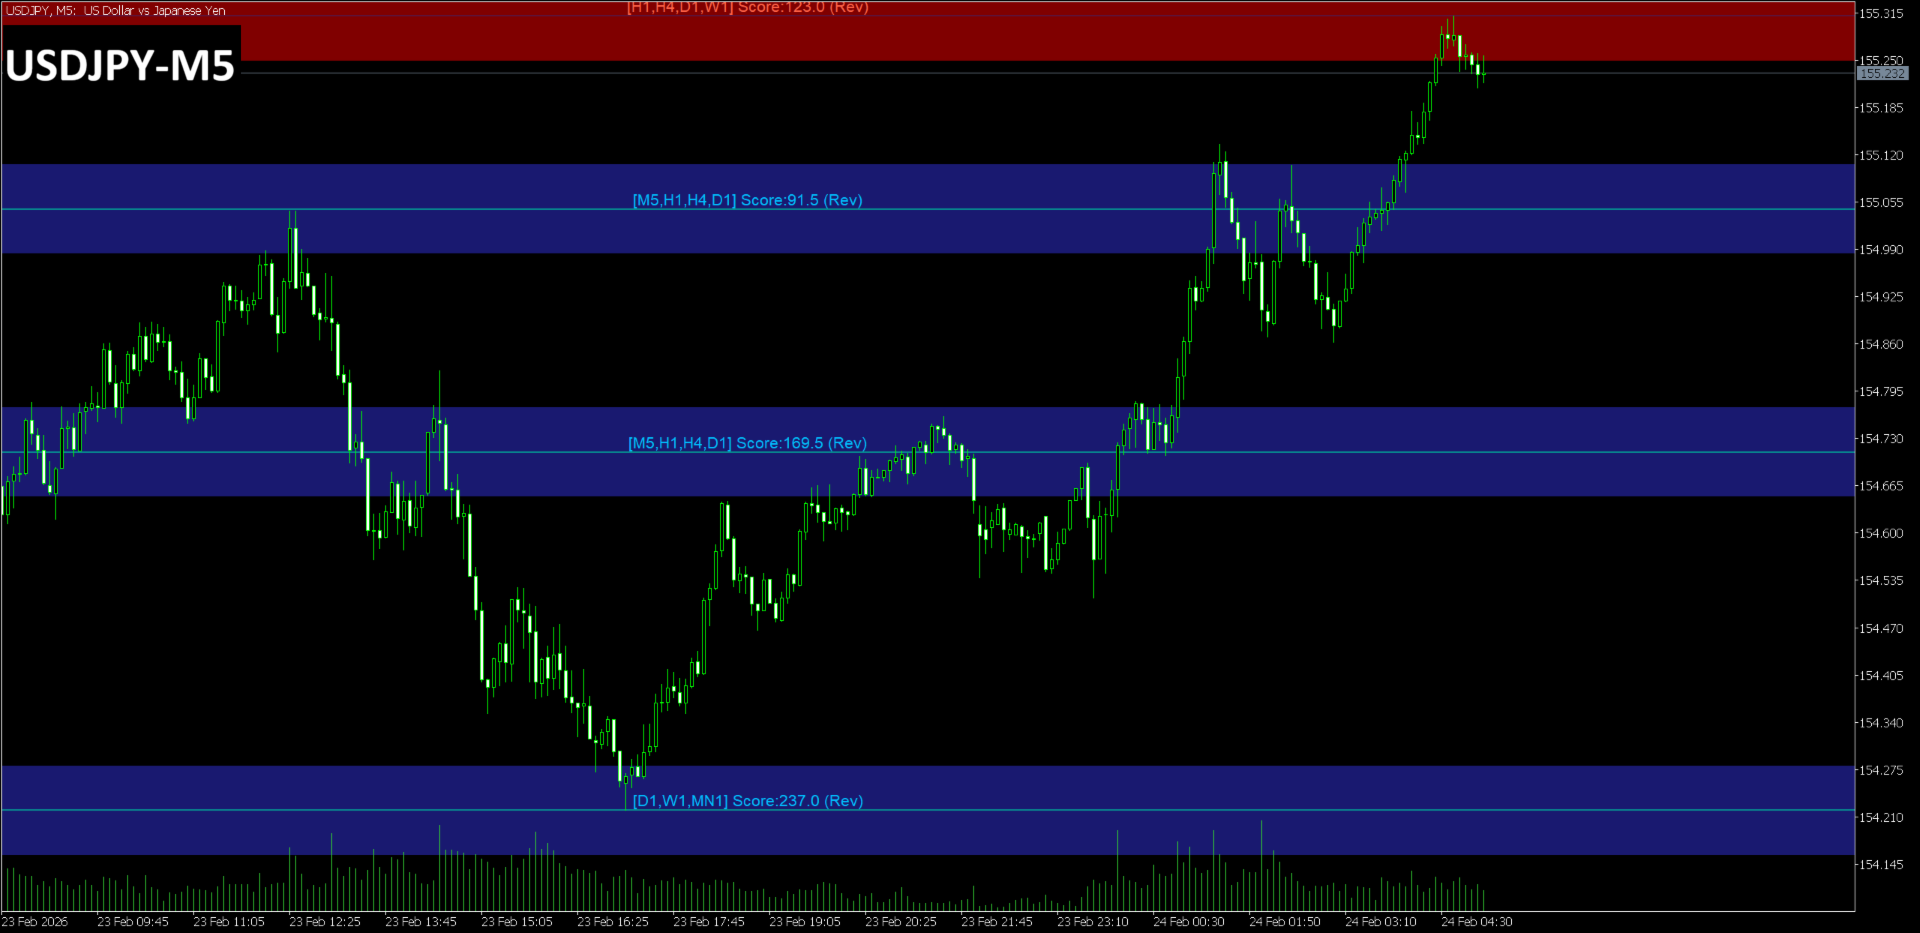
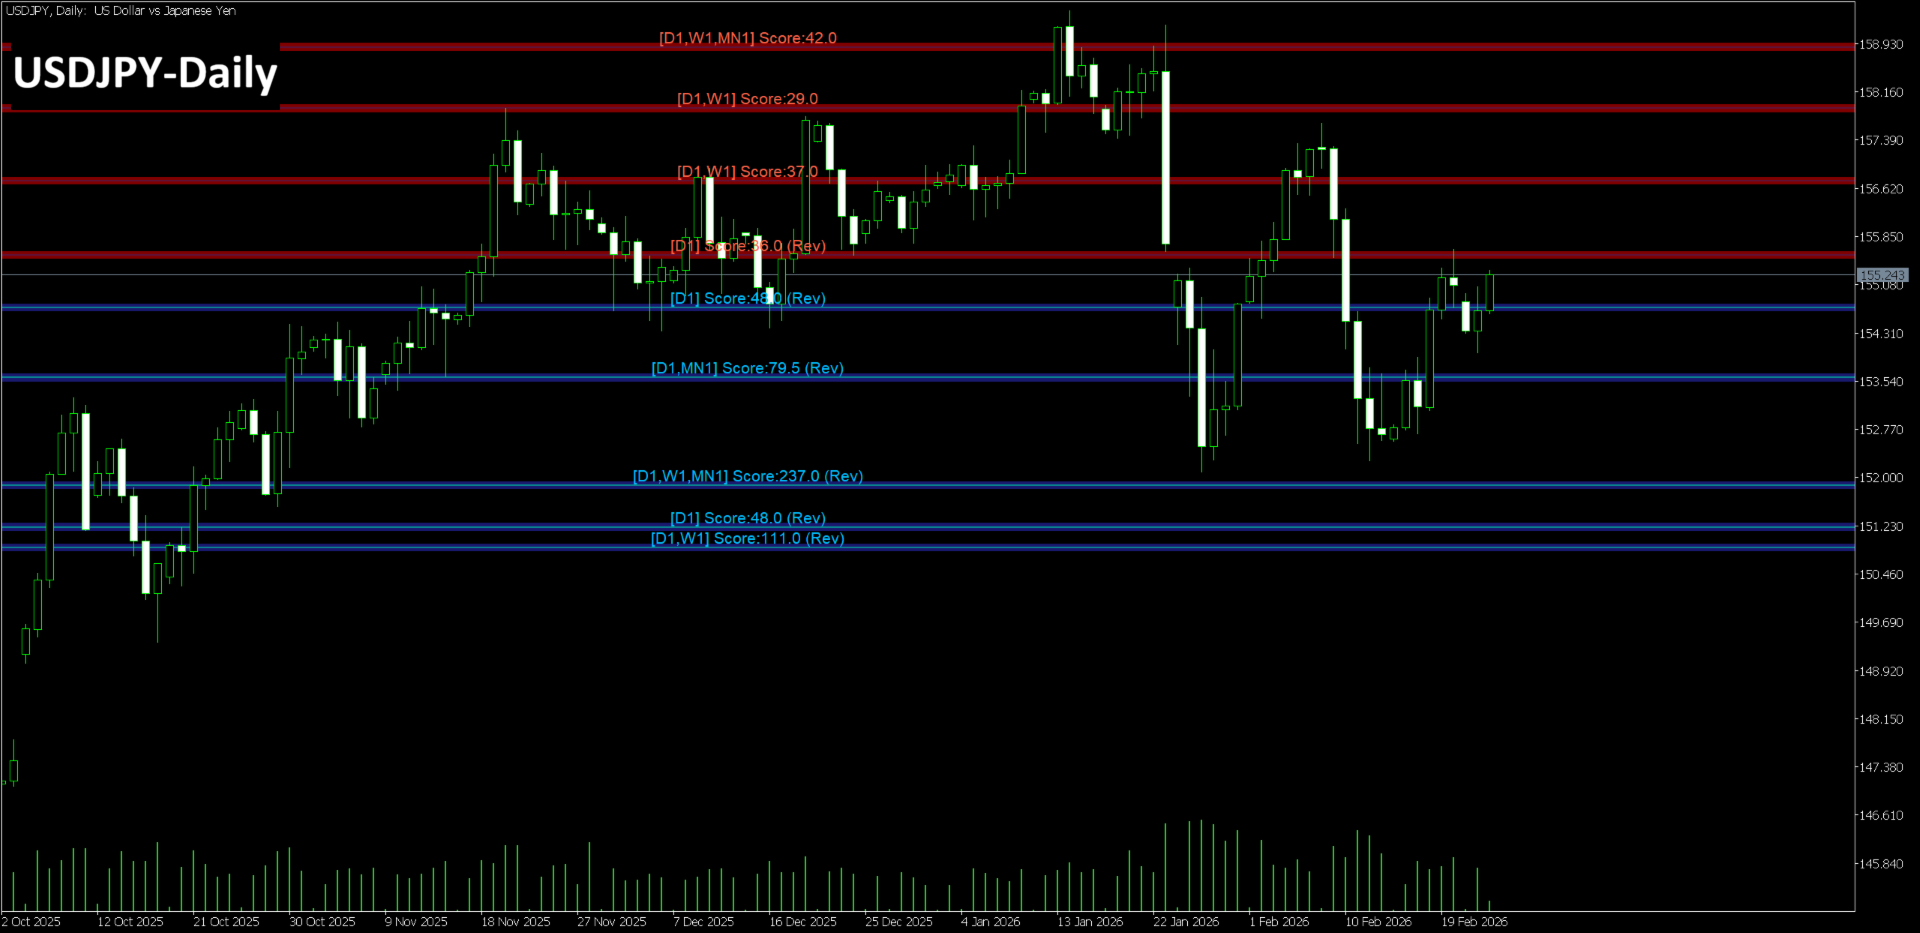
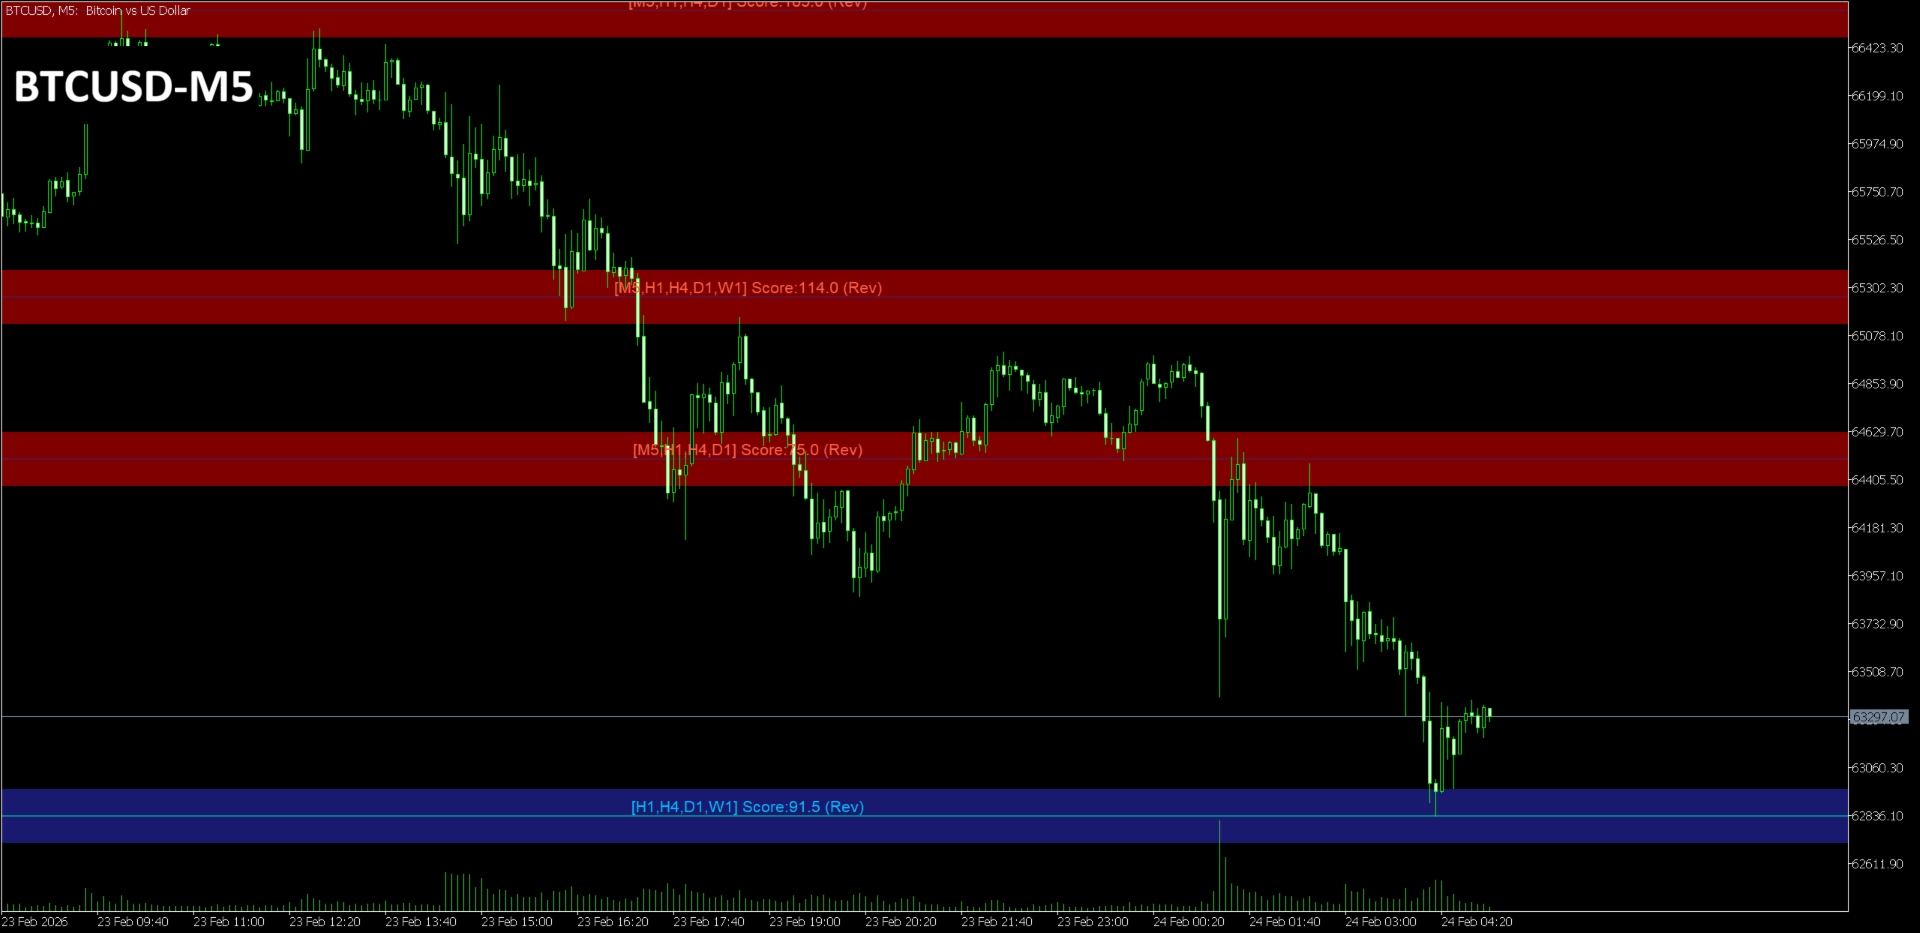
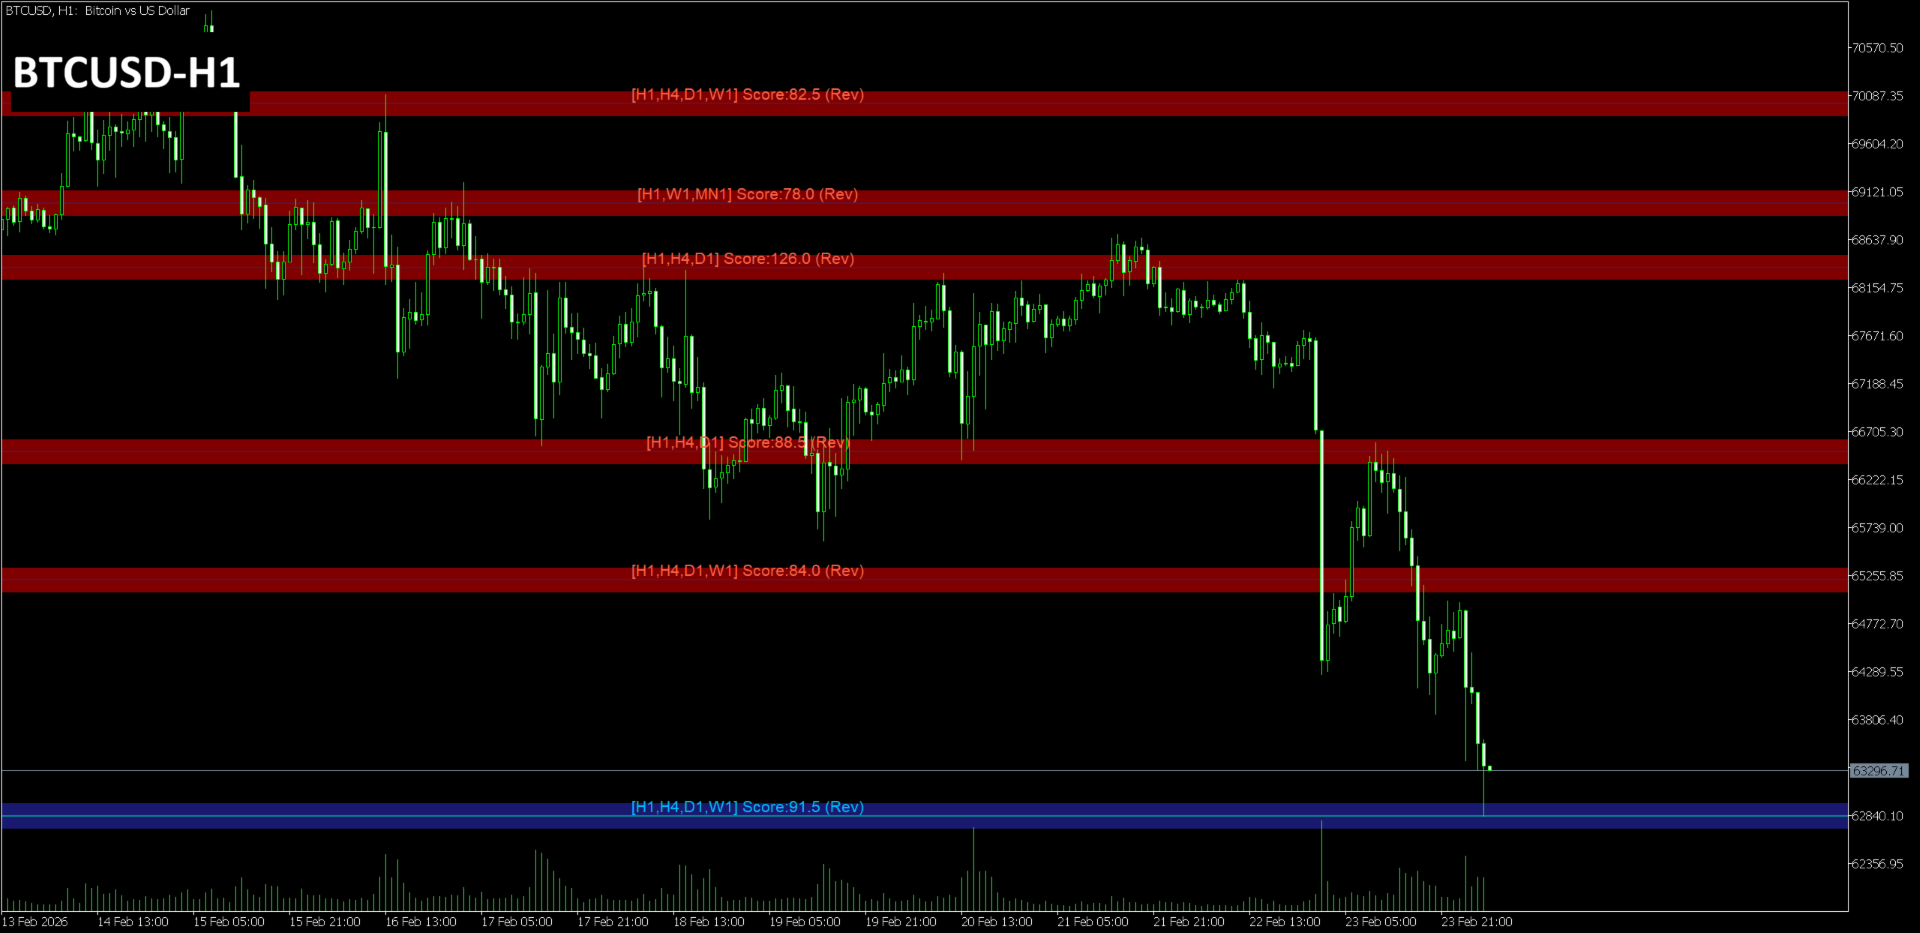
Multi-Timeframe Clustering
Aggregates pivot points from specified timeframes and merges them into a single level if they fall within a defined tolerance range.
-
Magnet Function
Automatically adjusts detected price levels to nearby candle highs, lows, opens, closes, or round numbers.
-
Scoring
Each level is displayed with a score calculated based on the types of timeframes involved and the frequency of historical reversals.
-
Zone Display
In addition to lines, the indicator can display rectangular zones representing the area around each price level.
Input Parameters
The settings are listed below. The parameter names match the English labels in the MetaTrader 5 input window.
Logic Settings
-
InpTolerancePoints: Tolerance range for merging levels (in points)
-
InpMinScore: Minimum score required for a level to be displayed
-
InpRequireReversal: Setting to require both high and low pivots for a level
-
InpLookbackBars: Number of historical bars used for analysis
-
InpPivotPeriod: Period used for pivot point detection
Display & Magnet Settings
-
InpNearbyLines: Number of lines to extract near the current price
-
InpMaxLines: Maximum number of lines to be displayed on the chart
-
InpMinDistancePts: Minimum distance between displayed lines (in points)
-
InpEnableMagnet: Enable or disable the magnet function
-
InpMagnetBars: Range of bars to search for magnet targets
-
InpMagnetRangePts: Price range within which the magnet function is applied
-
InpRoundNumberSnap: Setting for snapping levels to round numbers
-
InpPrioritizeHigherTF: Setting to prioritize levels from higher timeframes
Drawing Settings / Zone Settings
-
InpResColor / InpSupColor: Color settings for resistance and support lines
-
InpDrawZone: Enable or disable the display of rectangular zones
-
InpResZoneColor / InpSupZoneColor: Color settings for the respective zones
Important Information
This indicator displays pivot points calculated from historical price data and does not guarantee future profits. Please use it as a supplementary tool for identifying price action at specific levels.
For specific details on the indicator's operation, please refer to the attached screenshots.
Support
For any questions regarding the product, please contact me through the mql5.com messaging system or the comments section on the product page. Support is not provided through external resources or third-party messaging applications.