거래 로봇을 무료로 다운로드 하는 법을 시청해보세요
당사를 Facebook에서 찾아주십시오!
당사 팬 페이지에 가입하십시오
당사 팬 페이지에 가입하십시오
스크립트가 마음에 드시나요? MetaTrader 5 터미널에서 시도해보십시오

ytg_2MA_4Level. - MetaTrader 4용 expert
Iurii Tokman

|
Korean
Русский
中文
Español
Deutsch
Português
Veda http://ytg.com.ua resource - the author works for automation of trade on the forex market - advisers, experts will, trading robots, indicators, trading strategies, scripts, functions and libraries.
- 조회수:
- 17933
- 평가:
- 게시됨:
- 업데이트됨:
-
 이 코드를 기반으로 한 로봇이나 지표가 필요하신가요? 프리랜스로 주문하세요
프리랜스로 이동
이 코드를 기반으로 한 로봇이나 지표가 필요하신가요? 프리랜스로 주문하세요
프리랜스로 이동
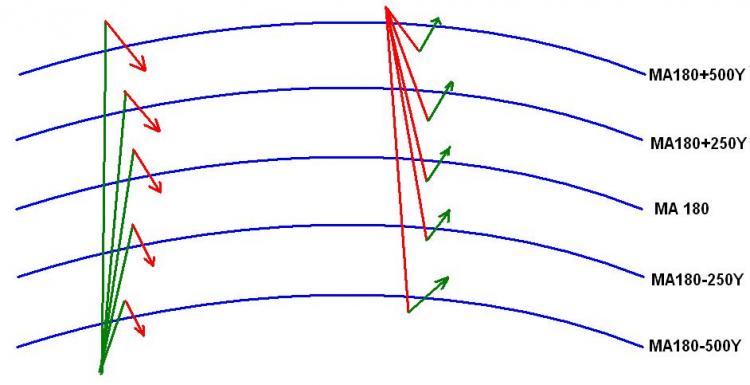
Principle of job:
2 SMA - first with parameters 14, second with 180.
Also there are parallel lines:
SMA 180 + 250 items on Y
SMA 180 + 500 items on Y
SMA 180 - 250 items on Y
SMA 180 - 500 items on Y
At crossing MA14 any line, occurs either Buy, or Sell.
| Symbol | EURUSD (Euro vs US Dollar) | ||||
| Period | 1 Hour (H1) 2009.02.19 00:00 - 2009.03.18 23:00 (2009.02.19 - 2009.03.19) | ||||
| Model | Every tick (the most accurate mode based on the shortest available time frames) | ||||
| Parameters | _____1_____="Trading settings "; take_profit=1000; stop_loss=1000; lots=3; _____2_____="Indicator settings "; calculated_bar=4; fast_МА_period=20; fast_МА_method=2; price_const_of fast_МА=4; slow_МА_period=180; slow_МА_method=2; price_const_of slow_МА=4; _____3_____="Level settings "; upper_1=950; upper_2=300; lower_1=750; lower_2=450; | ||||
| Bars in test | 1476 | Ticks modeled | 867857 | Modeling quality | 90.00% |
| Mismatched chart errors | 5 | ||||
| Initial deposit | 10000.00 | ||||
| Total net profit | 17882.10 | Gross profit | 23990.10 | Gross loss | -6108.00 |
| Profit factor | 3.93 | Expected payoff | 1788.21 | ||
| Absolute drawdown | 4755.30 | Maximum drawdown | 5607.30 (51.67%) | Relative drawdown | 51.67% (5607.30) |
| Total trades | 10 | Short positions (won %) | 2 (100.00%) | Long positions (won %) | 8 (75.00%) |
| Profit trades (% of total) | 8 (80.00%) | Loss trades (% of total) | 2 (20.00%) | ||
| Largest | profit trade | 3000.00 | loss trade | -3054.00 | |
| Average | profit trade | 2998.76 | loss trade | -3054.00 | |
| Maximum | consecutive wins (profit in money) | 7 (20990.40) | consecutive losses (loss in money) | 1 (-3054.00) | |
| Maximal | consecutive profit (count of wins) | 20990.40 (7) | consecutive loss (count of losses) | -3054.00 (1) | |
| Average | consecutive wins | 4 | consecutive losses | 1 | |

MetaQuotes Ltd에서 러시아어로 번역함.
원본 코드: https://www.mql5.com/ru/code/8783
 Indicator %BB
%BB is indicator comes from Bollinger Bands.
Trend Indicator
This indicator is used to show the trend of the 30 min charts. You can then apply your Long Strategy when the market is UP and Short Strategy when the market is DOWN.
Fractals_Price
The indicator of price levels fractals.
Squeeze Break Indicator
This indicator uses a combination of Bollinger Bands and Keltner Channels to capture moves from low to high volatility.