거래 로봇을 무료로 다운로드 하는 법을 시청해보세요
당사를 Facebook에서 찾아주십시오!
당사 팬 페이지에 가입하십시오
당사 팬 페이지에 가입하십시오
스크립트가 마음에 드시나요? MetaTrader 5 터미널에서 시도해보십시오

FXA0 - RSI Crossing 50 plus ATR ver1.2.mq4 - MetaTrader 4용 지표
- 조회수:
- 62517
- 평가:
- 게시됨:
- 업데이트됨:
-
 이 코드를 기반으로 한 로봇이나 지표가 필요하신가요? 프리랜스로 주문하세요
프리랜스로 이동
이 코드를 기반으로 한 로봇이나 지표가 필요하신가요? 프리랜스로 주문하세요
프리랜스로 이동
This is my first indicator :)
Here's how you use it. Just drop it on the chart, preferably a H1 or H4 chart, if you go up to a daily or down
below the H1 you will need to adjust the RSI and ATR values.
The indicator will give you blue arrows for long positions and red for short positions.
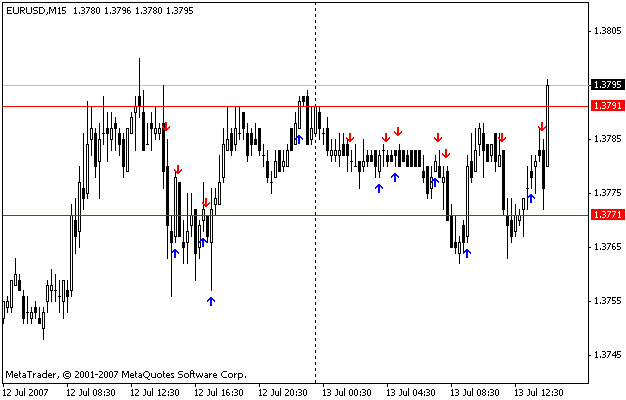
Here's what you will see.
1) Blue arrows for long (going up) Red arrows for short (going down)
2) Two horizontal lines for most current position (one line for the entry and one for the stop)
3) If you put in the order and the entry is executed look for a second blue or red arrow and add to that position when
the arrow occurs.
4) Close one lot at the green check box, close the next at the opposite colored arrow.
If you ever get a blue/red arrow opposite of your entry close all orders in that direction and look for orders in opposite direction.
Here is the Jamie Saettele article in summary.
http://www.traders.com/Documentation/FEEDbk_docs/Archive/082006/ForexFocus/FOREXfocus.html
-Enjoy
Here's how you use it. Just drop it on the chart, preferably a H1 or H4 chart, if you go up to a daily or down
below the H1 you will need to adjust the RSI and ATR values.
The indicator will give you blue arrows for long positions and red for short positions.
Here's what you will see.
1) Blue arrows for long (going up) Red arrows for short (going down)
2) Two horizontal lines for most current position (one line for the entry and one for the stop)
3) If you put in the order and the entry is executed look for a second blue or red arrow and add to that position when
the arrow occurs.
4) Close one lot at the green check box, close the next at the opposite colored arrow.
If you ever get a blue/red arrow opposite of your entry close all orders in that direction and look for orders in opposite direction.
Here is the Jamie Saettele article in summary.
http://www.traders.com/Documentation/FEEDbk_docs/Archive/082006/ForexFocus/FOREXfocus.html
-Enjoy
Waddah Attar Strong Level
This indicator is very powerful .. It draws Month - Week - Day - H4 Level or Range. with backtest true or false.
Waddah Attar Buy Sell Vol
This indicator separate Buy Volume and Sell Volume .. you never see like this before
Waddah Attar ADXxBollinger Indicator
This is very simple, power and easy to use Indicator
FX5_NeelyElliotWave
The indicator plots various levels of Neely Monowaves on the chart.