당사 팬 페이지에 가입하십시오
- 조회수:
- 20003
- 평가:
- 게시됨:
-
이 코드를 기반으로 한 로봇이나 지표가 필요하신가요? 프리랜스로 주문하세요 프리랜스로 이동
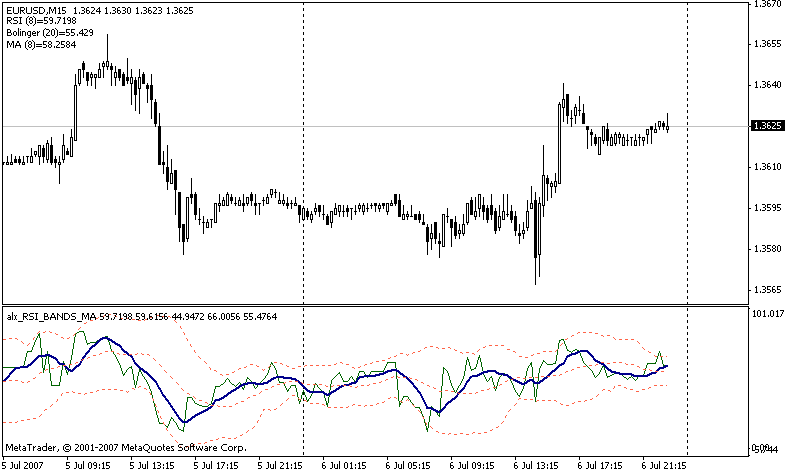
The MA is calculated based on the data of the RSI, the Bollinger displays the channel.
When the RSI is in an overbought area and goes down, while crossing the MA, it is a remarkable sell signal. The buy signal is exactly the opposite. And if there is a divergence between the MA of the price and the MA indicator of the same period, then it is really good. It is recommended to monitor the signal on several timeframes. Preferably D1, Н4, Н1, М5.

RSI_BANDS_MA
The second one is fixed, does not lag on ticks
MetaQuotes Ltd에서 러시아어로 번역함.
원본 코드: https://www.mql5.com/ru/code/7158
 Calculation of the 3-rd Elliott wave
Script for the calculation of the third Elliott wave
 4 Period MA
Indicates the number of periods for the calculation of the average line.
 Channel based on the Fibo levels
Moving average channel based on the Fibo levels
 4Period_RSI_Arrows
The 4Period RSI Arrows indicator