당사 팬 페이지에 가입하십시오

Slope_Direction_Line_Bar - MetaTrader 5용 지표
- 조회수:
- 9776
- 평가:
- 게시됨:
-
 이 코드를 기반으로 한 로봇이나 지표가 필요하신가요? 프리랜스로 주문하세요
프리랜스로 이동
이 코드를 기반으로 한 로봇이나 지표가 필요하신가요? 프리랜스로 주문하세요
프리랜스로 이동
Trend-following Slope Direction Line / Moving Average confirmation bars signal indicator is an equivalent of Slope Direction Line / Moving Average confirmation candles indicator. It compares direction of two moving averages: Moving Average and Slope Direction Line and displays colored signal pointers in a separate window. Their colors correspond to the match/mismatch of Slope Direction Line and Moving Average lines direction.
It has six input parameters:
- MA period - Moving Average calculation period
- MA method - Moving Average calculation method
- MA applied price - Moving Average calculation price
- SDL period - Slope Direction Line calculation period
- SDL method - Slope Direction Line calculation method
- SDL applied price - Slope Direction Line calculation price
- If Moving Average and Slope Direction Line are directed upwards:
- the green signal pointer is set
- If Moving Average and Slope Direction Line are directed downwards:
- the red signal pointer is set
- In any other case, the gray signal pointer is placed.
Slope Direction Line indicator is not required - it is calculated by the indicator independently.
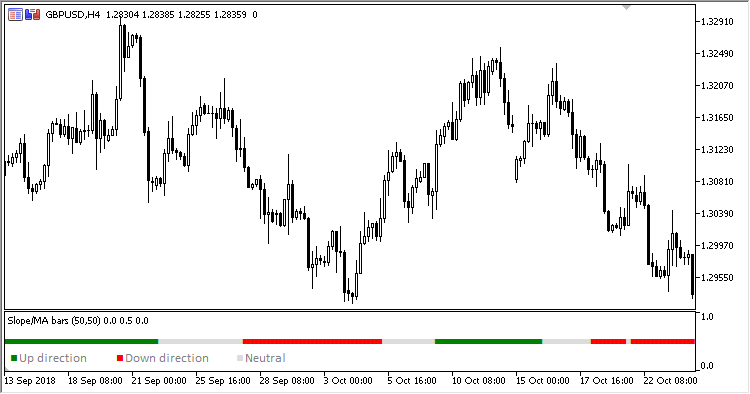
Fig. 1. Slope Direction Line / Moving Average confirmation bars
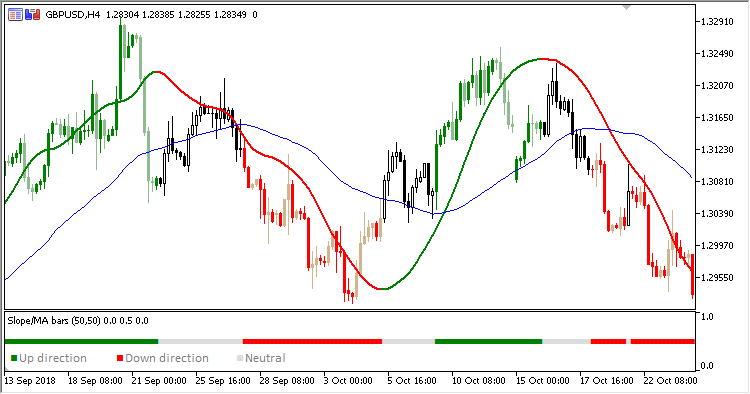
Fig. 2. Slope Direction Line / Moving Average confirmation bars + Slope Direction Line / Moving Average confirmation candles
MetaQuotes Ltd에서 러시아어로 번역함.
원본 코드: https://www.mql5.com/ru/code/22946
VGridLine_Custom
The indicator plots one vertical line per day in a specified moment of time
ColorRSI_X20
RSI_X20 indicator is able to color each line depending on its position relative to overbought and oversold areas
Slope_MA_Confirmation
Slope Direction Line / Moving Average confirmation candles indicator
Moving Average applied price
Now you can test the indicator and select the price type from the ENUM_APPLIED_PRICE enumeration