거래 로봇을 무료로 다운로드 하는 법을 시청해보세요
당사를 Facebook에서 찾아주십시오!
당사 팬 페이지에 가입하십시오
당사 팬 페이지에 가입하십시오
스크립트가 마음에 드시나요? MetaTrader 5 터미널에서 시도해보십시오

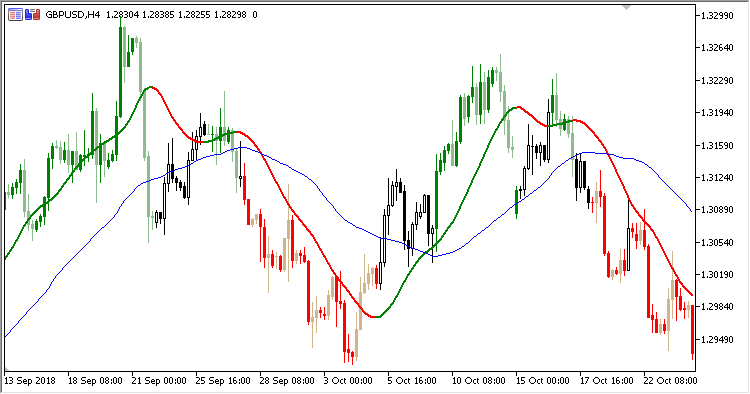
Slope_MA_Confirmation - MetaTrader 5용 지표
- 조회수:
- 11704
- 평가:
- 게시됨:
-
 이 코드를 기반으로 한 로봇이나 지표가 필요하신가요? 프리랜스로 주문하세요
프리랜스로 이동
이 코드를 기반으로 한 로봇이나 지표가 필요하신가요? 프리랜스로 주문하세요
프리랜스로 이동
Trend indicator. The indicator displays the lines and compares direction of two moving averages: Moving Average and Slope Direction Line. If the indicator lines coincide, the price chart displays colored candles.
It has six input parameters:
- MA period - Moving Average calculation period
- MA method - Moving Average calculation method
- MA applied price - Moving Average calculation price
- SDL period - Slope Direction Line calculation period
- SDL method - Slope Direction Line calculation method
- SDL applied price - Slope Direction Line calculation price
- If Moving Average and Slope Direction Line are directed upwards:
- If the candle is bullish, it is colored in green.
- If the candle is bearish, it is colored in light-green
- If Moving Average and Slope Direction Line are directed downwards:
- If the candle is bearish, it is colored in red.
- If the candle is bullish, it is colored in light-red
- In any other case, colored candles are not drawn.
Slope Direction Line indicator is not required - it is calculated by the indicator independently.
MetaQuotes Ltd에서 러시아어로 번역함.
원본 코드: https://www.mql5.com/ru/code/22945
Slope_Direction_Line_Bar
Slope Direction Line / Moving Average confirmation bars indicator
VGridLine_Custom
The indicator plots one vertical line per day in a specified moment of time
Moving Average applied price
Now you can test the indicator and select the price type from the ENUM_APPLIED_PRICE enumeration
Mean_Indicator
Mean Indicator indicator