당사 팬 페이지에 가입하십시오

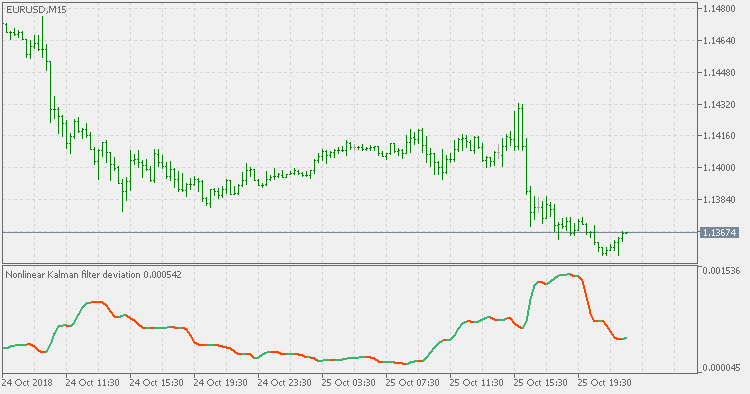
Nonlinear Kalman filter deviation - MetaTrader 5용 지표

- 조회수:
- 7066
- 평가:
- 게시됨:
- 업데이트됨:
-
 이 코드를 기반으로 한 로봇이나 지표가 필요하신가요? 프리랜스로 주문하세요
프리랜스로 이동
이 코드를 기반으로 한 로봇이나 지표가 필요하신가요? 프리랜스로 주문하세요
프리랜스로 이동
Theory:
We are having various methods of measuring volatility. One is the standard deviation (and all its variations - since standard deviation is using simple moving average - that are using various smoothing methods to calculate the estimated volatility). Each of it has it goods sides, but mainly the speed of response is crucial for volatility estimation.
This version:
This indicator is using Ehlers nonlinear Kalman filter (originally published, with some more description, here : Nonlinear Kalman filter ) for deviation calculation. You can use one of the 4 standard types of averages for pre-smoothing method:
- simple moving average (SMA)
- exponential moving average (EMA)
- smoothed moving average (SMA)
- linear weighted moving average (LWMA)
Usage:
As any deviation calculating indicator, it is not a directional indicator (you can not tell the trend just by looking at the indicator). So this indicator is used for volatility assessment and you should use it in very similar way as using the standard deviation indicator.
Inertia_Candles
The indicator paints candles whose body sizes exceed the indicator input parameter in points
JSatlCandle_HTF
JSatlCandle_HTF indicator with the timeframe selection option available in input parameters
Volatility quality
Volatility quality with ATR filter
Volatility quality - zero line
Volatility quality - zero line and ATR based