당사 팬 페이지에 가입하십시오

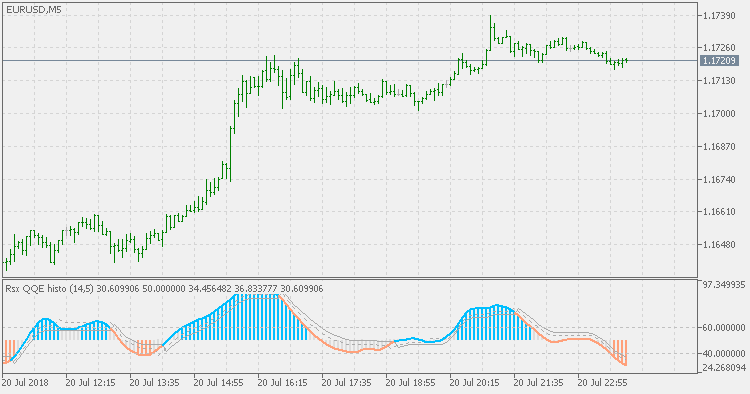
RSX QQE Histo - MetaTrader 5용 지표

- 조회수:
- 7417
- 평가:
- 게시됨:
-
 이 코드를 기반으로 한 로봇이나 지표가 필요하신가요? 프리랜스로 주문하세요
프리랜스로 이동
이 코드를 기반으로 한 로봇이나 지표가 필요하신가요? 프리랜스로 주문하세요
프리랜스로 이동
The QQE (Quantitative Qualitative Estimator) indicator consists of a smoothed Relative Strength Index (RSI) indicator and two volatility-based trailing levels (fast and slow).
Compared to the original QQE indicator this version is adding:
- Fixed levels (to help further estimate the trend).
- Color changing histogram (based on those levels).
This way we have some more information available to analyze.
This version is also using RSX (a smoother RSI without a lag) in order to further purify the signals.
RSX QQE
This version of QQE is also using RSX (a smoother RSI without a lag) in order to further purify the signals.
QQE Histo
Compared to the original QQE indicator, this version is adding fixed levels (to help further estimate the trend) and color changing histogram (based on those levels).
RSX QQE New
Compared to the original QQE indicator, this version instead of using trailing levels uses fixed levels to estimate overbought and oversold conditions. This version is also using RSX (a smoother RSI without a lag) in order to further purify the signals.
Random Walk Index
The Random Walk Index attempts to determine when the market is in a strong uptrend or downtrend by measuring price ranges over N and how it differs from what would be expected by a random walk (randomly going up or down). The greater the range suggests a stronger trend. The RWI states that the shortest distance between two points is a straight line and the further prices stray from a straight line, implies the market is choppy and random in nature.