당사 팬 페이지에 가입하십시오

Nonlinear regression - MetaTrader 5용 지표

- 조회수:
- 9028
- 평가:
- 게시됨:
-
 이 코드를 기반으로 한 로봇이나 지표가 필요하신가요? 프리랜스로 주문하세요
프리랜스로 이동
이 코드를 기반으로 한 로봇이나 지표가 필요하신가요? 프리랜스로 주문하세요
프리랜스로 이동
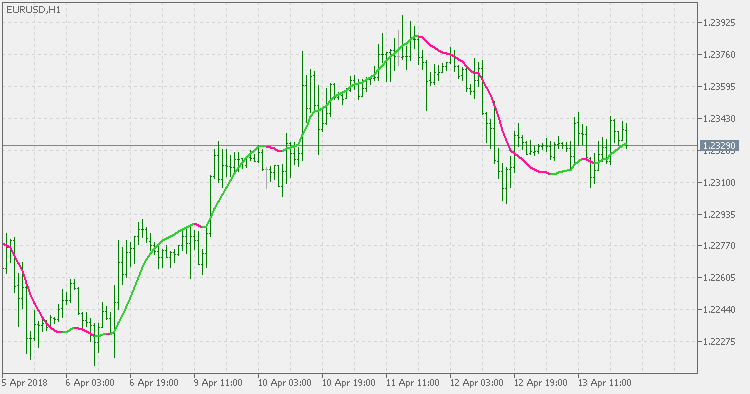
First, a few words about nonlinear regression:
Nonlinear regression is a form of regression analysis in which data is fit to a model and then expressed as a mathematical function. Simple linear regression relates two variables (X and Y) with a straight line (y = mx + b), while nonlinear regression must generate a line (typically a curve) as if every value of Y was a random variable. The goal of the model is to make the sum of the squares as small as possible.
The sum of squares is a measure that tracks how much observations vary from the mean of the data set. It is computed by first finding the difference between the mean and every point of data in the set. Then, each of those differences is squared. Lastly, all of the squared figures are added together. The smaller the sum of these squared figures, the better the function fits the data points in the set. Nonlinear regression uses logarithmic functions, trigonometric functions, exponential functions, and other fitting methods.
This indicator is a MetaTrader 5 version of nonlinear regression. Nonlinear regression is very "fast" when responding to sudden market changes so the default calculation period is set to somewhat longer period than it is usual for similar type indicator. Because of that some experimenting with period is advised based on your trading strategy and trading style.
MACD High/Low
MACD High/Low uses the highest high and lowest low of MACD (nnn) bars back to calculate a sort of dynamically changed zero line, early levels up and down and trend confirmation levels up and down. By adding these non-fixed levels, the MACD becomes faster in response to market changes and the MACD trend assessment has less false signals.
Asymmetric bands
Asymmetric bands indicator is one of the ways to avoid a lag when there is a trend reversal (since the opposite side band is too far from the current price).
Smoother momentum
Smoother momentum is one of the possible ways to solve the main issue of the Momentum indicator - the values it displays are far from being smooth, and that can cause a lot of false signals in a lot of cases - regardless of the calculation period that is used.
Sadukey
"Sadukey" indicator is an indicator combining two digital filters on a chart to give us an assessment of current trend.