거래 로봇을 무료로 다운로드 하는 법을 시청해보세요
당사를 Facebook에서 찾아주십시오!
당사 팬 페이지에 가입하십시오
당사 팬 페이지에 가입하십시오
스크립트가 마음에 드시나요? MetaTrader 5 터미널에서 시도해보십시오
- 조회수:
- 10796
- 평가:
- 게시됨:
-
이 코드를 기반으로 한 로봇이나 지표가 필요하신가요? 프리랜스로 주문하세요 프리랜스로 이동
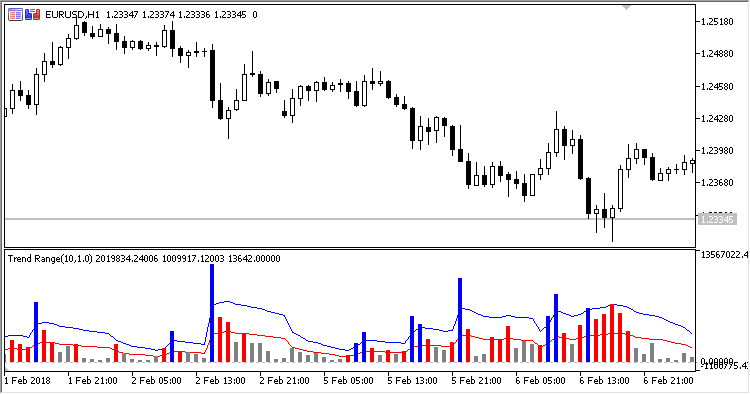
The oscillator indicator draws a histogram (with border levels at two moving averages on the indicator histogram) showing three market states: a trend, a moderate or fading trend and a flat.
- If the histogram bar (blue) is above the upper level (blue line), then there is a strong movement in the market;
- If the histogram bar (red) is between the upper and lower levels (between the blue and red lines), then there is either a moderate or fading trend;
- If the histogram bar (gray) is below the lower level (below the red line), then the market movement is weak and flat.
The indicator has three input parameters:
- Period - calculation period;
- Method - smoothing method;
- Deviation - deviation for the calculation of threshold levels.

MetaQuotes Ltd에서 러시아어로 번역함.
원본 코드: https://www.mql5.com/ru/code/20156
 GapFinder
Gap searching indicator.
 SZO
SZO
SZO (Sentiment Zone Oscillator) is an indicator of market sentiment, which has overbought and oversold zones.
 CCI_Dots
The indicator adds signal marks to a price chart when the CCI indicator crosses its zero line.
 HL_MA_Band
A colored histogram drawn using the High/Low prices.