당사 팬 페이지에 가입하십시오

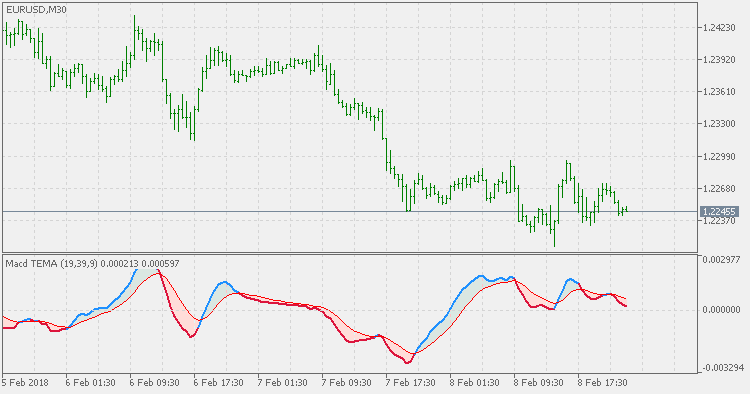
MACD TEMA - MetaTrader 5용 지표

- 조회수:
- 12106
- 평가:
- 게시됨:
-
 이 코드를 기반으로 한 로봇이나 지표가 필요하신가요? 프리랜스로 주문하세요
프리랜스로 이동
이 코드를 기반으로 한 로봇이나 지표가 필요하신가요? 프리랜스로 주문하세요
프리랜스로 이동
In an article "Smoothing Data With Less Lag" that was a continuation of his research for less lag signaling MACD, Patrick Mulloy decided to use TEMA (Triple Exponential Moving Average) instead of using EMA.
Patrick Mulloy: Two opposing properties are always at work in the standard Moving Average smoothing used in technical analysis, increasing the Moving Average (MA) length to cull more random fluctuations but in so doing thereby increasing the lag between the MA and the data. In my first article, I discussed the industry standards, the Simple Moving Average (SMA, which is a straightforward moving mean of the data) and the faster-responding Exponential Moving Average (EMA). Both the SMA and the EMA smoothing indicators have the same lag in the steady state long term, which is:
where a = 2/(w+1) and w is the Moving Average period. In terms of the MA period w, the lag is:
A new Exponential Moving Average called DEMA was introduced in the previous article, which eliminated this lag for the steady state. Now, here are two other Moving Averages. One is known as TEMA, which is an extension of the multiple smoothing technique using single, double and triple EMAs.
MACD TEMA is even a bit more "faster" than MACD DEMA so, depending on the parameters, in scalping mode (short calculating periods) or trending mode (when longer periods are used. Never forget that MACD is primarily a momentum indicator and that it is the main goal of MACD.
MACD DEMA
MACD that is using DEMA fo calculation.
Smoothed Kijun-Sen
The Kijun-Sen is a major indicator line and component of the Ichimoku Kinko Hyo indicator, also known as the Ichimoku cloud. It is generally used as a metric for medium-term momentum.
TTM trend
The TTM (Trade The Markets) Trend is basically an easier way to look at candlesticks. It is the The Heikin-Ashi method. Literally translated Heikin is "average" or "balance,", while Ashi means "foot" or "bar." The TTM trend is a visual technique that eliminates the irregularities from a normal candlestick chart and offers a better picture of trends and consolidations.
Directional Efficiency Ratio
The Efficiency Ratio (ER) was first presented by Perry Kaufman in his 1995 book "Smarter Trading". It is calculated by dividing the price change over a period by the absolute sum of the price movements that occurred to achieve that change. The resulting ratio ranges between 0 and 1 with higher values representing a more efficient or trending market.