당사 팬 페이지에 가입하십시오

Vector - MetaTrader 5용 지표
- 조회수:
- 8042
- 평가:
- 게시됨:
-
 이 코드를 기반으로 한 로봇이나 지표가 필요하신가요? 프리랜스로 주문하세요
프리랜스로 이동
이 코드를 기반으로 한 로봇이나 지표가 필요하신가요? 프리랜스로 주문하세요
프리랜스로 이동
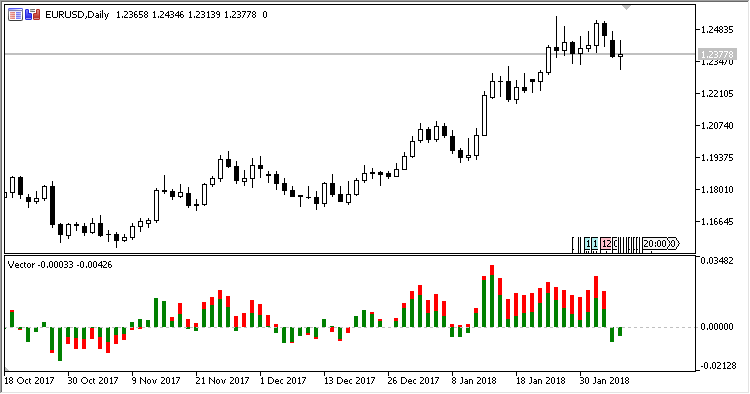
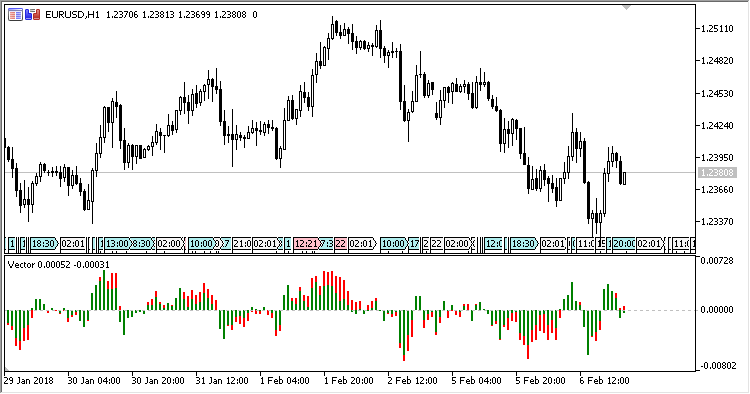
The Vector indicator tracks the market state and generates relatively few false signals. Signals are formed when the zero line is crossed.
The indicator has two oscillators - the fast and the slow one. The total of their values allows evaluating the mood of the market.
- If the fast (green) vector completely blocks the slow (red) one, this indicates the beginning of a new trend formation;
- If the slow (red) oscillator begins to prevail over the fast (green) one, this indicates a slowdown of the trend, which, however, may continue to fade for some time;
The market inertia is represented by a slow oscillator, and the trends are represented by the fast one.
The combined values of the two oscillators provide a picture of the market, which is sufficient for making a decision to buy/sell or to close existing positions.
The indicator has two input parameters:
- Inertia osc color - the color of the inertia oscillator;
- Trend osc color - the color of the trend oscillator.
MetaQuotes Ltd에서 러시아어로 번역함.
원본 코드: https://www.mql5.com/ru/code/19962
Patterns
A set of thirty popular candlestick patterns.
Other_Candles
The indicator draws candlesticks in a separate window in the form of a histogram from the zero line.
 TrailingStopAndTake
Simple trailing of stop loss and take profit orders of open positions.
Invest System 4.5
A trading system based on the account balance and the result of the last trade.