당사 팬 페이지에 가입하십시오

Derivative - MetaTrader 4용 지표

- 조회수:
- 18228
- 평가:
- 게시됨:
- 업데이트됨:
-
 이 코드를 기반으로 한 로봇이나 지표가 필요하신가요? 프리랜스로 주문하세요
프리랜스로 이동
이 코드를 기반으로 한 로봇이나 지표가 필요하신가요? 프리랜스로 주문하세요
프리랜스로 이동
In mathematics, the value of the derivative is calculated according to the following simple formula:
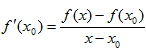 , (1)
, (1)
Where:
- x0 — current value of the argument,
- x — value of the argument to the right of the chart,
- f(x0) — value of the function at point x0,
- f(x) — value of the function at point х.
In the original definition the difference between x and x0 is infinitesimal, i.e. the limit of the function is used. Using the formula (1), it is possible to calculate the approximate value of the derivative using the function values, avoiding direct differentiation.
Regarding the price chart, x0 is the current bar, and x is the upcoming bar, which will be formed after a number of chart periods. Respectively, f(x0) is the price value on the current bar, and f(x) is the price value of the upcoming bar. We find that (1) contains two unknowns — f(x0) and f(x). Since we do not have additional expressions which contain the same two unknowns, the solution of equation (1) in this case is absent.
Known values must be taken as f(x) and f(x0) to make it possible to find the derivative f'(x0). For that purpose, it is necessary to take a point to the left of the current bar as x0, and to designate the current bar as x. As a result, f(x0) and f(x) become certain values (prices at points x and x0 correspond to the price values visible on the chart).
Although, the calculated value will characterize an area already known to a trader, in which the price growth or fall can be judged without the help of the derivative. In this case the useful information is not just the value of the derivative, but the comparison of two values of the derivative at adjacent bars. In case the signs of the calculated values are different the price had passed an extremum. The type of the extremum can be easily determined using the combination of signs: transition from a negative value to a positive value is minimum, positive to negative — maximum.
The described principle of calculation of a derivative is implemented in the Derivative indicator. As a result, it displays the difference of prices between the examined bar and the bar spaced from the examined one by a number of bars set in the "Delay" parameter.
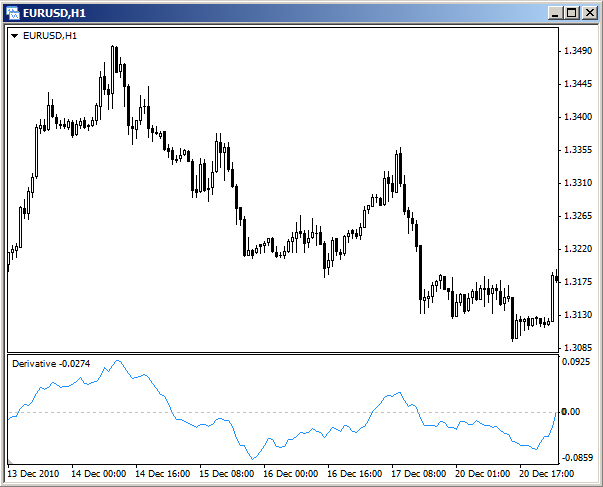
The easiest way to use the indicator is this: the line crosses the zero level from below — you should buy, from above — you should sell.
MetaQuotes Ltd에서 러시아어로 번역함.
원본 코드: https://www.mql5.com/ru/code/13785
Detection of the divergences
The lookup and display of the divergences of different classes based on the data of the base indicator.
 OrderTimeAlert
The Expert Advisor watches the market orders and generates a sound signal after a predefined time from the moment of order opening.
Road Map
The indicator displays the series of waves, breakthrough points and targets for Take Profit.
Price Channel Central
The channel indicator. It also displays the current channel levels as price labels and the type of the signal for making trading decisions.