당사 팬 페이지에 가입하십시오

Easy Trend Visualizer - MetaTrader 4용 지표

- 조회수:
- 30008
- 평가:
- 게시됨:
- 업데이트됨:
-
 이 코드를 기반으로 한 로봇이나 지표가 필요하신가요? 프리랜스로 주문하세요
프리랜스로 이동
이 코드를 기반으로 한 로봇이나 지표가 필요하신가요? 프리랜스로 주문하세요
프리랜스로 이동
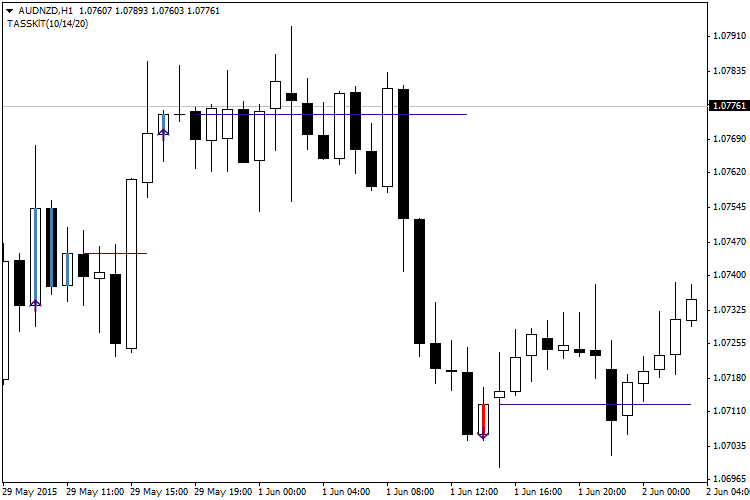
Easy Trend Visualizer — a simple visualizer of trends. This indicator does exactly what its name says. It shows where the trend starts and ends and where the trend is absent at all.
It is based on standard ADX (Average Direction Movement Index) indicators and works quite fast. Easy Trend Visualizer is displayed in the main chart window.
Input Parameters:
- ADXperiod1 (default = 10) — period of the first ADX indicator.
- ADXperiod2 (default = 14) — period of the second ADX indicator.
- ADXperiod3 (default = 20) — period of the third ADX indicator.
- UseAlert (default = false) — if true, generates signals when starting to plot the horizontal line.
Recommendations:
- Unfortunately, this indicator redraws on the current bar, so it can not be used to enter the position at the current bar. The previous bars are not redrawn and can be used as signals for entry. Although this is a fairly accurate indicator, it also generates a lot of false signals, but with the help of moderate levels of stop loss it is possible to avoid serious losses. It is also important to exit the position immediately after the trend ends.
MetaQuotes Ltd에서 러시아어로 번역함.
원본 코드: https://www.mql5.com/ru/code/13182
Dots
The indicator shows current trend direction by placing colored dots on the main chart.
WRB
The indicator detects and marks the WRB (Wide Range Bars) or candlesticks with Wide Range Bodies.
GainLossInfo
Shows the current gain and loss for the candlesticks on the chart.
 HAN
HAN
The Heiken Ashi Naive Expert Advisor is based on the Heiken Ashi candle chart system and uses the standard indicator of the same name.