당사 팬 페이지에 가입하십시오

- 조회수:
- 14790
- 평가:
- 게시됨:
- 업데이트됨:
-
 이 코드를 기반으로 한 로봇이나 지표가 필요하신가요? 프리랜스로 주문하세요
프리랜스로 이동
이 코드를 기반으로 한 로봇이나 지표가 필요하신가요? 프리랜스로 주문하세요
프리랜스로 이동
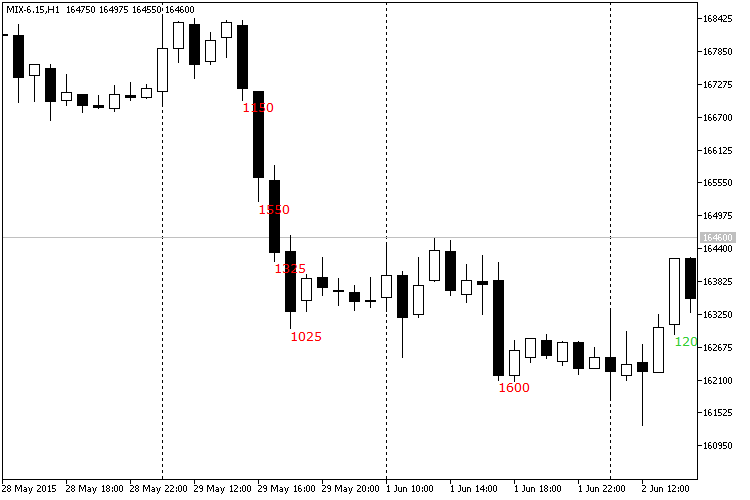
Shows the current gain and loss for all candlesticks exceeding the specified threshold. Values are calculated in percentages and points.
The indicator can calculate gain/loss in two modes: simple difference between Open and Close prices, difference between current Close and previous Close. The user can set minimum threshold (in points and percent), change the calculation mode and control the font color for displayed values.
Input Parameters:
- PercentageLimit (by default = 1.0) — threshold for displaying the change in percentage points.
- PipsLimit (by default = 1000) — threshold for displaying the change in broker points.
- CloseToClose (by default = true) — if true, the indicator will compare the current Close price with the previous Close price, if false — with the current Open price.
- DisplayLossColor (by default = Red) — color for negative changes (losses).
- DisplayGainColor (by default = Green) — color for positive changes (gains).
- DisplayDistance (by default = 100) — distance from the Maximum price of a candlestick to the displayed gain/loss value in broker points.
- MaxBars (by default = 100) — maximum number of bars to process. The higher this value, the slower the indicator will work.
Recommendations:
- It is almost impossible to use this indicator for getting trade signals. Its mainly intended to simplify the market analysis and to make it easier to find certain bullish or bearish patterns. Of course, everyone can try to use abnormally big changes as signals to open or close positions.
MetaQuotes Ltd에서 러시아어로 번역함.
원본 코드: https://www.mql5.com/ru/code/13185
 Easy Trend Visualizer
A simple visualizer of trends.
Dots
The indicator shows current trend direction by placing colored dots on the main chart.
 HAN
HAN
The Heiken Ashi Naive Expert Advisor is based on the Heiken Ashi candle chart system and uses the standard indicator of the same name.
Price Alert
Plays sound alerts when the price reaches certain levels, specified by trader.