당사 팬 페이지에 가입하십시오
- 조회수:
- 9236
- 평가:
- 게시됨:
- 업데이트됨:
-
이 코드를 기반으로 한 로봇이나 지표가 필요하신가요? 프리랜스로 주문하세요 프리랜스로 이동
Original author:
Vitalie Postolache
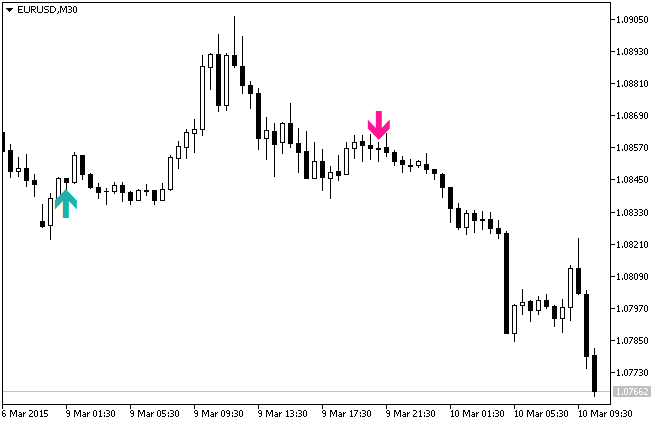
A semaphore signal indicator based in the idea from "325 golden strategies" collection.
Strategy principle:
Buy:
- The closing average calculated by the X day period should be higher than the similar average Y days ago;
- The closing price should be lower than the closing price Y days ago;
- The closing price should be higher than the closing price Y+X days ago. If all three conditions are met, then you should buy at the next day opening;
- The closing price should be lower than the opening price (bearish candlestick).
Sell:
- The closing average calculated by the X day period should be lower than the similar average Y days ago;
- The closing price should be higher than the closing price Y days ago;
- The closing price should be lower than the closing price Y+X days ago.
- The closing price should be higher than the opening price (bullish candlestick).
If all three conditions are met, then you should sell at the next day opening; For example, if Х=20 and Y=3, then the 20-day closing average should be higher (for buying) than the average calculated 3 days ago. It simply means that the 20-day closing average goes up. Next, today's closing price should be lower than the closing price 3 days ago. It helps to determine if there would be a pullback before entering the market.
Finally, the price should also be higher than 23 days ago (even if it is lower than 3 days ago). That way we check for an increasing moving average. The method will work until a turn signal appears or the market goes too far against the position without a turn signal.

Fig. 1. The Simple Trading System indicator
MetaQuotes Ltd에서 러시아어로 번역함.
원본 코드: https://www.mql5.com/ru/code/12580
 HLR_HTF
The HighestLowestRange (HLR) indicator with the timeframe selection option available in the input parameters.
 FATL-SATL Balance
A middle line between the SATL and FATL digital trend filtering indicators.
 Candle Time End and Spread
The indicator displays the current spread and the time till closing the bar (candlestick) at the same time.
 FiboBands_HTF
The FiboBands indicator with the timeframe selection option available in the input parameters.