Ramandeep Singh
Ramandeep Singh
  • 情報
no
経験
9
製品
1
デモバージョン
0
ジョブ
0
シグナル
0
購読者
Algorithmic Trader & MT5 Developer において Traders Mantra
X
I am an algorithmic trader, technical analyst and MT5 tool developer focused on Gold (XAUUSD), Silver and Forex. I have applied Elliott Wave analysis in live markets since 2020, supported by market structure, trendline analysis, momentum, volatility and trading psychology.

At Traders Mantra, I research systematic trading ideas and develop practical MT5 indicators and Expert Advisors. My work focuses on clear trading logic, controlled risk, realistic backtesting and tools that simplify complex price behaviour without making exaggerated promises.

I am the developer of Smart Trendline Detector for MetaTrader 5. I also share product guidance, trading research and educational market insights through my MQL5 blog and channel.
Ramandeep Singh
A screenshot shows what an indicator looked like at one selected moment. A demo helps you examine how it behaves across many moments...
Ramandeep Singh
Ramandeep Singh
A trading tool should not earn trust from one attractive screenshot.
I test an indicator by changing the symbol, timeframe and market condition, then watching what changes when new candles arrive. For risk tools, I manually verify at least one calculation. For analytical tools, I check whether historical objects move, disappear or appear late.
A demo is not merely a preview. Used properly, it is a small controlled experiment.
This is also the right way to evaluate tools such as Trendline Machinegun or Smart Trendline Detector: test the behaviour first, then decide whether it fits your own trading process.
Ramandeep Singh
Ramandeep Singh
A trendline looks obvious after the move. The real test is whether you could have drawn and used it before the breakout.

When I test a trendline indicator, I watch three things:

• When did the line first appear?
• Did its anchor points change as new candles formed?
• Was the breakout visible in real time, or only on the historical chart?

A clean screenshot can’t answer those questions. Forward testing can.

What do you check first when testing a trendline indicator?
Ramandeep Singh
A candle closing outside a price envelope attracts attention. It does not, by itself, tell us whether the move will continue or reverse. TM Price Stretch Map is a free MetaTrader 5 indicator built around a simple sequence: stretch, return inside, then assess the trade...
Ramandeep Singh
Ramandeep Singh
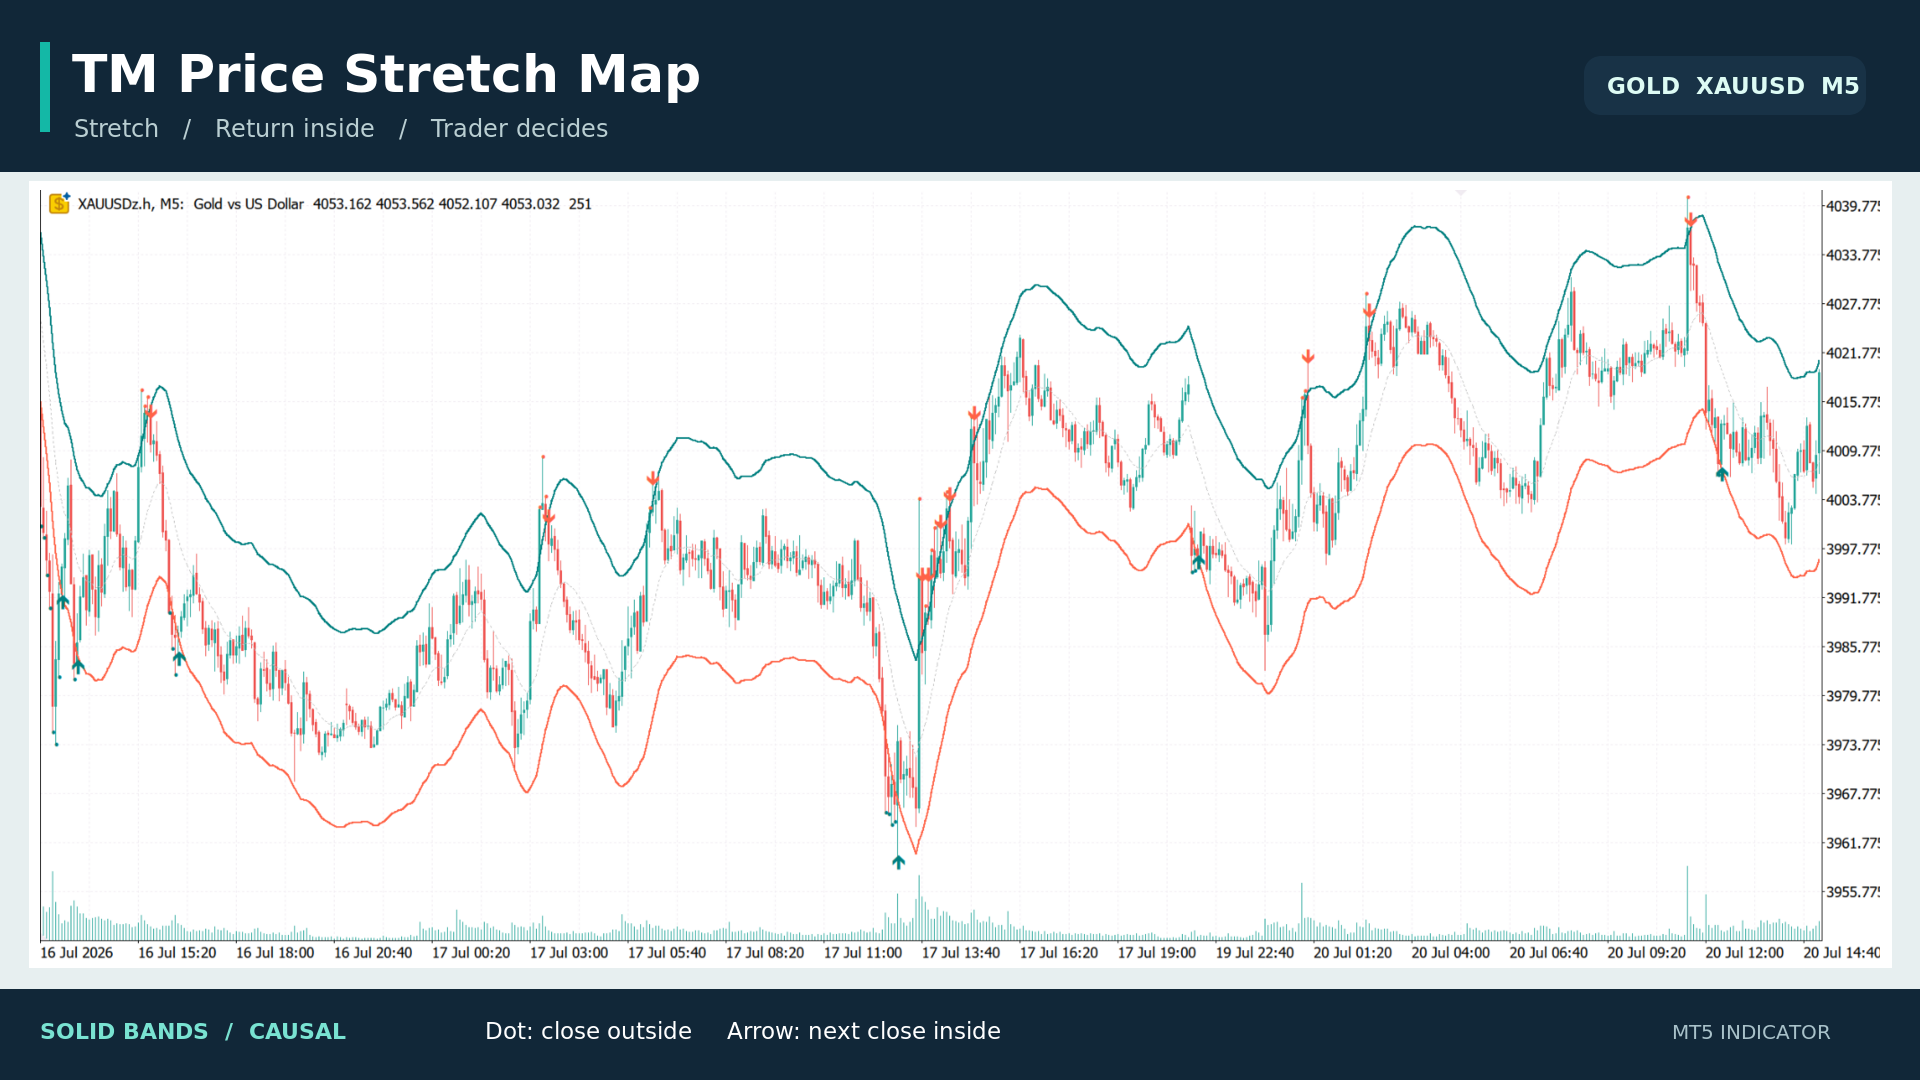
Introducing TM Price Stretch Map, my free indicator for MetaTrader 5.

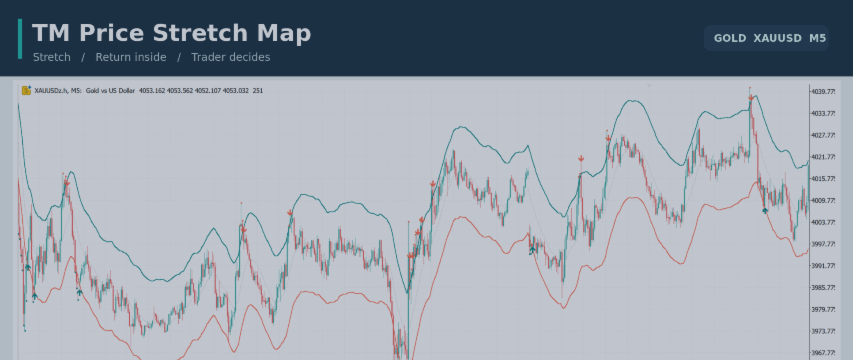
The idea is simple: first spot a candle that closes beyond the price envelope. Then watch whether the next completed candle closes back inside. Small dots mark the stretch; arrows mark the return.

The solid bands and markers use prices available at the time of each candle. There is also an optional dashed smoothing overlay for visual analysis, which can repaint. It does not generate the markers.

A return inside the bands is a setup to examine, not an automatic trade. I use it alongside market structure, trend and risk management.

https://www.mql5.com/en/market/product/197922

Search for “TM Price Stretch Map” in my MQL5 Market products to download it free. I’d be interested to hear which symbol and timeframe you try it on.
Ramandeep Singh パブリッシュされたプロダクト

TM Price Stretch Map は、ローソク足の終値がバンドの外に出た後、次の確定足がバンド内に戻ったかどうかをチャート上に表示します。 実線のバンドは、その時点までに利用可能な価格だけを使う因果的なガウスカーネル計算に基づきます。上側バンドを超えて確定した足には赤い点、下側バンドを下回って確定した足には青緑の点を表示します。その次の確定足が両バンドの内側に戻ると、上側からの戻りには下向き矢印、下側からの戻りには上向き矢印を表示します。点と矢印は実線バンドだけで判定します。 任意の破線バンドは過去をさかのぼって平滑化するため、新しい足によって過去の線がリペイントされることがあります。破線は表示専用で、点や矢印の判定には使用しません。帯域幅、バンド幅、価格ソース、表示履歴、色、中心線、マーカーを設定できます。自動売買は行わず、反転を保証するものでもありません。

Ramandeep Singh
TM Untapped Levels Oscillator for MT5 – See Market Pressure Beyond Price Markets constantly leave behind unfinished price interaction...
Ramandeep Singh
Ramandeep Singh
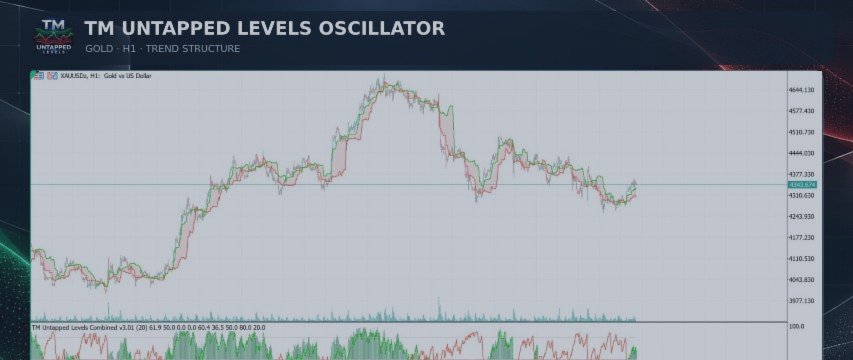
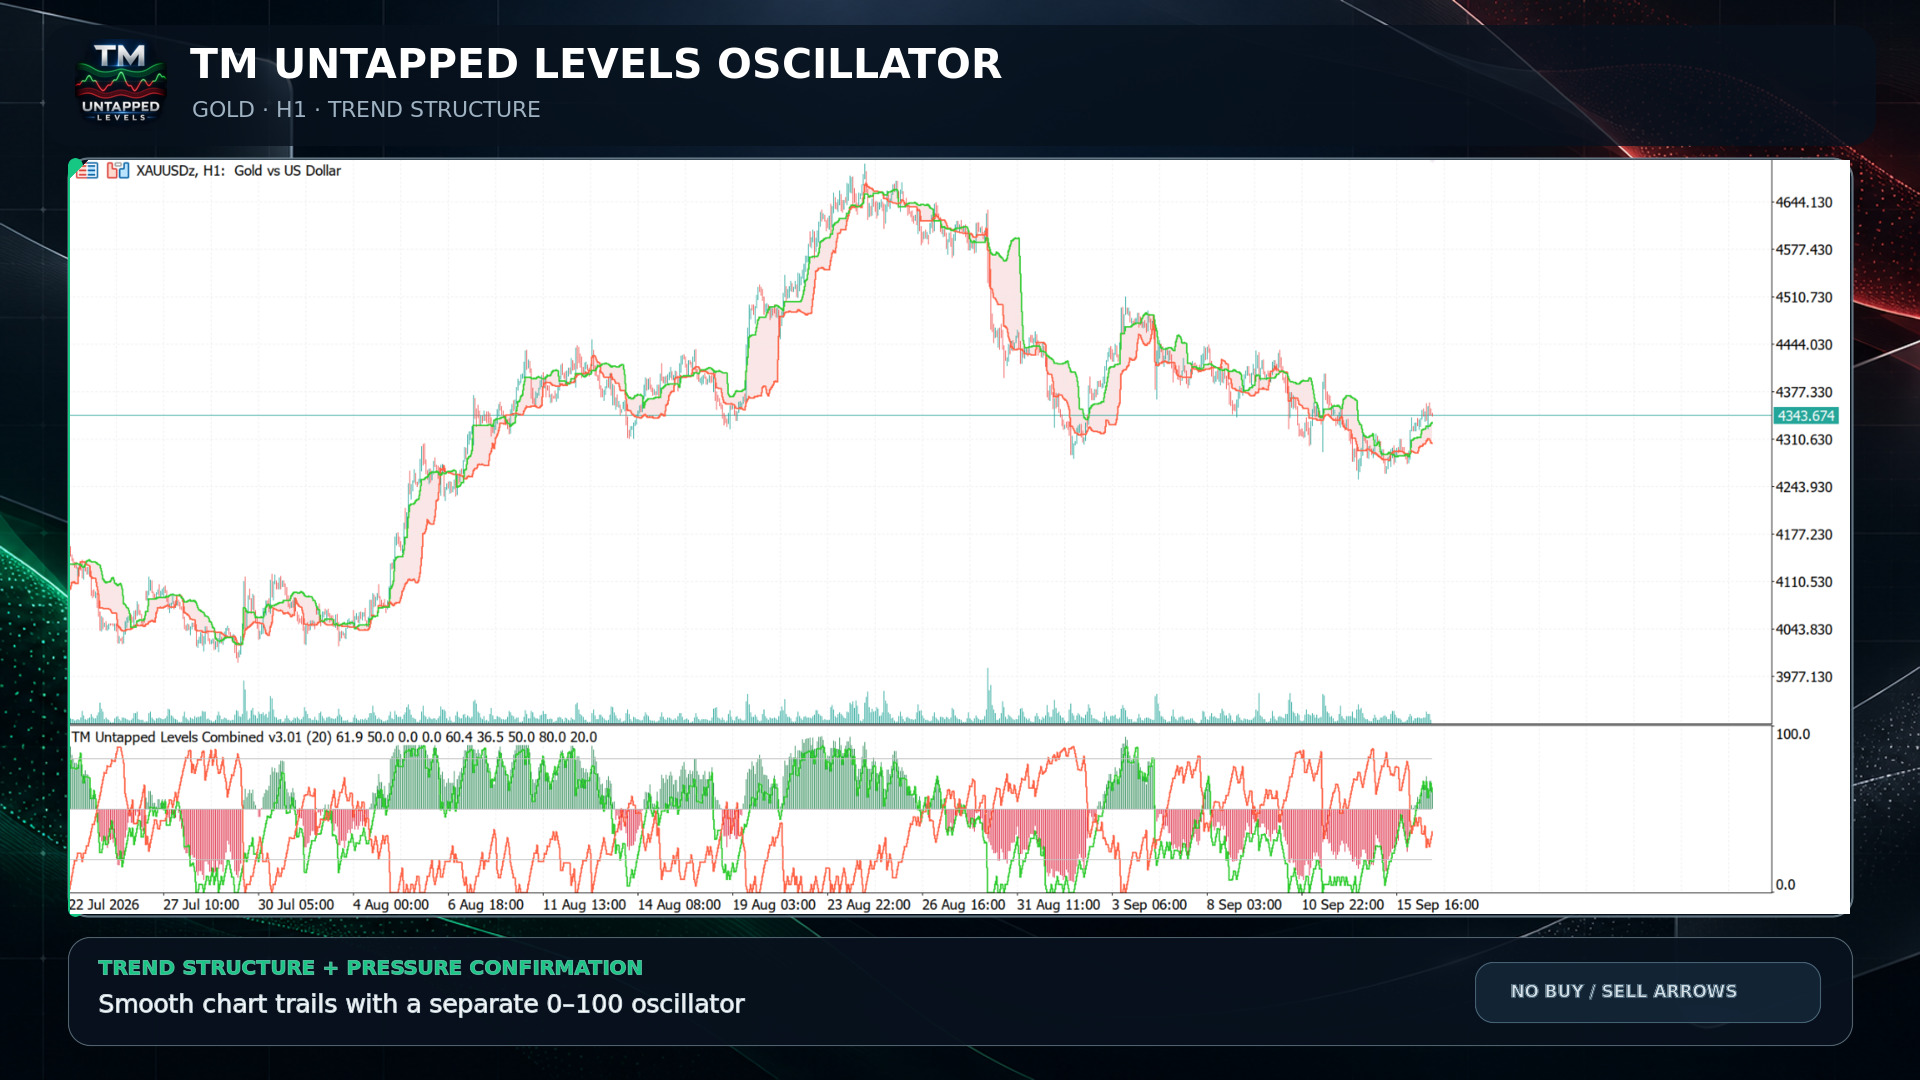
TM Untapped Levels Oscillator is a dual-display market pressure indicator for MetaTrader 5. It combines a clear oscillator panel with smooth trailing levels directly on the main price chart.

The indicator tracks prior highs and lows that remain untapped by later price action. Their persistence is converted into bullish and bearish pressure scores from 0 to 100. This helps traders see which side of the market is retaining more unresolved structure without covering the chart with buy and sell arrows.

KEY FEATURES

• Bullish and bearish pressure lines
• Centered two-color histogram around the 50 balance level
• Adjustable upper and lower reference thresholds
• Smooth upper and lower trailing levels on the main chart
• Optional shaded chart zone between the trails
• Up to 1,500 overlay bars displayed by default
• Quality-weighted scoring using level age and ATR-normalized distance
• Optional popup, push, email and sound alerts
• No buy or sell arrows on the chart
• Works on all symbols and timeframes


Download it for FREE
https://www.mql5.com/en/market/product/196347
Ramandeep Singh パブリッシュされたプロダクト

TM Untapped Levels Oscillator は、MetaTrader 5 用のデュアル表示型マーケットプレッシャー指標です。見やすい独立オシレーターと、メインチャート上の滑らかな動的トレールラインを組み合わせています。 この指標は、その後の価格によってまだ到達されていない過去の高値と安値を追跡します。それらの持続性を 0 から 100 の強気・弱気プレッシャースコアに変換し、売買矢印でチャートを混雑させることなく、どちら側に未解決の価格構造が多く残っているかを確認できます。 主な機能 • 強気および弱気プレッシャーライン • 50 のバランスラインを中心とした2色ヒストグラム • 調整可能な上限・下限レベル • メインチャート上の滑らかな上部・下部トレール • トレール間のオプション陰影ゾーン • 初期設定で最大1500本の履歴バーを表示 • レベルの経過時間と ATR 正規化距離による加重スコア • ポップアップ、プッシュ、メール、サウンド通知 • チャート上に売買矢印を表示しない設計 • すべての銘柄と時間足に対応 見方

Ramandeep Singh パブリッシュされたプロダクト

TM Volatility Scalping Edge は、継続的に大量のシグナルを表示するのではなく、厳選された分かりやすいスキャルピング機会を求めるトレーダー向けに開発された、MetaTrader 5 用の適応型ボラティリティインジケーターです。 このインジケーターは、ATRベースのボラティリティ、価格と動的ボラティリティ境界線との関係、方向性圧力、および市場の反復的な動きを分析します。必要な条件が一致すると、緑色またはオレンジ色の矢印で潜在的な上昇・下降セットアップを表示します。 上下の適応型バンドは、市場のボラティリティに応じて自動的に拡大・縮小します。そのため、静かな相場、通常の相場、活発な相場環境に対応できます。 チャート上のダッシュボードには以下が表示されます。 • 現在のボラティリティ状態 • ATR値 • 上方向および下方向へのブレイク率 • いずれかの方向へのブレイク確率 • 反復的な値動きの確率 • 反復優位性 • 現在の市場活動 • 中立・強気・弱気の市場判断 主な機能: • 厳選された上昇・下降矢印 • 適応型ボラティリティバンド • ATRベースの市場分析

Ramandeep Singh
Understanding Liquidity and Market Structure with TM Liquidity Compass Market structure and liquidity are closely connected. Price frequently moves from one liquidity area toward another, while structural changes help traders understand whether buyers or sellers currently have greater influence...
Ramandeep Singh
Ramandeep Singh
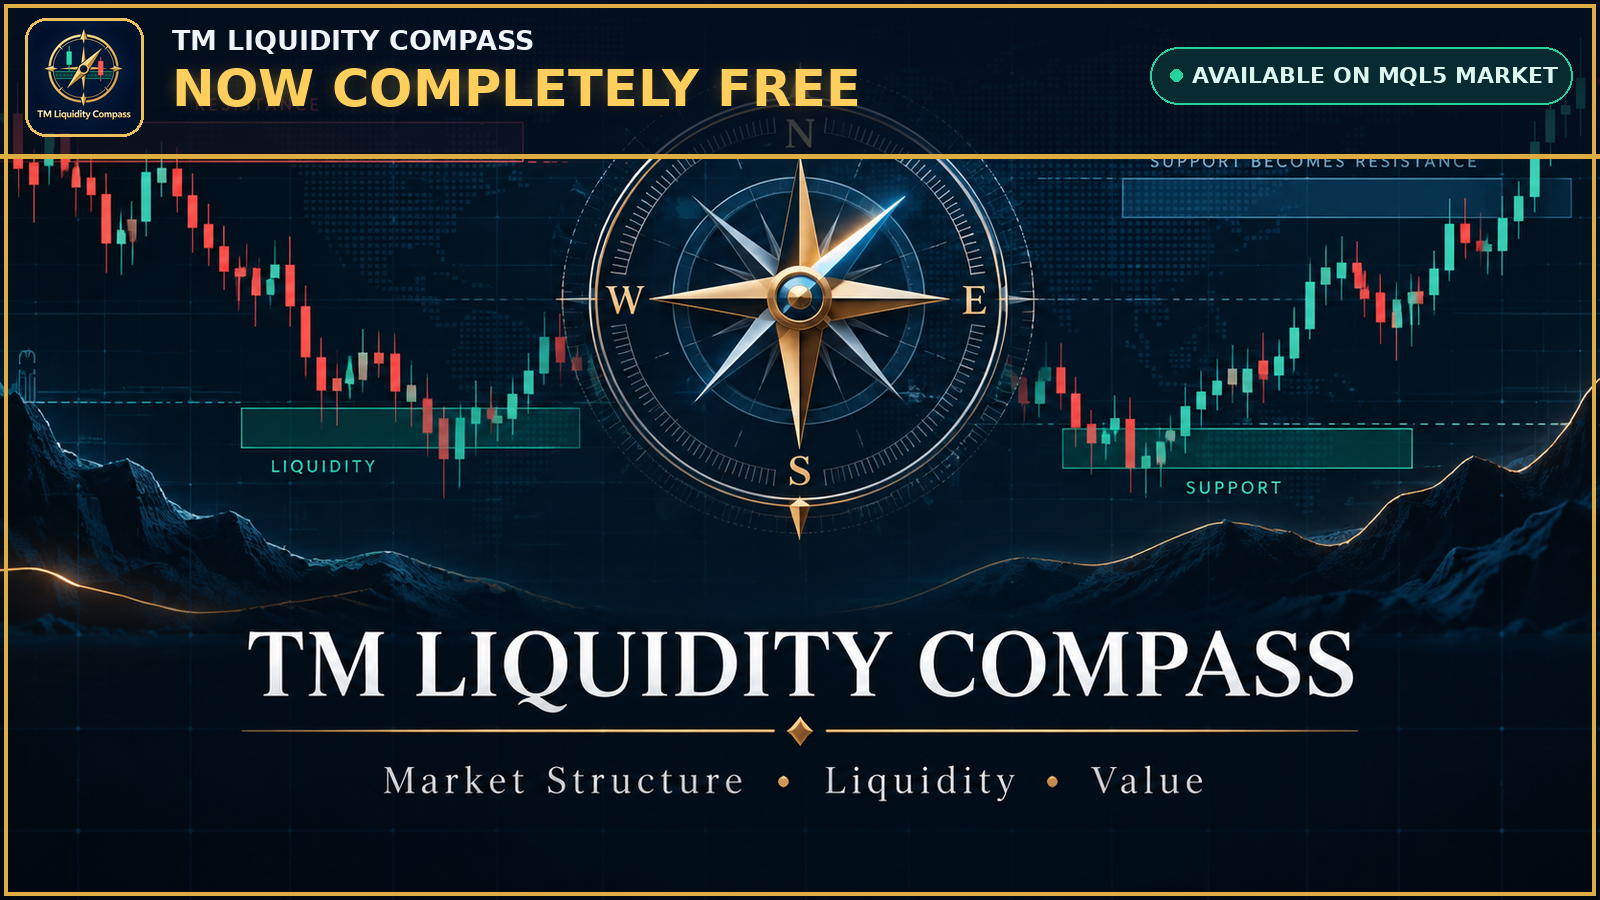
TM Liquidity Compass is now completely FREE on the MQL5 Market.

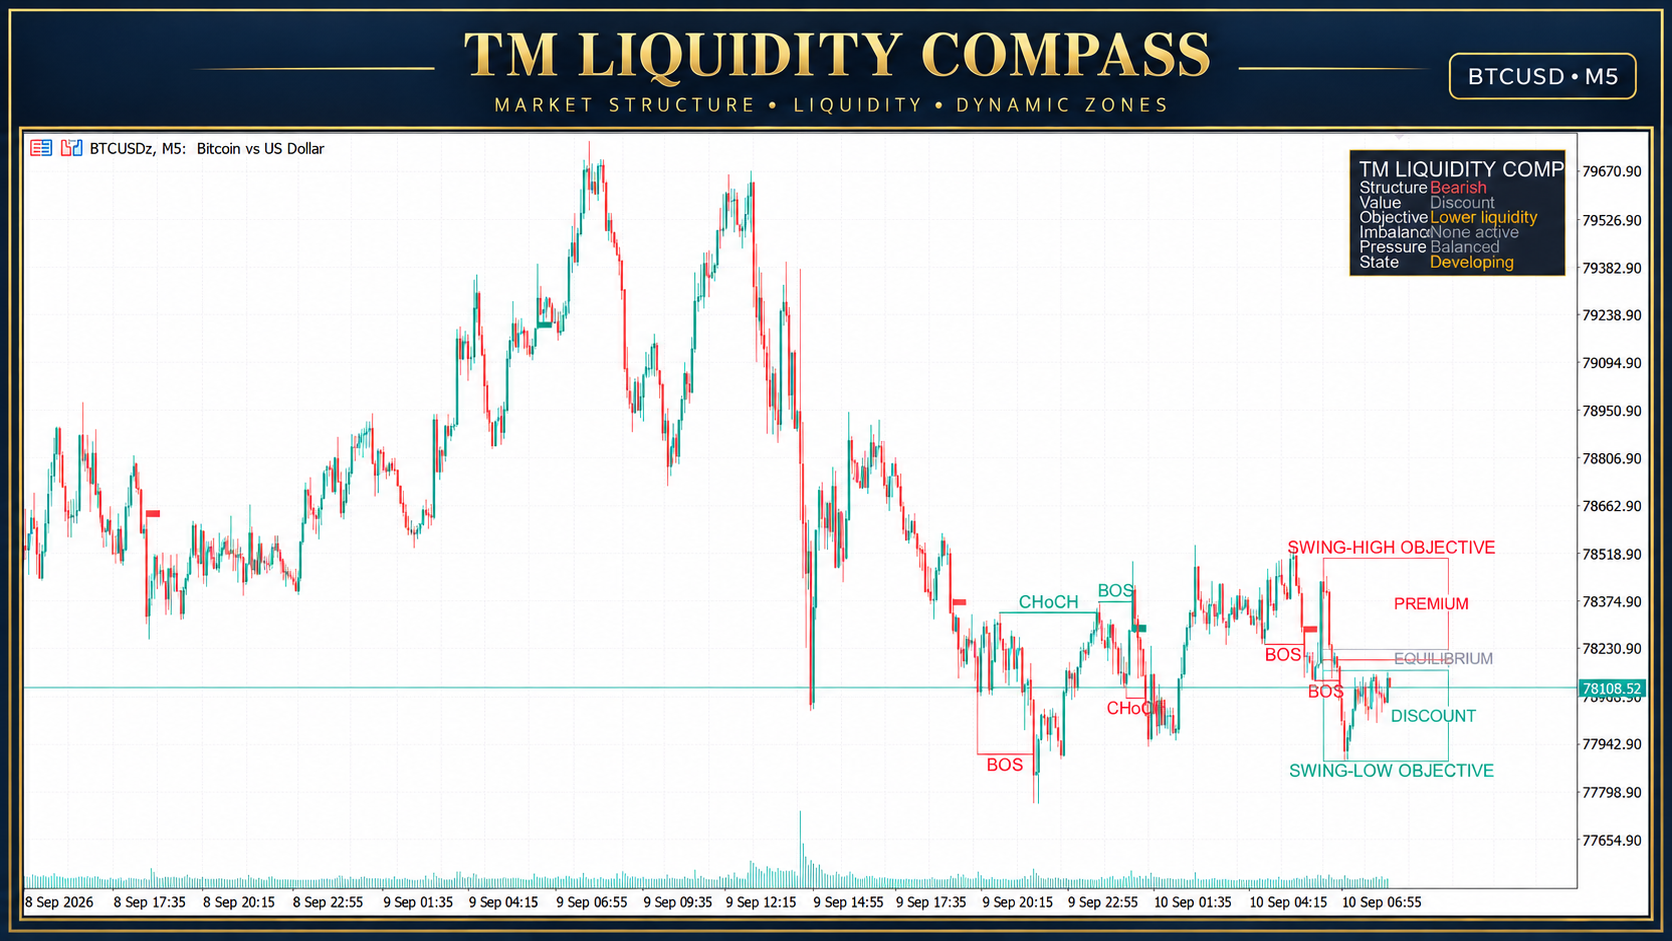
The indicator brings market structure and liquidity information together in one clear chart view:

• BOS and CHoCH
• Active bullish or bearish market bias
• Premium, equilibrium and discount areas
• Nearest upper and lower liquidity objectives
• Qualified imbalance and FVG areas
• One dynamic dominant support or resistance zone
• Compact Buyers, Sellers or Balanced pressure dashboard

TM Liquidity Compass is an analytical indicator for MetaTrader 5. It does not open, manage or close trades automatically.

Download it FREE:

https://www.mql5.com/en/market/product/195174

You can also open the MetaTrader 5 Market and search for “TM Liquidity Compass.”
Ramandeep Singh
How to Read Market Structure and Liquidity with TM Liquidity Compass A trading chart can contain dozens of signals, zones and technical labels. The real challenge is not finding more information—it is understanding which information matters now...
Ramandeep Singh
Ramandeep Singh
Introducing TM Liquidity Compass for MetaTrader 5.

TM Liquidity Compass brings market structure, liquidity context and value mapping together in one clean chart-based indicator.

Main features:

• Confirmed BOS and CHoCH structure markings
• Green and red trade-confirmation bands
• Premium, equilibrium and discount areas
• Upper and lower liquidity objectives
• One dynamic dominant support or resistance zone
• Qualified imbalance detection
• Compact market-context dashboard
• Adjustable visual and calculation settings

The dominant zone automatically adapts as market conditions change. Strong support is displayed in green and strong resistance in red. When a zone is breached or weakened, it is removed and replaced by a new qualifying area.

The indicator is designed to provide organized market context without overcrowding the chart.

TM Liquidity Compass is currently being prepared for release on the MQL5 Market.

This is an analytical tool and does not guarantee trading results. Always apply your own analysis and risk-management rules.

#MetaTrader5 #MQL5 #MarketStructure #Liquidity #BOS #CHoCH #TradingIndicator
Ramandeep Singh パブリッシュされたプロダクト

TM Liquidity Compass は、MetaTrader 5 のチャート上で市場構造と流動性を分析するインジケーターです。 確定した BOS と CHoCH、プレミアム・均衡・ディスカウントの領域、近接する流動性目標、条件を満たしたインバランス、そして動的に選択される1つの主要サポートまたはレジスタンスゾーンをまとめて表示します。コンパクトなパネルには、現在の構造、価値領域、目標、インバランス、圧力、市場状態が表示されます。 主な機能: 確定済みの BOS と CHoCH の構造表示 緑と赤の取引確認バンド プレミアム・均衡・ディスカウントのバリューマップ 上側および下側の流動性目標 動的な主要サポートまたはレジスタンスゾーンを1つ表示 構造方向による任意フィルター付きインバランス検出 過去データ計算と調整可能な表示設定 強気の CHoCH はロング候補を準備し、その後の強気 BOS がロング表示を確定して短い緑色のバンドを描画します。弱気の CHoCH はショート候補を準備し、その後の弱気 BOS がショート表示を確定して短い赤色のバンドを描画します。

Ramandeep Singh
TM QuantShift Regime Matrix: A Smarter Market Regime Indicator for MT5 Markets rarely move in one consistent condition. A clean bullish trend can lose momentum and become a range. A quiet market can suddenly enter a volatile phase...
Ramandeep Singh
Ramandeep Singh
Introducing **TM QuantShift Regime Matrix** — now available on the MQL5 Market.

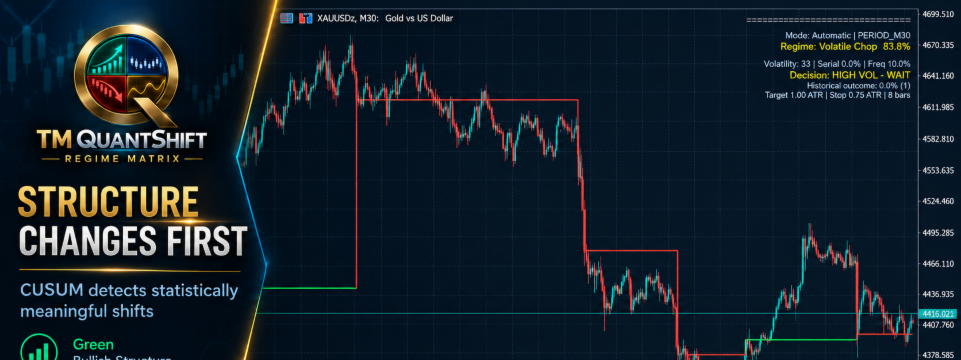
Markets do not behave the same way all the time. They transition between bullish trends, bearish trends, ranges and volatile conditions. QuantShift is designed to identify these structural changes and display each detected regime through clean, colour-coded levels directly on the chart.

Key features:

• Adaptive change-point detection
• Bullish, bearish, ranging and volatile-regime classification
• Clear regime-level visualization
• Automatic symbol and timeframe adaptation
• Suitable for Forex, Gold, Silver, Oil, indices and cryptocurrencies
• Particularly useful on M30 and H1
• No distracting BUY or SELL arrows

TM QuantShift Regime Matrix is a market-analysis tool—not an automated trading system. It helps traders understand when the character of the market may be changing before applying their own entry strategy and risk management.

**See the shift. Understand the regime. Trade with context.**

https://www.mql5.com/en/market/product/194664

#MQL5 #MetaTrader5 #TradingIndicator #MarketRegime #TechnicalAnalysis #ForexTrading #GoldTrading #AlgorithmicTrading #TradingMantra
Ramandeep Singh パブリッシュされたプロダクト

TM QuantShift Regime Matrix は、MetaTrader 5 向けの適応型マーケット状態分析インジケーターです。通常の価格ノイズに埋もれやすい重要な市場行動の変化を、チャート上で明確に把握できるよう設計されています。 本インジケーターは、3つの定量分析エンジンを組み合わせています。 1. 変化点検出 CUSUM エンジンが標準化された価格リターンと累積方向圧力を分析し、意味のある市場構造の変化を検出します。 2. 確率的マーケットレジーム 価格方向、値動きの効率性、ボラティリティ特性を評価し、強気、弱気、レンジ、高ボラティリティの各市場状態を推定します。 3. ATR ボラティリティ持続性 大きな価格変動が一時的な事象なのか、継続するボラティリティ拡大の一部なのかを測定します。 表示の読み方 緑色のライン区間は強気の構造的圧力、赤色の区間は弱気の構造的圧力を表します。中立色の区間は、明確な方向性がまだ形成されていない状態です。中央の階段状ラインは、直近の構造変化が検出された価格水準を示します。周囲の圧力ラインは、正および負の統計的圧力の蓄積を表示します。

Ramandeep Singh
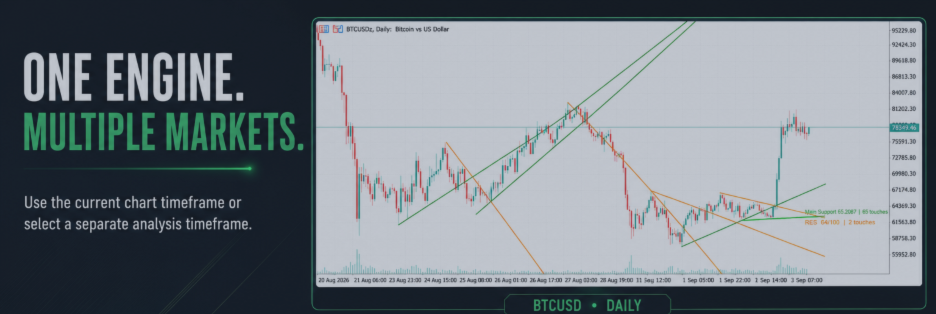
Automatic Trendline Analysis for MT5: Introducing Trendline MachineGun Trendlines are among the most widely used tools in technical analysis. They help traders identify market direction, dynamic support, dynamic resistance, breakout areas and possible zones of confluence...
Ramandeep Singh
Ramandeep Singh
Trendline MachineGun MT5 is now available.

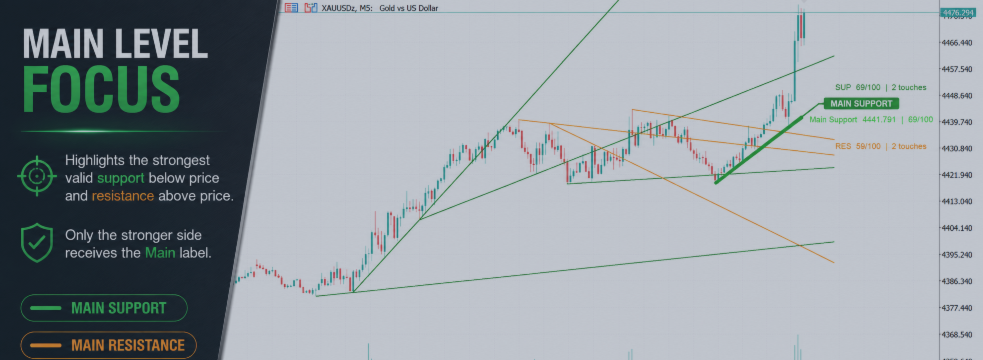
A professional MT5 indicator designed to automatically detect, rank and display meaningful support and resistance trendlines.

Key features:

• Automatic support and resistance trendlines
• Strength scores from 0 to 100
• Historical touch analysis
• Similar-line filtering
• Main Support or Main Resistance identification
• Pressure Zone detection
• Multi-timeframe analysis
• Clean display with only three principal labels

Instead of treating every trendline equally, Trendline MachineGun helps bring the strongest current structures into focus.

Explore it on MQL5 Market:

https://www.mql5.com/en/market/product/194003?source=Site+Profile

Trendline MachineGun MT5 is an analytical indicator and does not execute trades.

#MetaTrader5 #MQL5 #Trendlines #TechnicalAnalysis #ForexTrading #TradingIndicator
12