Ramandeep Singh
Ramandeep Singh
  • 信息
不
经验
9
产品
1
演示版
0
工作
0
信号
0
订阅者
Algorithmic Trader & MT5 Developer 在 Traders Mantra
X
I am an algorithmic trader, technical analyst and MT5 tool developer focused on Gold (XAUUSD), Silver and Forex. I have applied Elliott Wave analysis in live markets since 2020, supported by market structure, trendline analysis, momentum, volatility and trading psychology.

At Traders Mantra, I research systematic trading ideas and develop practical MT5 indicators and Expert Advisors. My work focuses on clear trading logic, controlled risk, realistic backtesting and tools that simplify complex price behaviour without making exaggerated promises.

I am the developer of Smart Trendline Detector for MetaTrader 5. I also share product guidance, trading research and educational market insights through my MQL5 blog and channel.
Ramandeep Singh
A screenshot shows what an indicator looked like at one selected moment. A demo helps you examine how it behaves across many moments...
Ramandeep Singh
Ramandeep Singh
A trading tool should not earn trust from one attractive screenshot.
I test an indicator by changing the symbol, timeframe and market condition, then watching what changes when new candles arrive. For risk tools, I manually verify at least one calculation. For analytical tools, I check whether historical objects move, disappear or appear late.
A demo is not merely a preview. Used properly, it is a small controlled experiment.
This is also the right way to evaluate tools such as Trendline Machinegun or Smart Trendline Detector: test the behaviour first, then decide whether it fits your own trading process.
Ramandeep Singh
Ramandeep Singh
A trendline looks obvious after the move. The real test is whether you could have drawn and used it before the breakout.

When I test a trendline indicator, I watch three things:

• When did the line first appear?
• Did its anchor points change as new candles formed?
• Was the breakout visible in real time, or only on the historical chart?

A clean screenshot can’t answer those questions. Forward testing can.

What do you check first when testing a trendline indicator?
Ramandeep Singh
A candle closing outside a price envelope attracts attention. It does not, by itself, tell us whether the move will continue or reverse. TM Price Stretch Map is a free MetaTrader 5 indicator built around a simple sequence: stretch, return inside, then assess the trade...
Ramandeep Singh
Ramandeep Singh
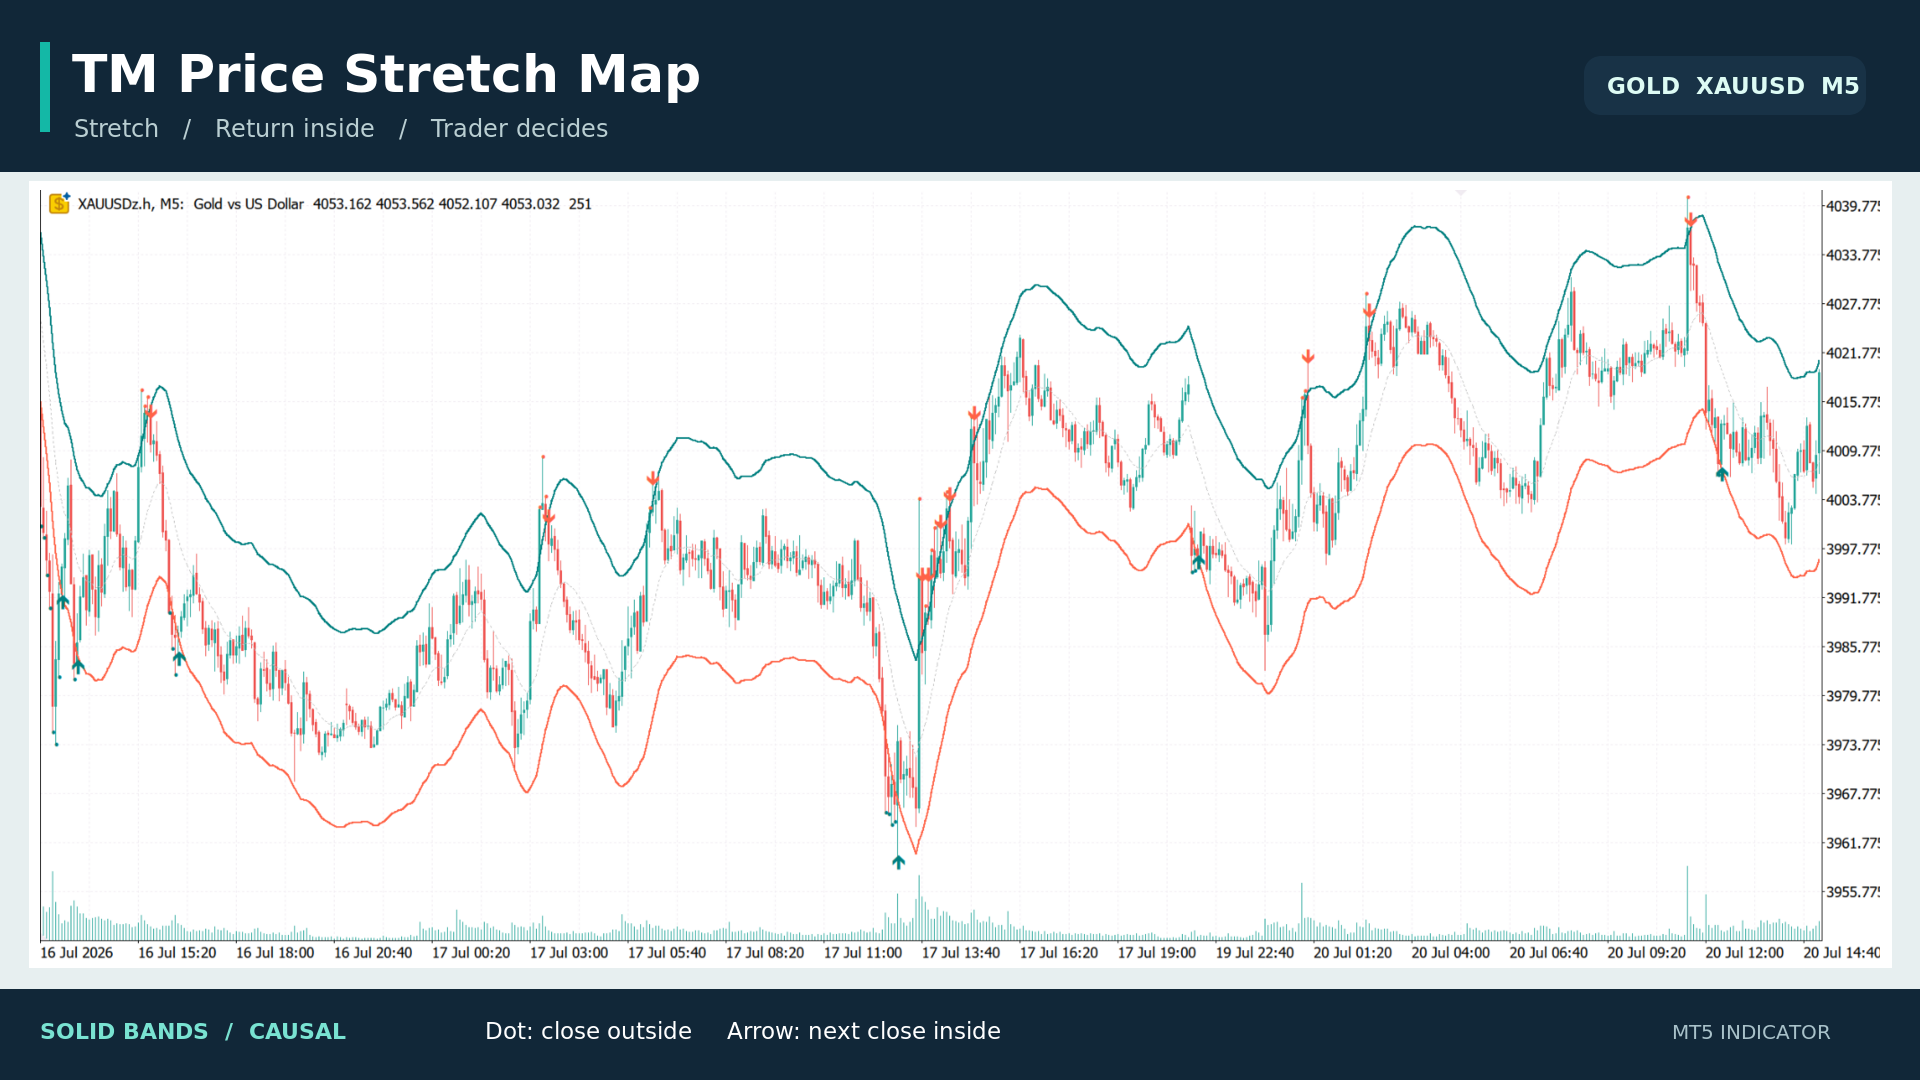
Introducing TM Price Stretch Map, my free indicator for MetaTrader 5.

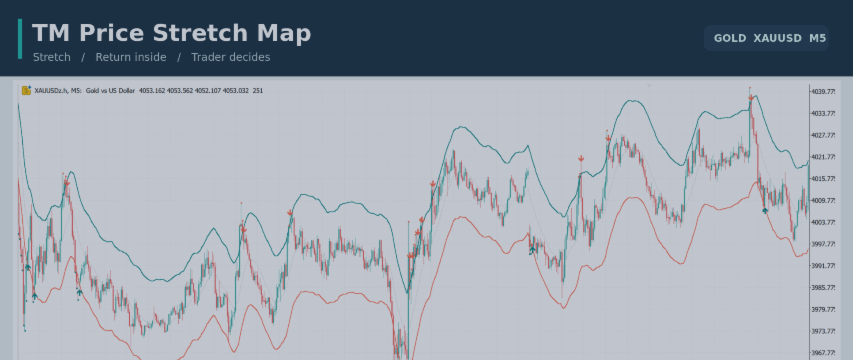
The idea is simple: first spot a candle that closes beyond the price envelope. Then watch whether the next completed candle closes back inside. Small dots mark the stretch; arrows mark the return.

The solid bands and markers use prices available at the time of each candle. There is also an optional dashed smoothing overlay for visual analysis, which can repaint. It does not generate the markers.

A return inside the bands is a setup to examine, not an automatic trade. I use it alongside market structure, trend and risk management.

https://www.mql5.com/en/market/product/197922

Search for “TM Price Stretch Map” in my MQL5 Market products to download it free. I’d be interested to hear which symbol and timeframe you try it on.
Ramandeep Singh 已发布产品

TM Price Stretch Map 在图表上显示价格通道,帮助交易者观察蜡烛图收盘价突破通道后,下一根已收盘蜡烛图是否回到通道内。 实线通道采用因果高斯核计算,仅使用当时已经可用的价格。红点表示蜡烛图收盘价高于上轨,青绿色点表示收盘价低于下轨。若上轨突破后的下一根已收盘蜡烛图收盘价回到两条轨道之间,则显示向下箭头;下轨突破后以同样方式返回时显示向上箭头。圆点和箭头始终依据实线通道计算。 可选的虚线通道采用回顾性平滑,新蜡烛图出现后,其历史曲线可能重绘。虚线仅用于视觉分析,不参与圆点或箭头的计算。带宽、通道宽度、价格来源、历史显示数量、颜色、中线和标记均可设置。本指标不会自动交易,标记也不保证价格反转。

Ramandeep Singh
TM Untapped Levels Oscillator for MT5 – See Market Pressure Beyond Price Markets constantly leave behind unfinished price interaction...
Ramandeep Singh
Ramandeep Singh
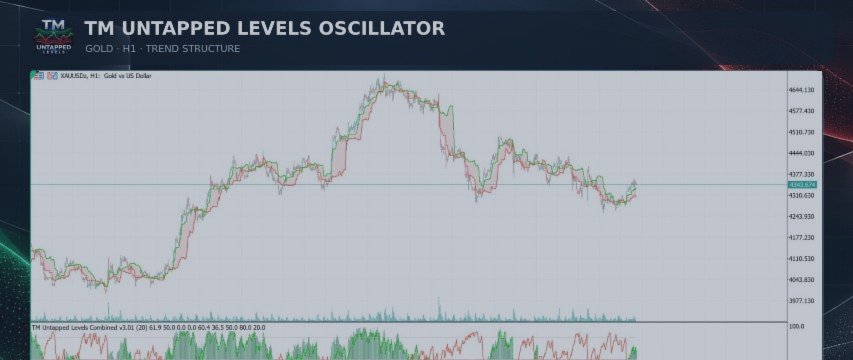
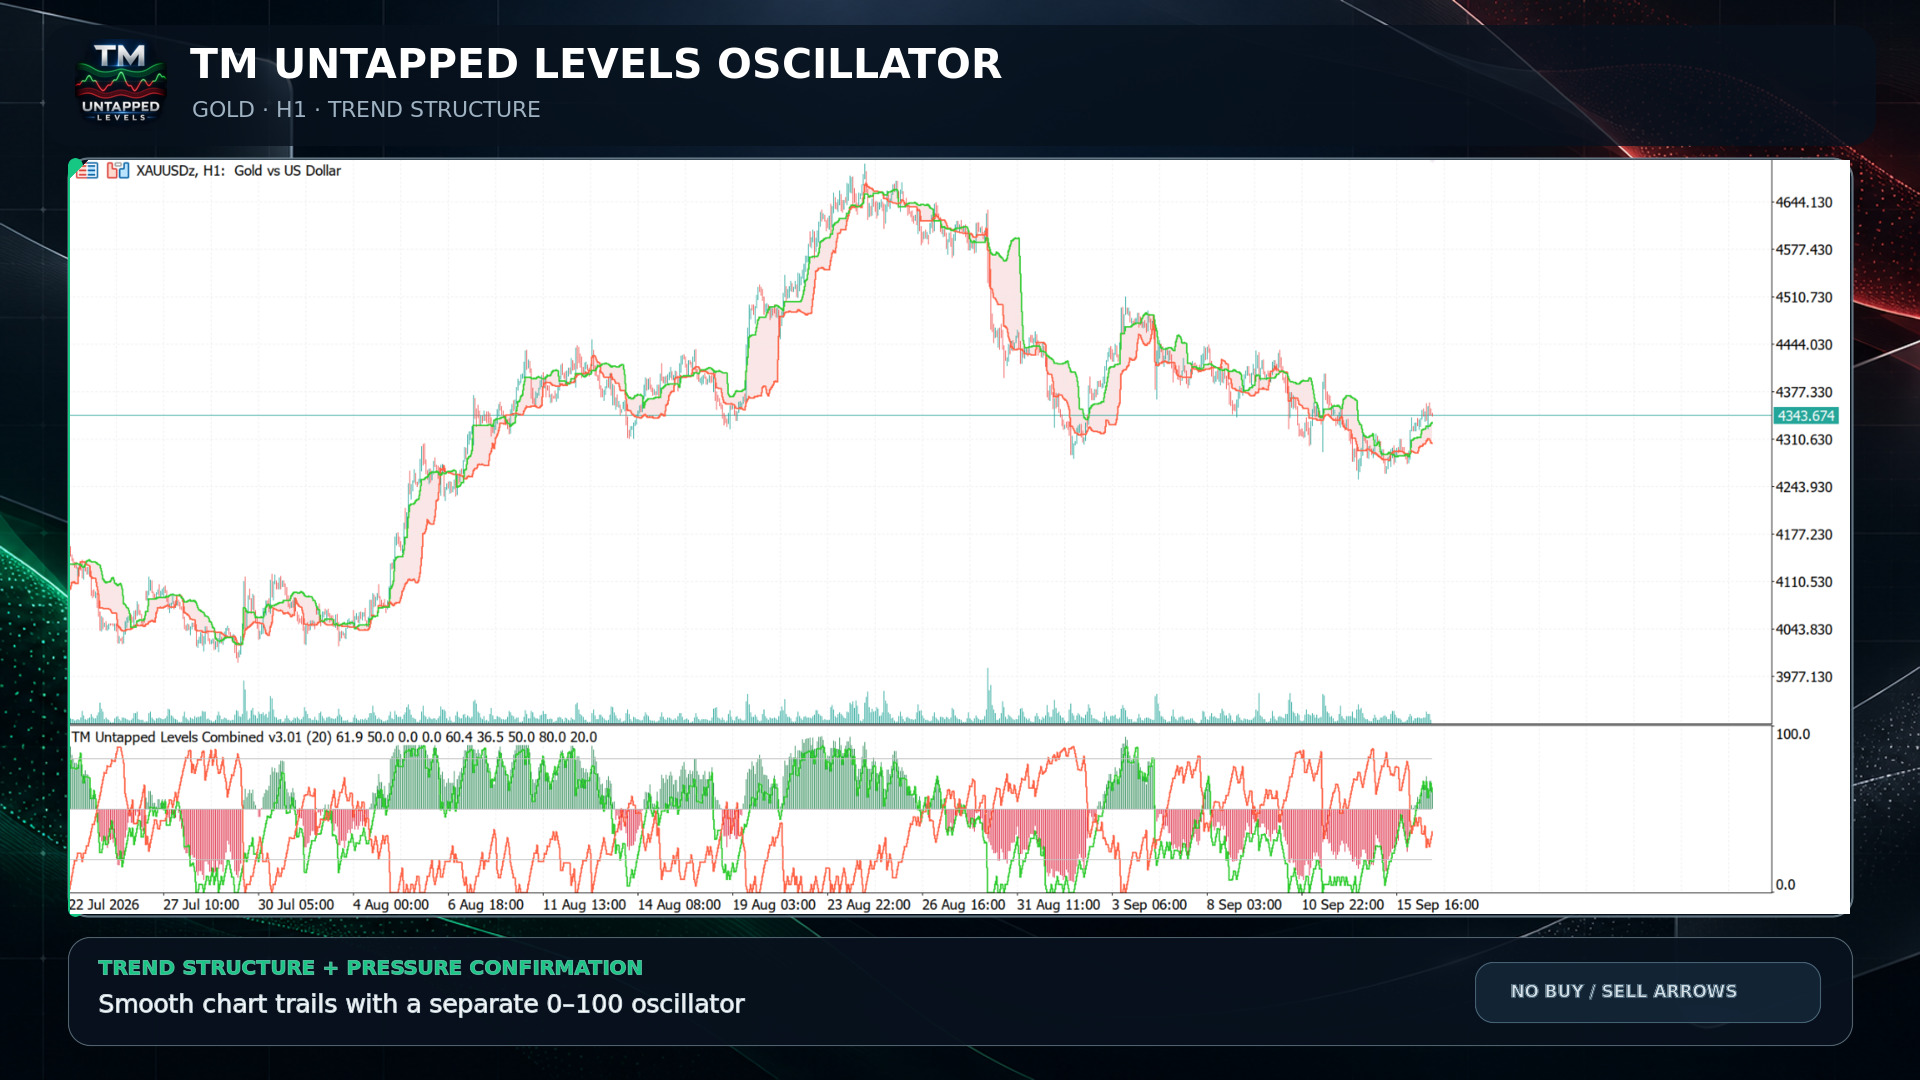
TM Untapped Levels Oscillator is a dual-display market pressure indicator for MetaTrader 5. It combines a clear oscillator panel with smooth trailing levels directly on the main price chart.

The indicator tracks prior highs and lows that remain untapped by later price action. Their persistence is converted into bullish and bearish pressure scores from 0 to 100. This helps traders see which side of the market is retaining more unresolved structure without covering the chart with buy and sell arrows.

KEY FEATURES

• Bullish and bearish pressure lines
• Centered two-color histogram around the 50 balance level
• Adjustable upper and lower reference thresholds
• Smooth upper and lower trailing levels on the main chart
• Optional shaded chart zone between the trails
• Up to 1,500 overlay bars displayed by default
• Quality-weighted scoring using level age and ATR-normalized distance
• Optional popup, push, email and sound alerts
• No buy or sell arrows on the chart
• Works on all symbols and timeframes


Download it for FREE
https://www.mql5.com/en/market/product/196347
Ramandeep Singh 已发布产品

TM Untapped Levels Oscillator 是一款适用于 MetaTrader 5 的双重显示市场压力指标。它将清晰的独立振荡器窗口与主价格图表上的平滑动态轨迹相结合。 该指标跟踪尚未被后续价格触及的历史高点和低点,并将这些价位的持续性转换为 0 到 100 的多头与空头压力评分。交易者可以在不使用买卖箭头干扰图表的情况下,观察市场哪一侧保留了更多尚未解决的价格结构。 主要功能 • 多头与空头压力线 • 以 50 平衡线为中心的双色柱状图 • 可调整的上限与下限参考水平 • 主图上的平滑上轨和下轨 • 可选的轨道间阴影区域 • 默认显示最多 1500 根历史覆盖柱 • 根据价位年龄和 ATR 标准化距离进行质量加权评分 • 可选弹窗、推送、电子邮件和声音提醒 • 图表上不显示买入或卖出箭头 • 适用于所有交易品种和时间周期 使用方法 绿色线表示持续存在的未触及低点所形成的压力,红色线表示未触及高点所形成的压力。数值高于 50 表示该侧持续性更强。80 和 20 参考水平可用于识别压力高度集中的区域。 主图轨迹基于 ATR

Ramandeep Singh 已发布产品

TM Volatility Scalping Edge 是一款适用于 MetaTrader 5 的自适应波动率指标,专为希望获得精选且清晰的短线交易机会,而不是持续接收大量信号的交易者设计。 该指标分析基于 ATR 的市场波动率、价格与动态波动边界的互动、方向性压力以及市场的重复运动。当所需条件一致时,图表上会显示绿色或橙色箭头,提示潜在的看涨或看跌机会。 自适应上轨和下轨会根据市场波动率的变化自动扩大或收缩,使指标能够适应安静、正常以及更加活跃的市场环境。 图表信息面板显示: • 当前波动率状态 • ATR 数值 • 向上和向下突破百分比 • 任意方向突破概率 • 重复运动概率 • 重复运动优势 • 当前市场活跃度 • 平衡、看涨或看跌的市场判断 主要功能: • 精选看涨和看跌箭头 • 自适应波动率通道 • 基于 ATR 的市场分析 • 方向性压力统计 • 重复市场运动分析 • 支持多个时间周期 • 适用于外汇、贵金属、指数和加密货币 • 简洁且轻量的图表显示 • 适合短线和剥头皮交易 • 完全免费

Ramandeep Singh
Understanding Liquidity and Market Structure with TM Liquidity Compass Market structure and liquidity are closely connected. Price frequently moves from one liquidity area toward another, while structural changes help traders understand whether buyers or sellers currently have greater influence...
Ramandeep Singh
Ramandeep Singh
TM Liquidity Compass is now completely FREE on the MQL5 Market.

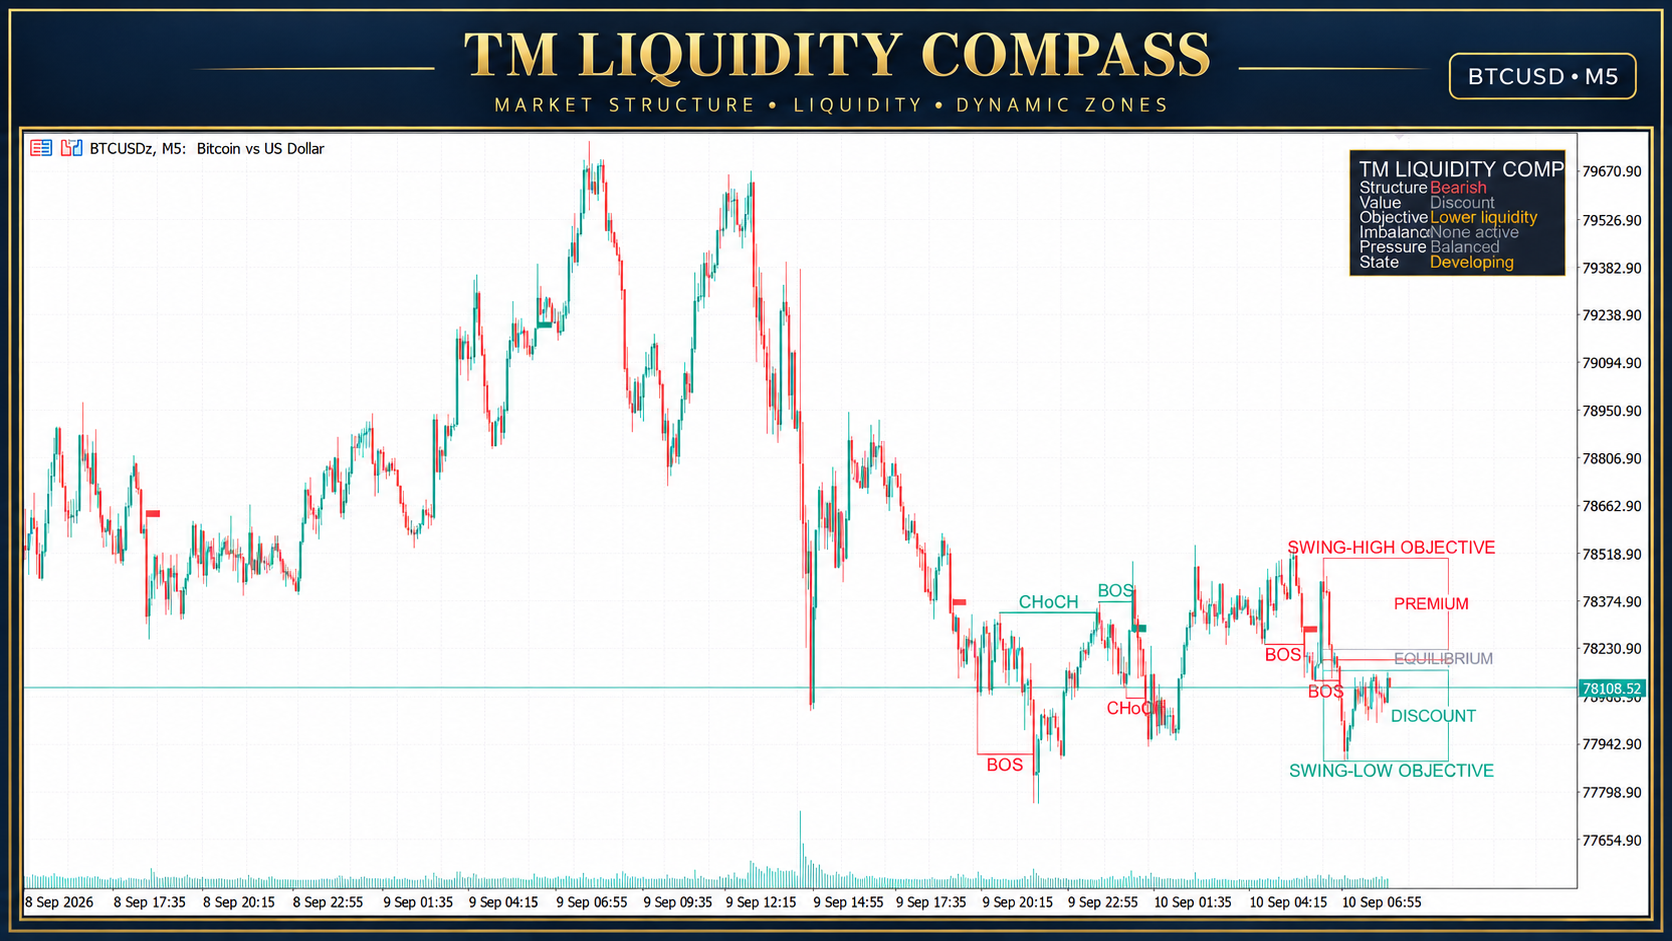
The indicator brings market structure and liquidity information together in one clear chart view:

• BOS and CHoCH
• Active bullish or bearish market bias
• Premium, equilibrium and discount areas
• Nearest upper and lower liquidity objectives
• Qualified imbalance and FVG areas
• One dynamic dominant support or resistance zone
• Compact Buyers, Sellers or Balanced pressure dashboard

TM Liquidity Compass is an analytical indicator for MetaTrader 5. It does not open, manage or close trades automatically.

Download it FREE:

https://www.mql5.com/en/market/product/195174

You can also open the MetaTrader 5 Market and search for “TM Liquidity Compass.”
Ramandeep Singh
How to Read Market Structure and Liquidity with TM Liquidity Compass A trading chart can contain dozens of signals, zones and technical labels. The real challenge is not finding more information—it is understanding which information matters now...
Ramandeep Singh
Ramandeep Singh
Introducing TM Liquidity Compass for MetaTrader 5.

TM Liquidity Compass brings market structure, liquidity context and value mapping together in one clean chart-based indicator.

Main features:

• Confirmed BOS and CHoCH structure markings
• Green and red trade-confirmation bands
• Premium, equilibrium and discount areas
• Upper and lower liquidity objectives
• One dynamic dominant support or resistance zone
• Qualified imbalance detection
• Compact market-context dashboard
• Adjustable visual and calculation settings

The dominant zone automatically adapts as market conditions change. Strong support is displayed in green and strong resistance in red. When a zone is breached or weakened, it is removed and replaced by a new qualifying area.

The indicator is designed to provide organized market context without overcrowding the chart.

TM Liquidity Compass is currently being prepared for release on the MQL5 Market.

This is an analytical tool and does not guarantee trading results. Always apply your own analysis and risk-management rules.

#MetaTrader5 #MQL5 #MarketStructure #Liquidity #BOS #CHoCH #TradingIndicator
Ramandeep Singh 已发布产品

TM Liquidity Compass 是一款用于 MetaTrader 5 图表的市场结构与流动性指标。 它将已确认的 BOS 和 CHoCH 标记、溢价/均衡/折价区域、附近的流动性目标、合格失衡检测,以及一个动态主导支撑或阻力区域整合在同一图表中。紧凑的信息面板显示当前结构、价值区域、目标、失衡、市场压力和市场状态。 主要功能: 已确认的 BOS 和 CHoCH 结构标记 绿色和红色的交易确认带 溢价、均衡和折价价值图 上方和下方流动性目标 一个动态主导支撑或阻力区域 可选择结构方向过滤的合格失衡检测 历史计算和可调显示设置 看涨 CHoCH 为潜在多头情景做准备,随后出现的看涨 BOS 确认多头提示并绘制一条短绿色带。看跌 CHoCH 为潜在空头情景做准备,随后出现的看跌 BOS 确认空头提示并绘制一条短红色带。 主导区域只显示一个当前有效区域。强支撑以绿色显示,强阻力以红色显示。当区域被突破或达到设定的回测次数后,该区域会被移除,并可由新的合格区域替代。 TM Liquidity Compass

Ramandeep Singh
TM QuantShift Regime Matrix: A Smarter Market Regime Indicator for MT5 Markets rarely move in one consistent condition. A clean bullish trend can lose momentum and become a range. A quiet market can suddenly enter a volatile phase...
Ramandeep Singh
Ramandeep Singh
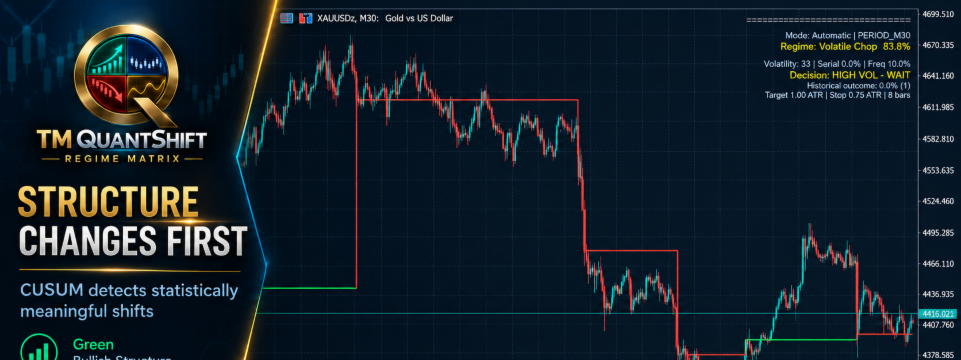
Introducing **TM QuantShift Regime Matrix** — now available on the MQL5 Market.

Markets do not behave the same way all the time. They transition between bullish trends, bearish trends, ranges and volatile conditions. QuantShift is designed to identify these structural changes and display each detected regime through clean, colour-coded levels directly on the chart.

Key features:

• Adaptive change-point detection
• Bullish, bearish, ranging and volatile-regime classification
• Clear regime-level visualization
• Automatic symbol and timeframe adaptation
• Suitable for Forex, Gold, Silver, Oil, indices and cryptocurrencies
• Particularly useful on M30 and H1
• No distracting BUY or SELL arrows

TM QuantShift Regime Matrix is a market-analysis tool—not an automated trading system. It helps traders understand when the character of the market may be changing before applying their own entry strategy and risk management.

**See the shift. Understand the regime. Trade with context.**

https://www.mql5.com/en/market/product/194664

#MQL5 #MetaTrader5 #TradingIndicator #MarketRegime #TechnicalAnalysis #ForexTrading #GoldTrading #AlgorithmicTrading #TradingMantra
Ramandeep Singh 已发布产品

TM QuantShift Regime Matrix 是一款适用于 MetaTrader 5 的自适应市场状态分析指标。它旨在从日常价格噪音中识别并清晰展示重要的市场行为变化。 该指标结合了三个量化分析模块: 1. 变化点检测 CUSUM 模块分析标准化价格收益率和累积方向压力,用于识别具有意义的市场结构变化。 2. 概率市场状态 状态模型通过评估价格方向、走势效率和波动特征,估算市场当前处于看涨、看跌、震荡或高波动状态的可能性。 3. ATR 波动持续性 波动模块用于判断异常幅度的价格运动是一次性事件,还是持续波动扩张的一部分。 如何解读指标 绿色线段表示看涨结构压力,红色线段表示看跌结构压力,中性线段表示市场尚未形成清晰方向。中央阶梯线标记最近一次检测到结构变化时对应的价格水平。周围的压力线展示正向和负向统计压力的累积过程。 这些线不是支撑位、阻力位、止损位或止盈位。它们用于提供市场分析背景,应与交易者自己的交易策略结合使用。 主要功能 - 自适应 CUSUM 变化点检测 - 看涨、看跌、震荡和高波动状态分析 - 正向与负向压力可视化 - 基于 ATR 的波动和持续性测量 -

Ramandeep Singh
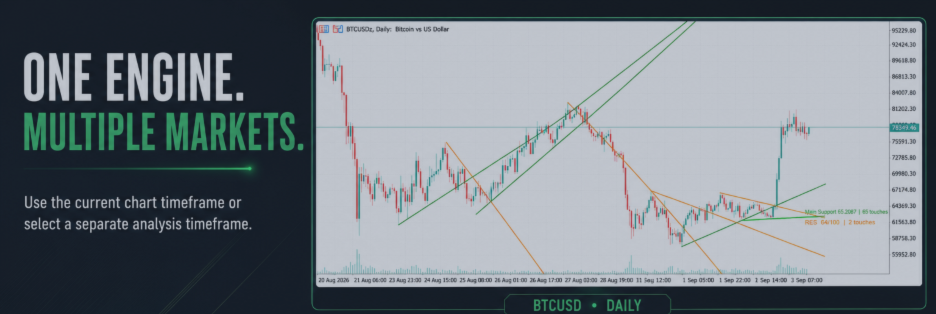
Automatic Trendline Analysis for MT5: Introducing Trendline MachineGun Trendlines are among the most widely used tools in technical analysis. They help traders identify market direction, dynamic support, dynamic resistance, breakout areas and possible zones of confluence...
Ramandeep Singh
Ramandeep Singh
Trendline MachineGun MT5 is now available.

A professional MT5 indicator designed to automatically detect, rank and display meaningful support and resistance trendlines.

Key features:

• Automatic support and resistance trendlines
• Strength scores from 0 to 100
• Historical touch analysis
• Similar-line filtering
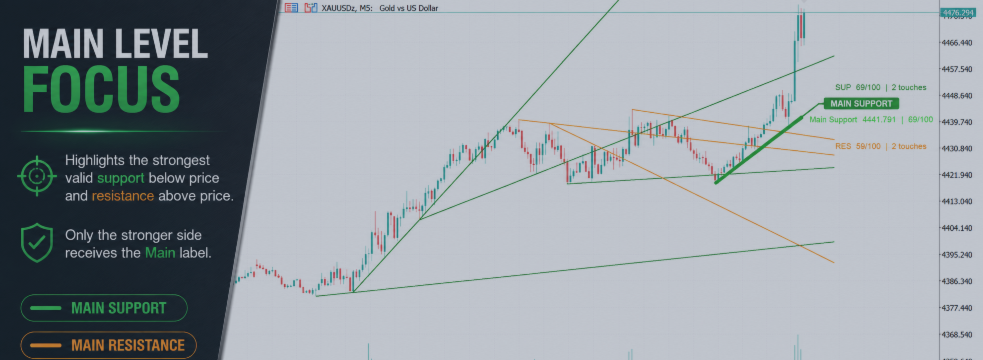
• Main Support or Main Resistance identification
• Pressure Zone detection
• Multi-timeframe analysis
• Clean display with only three principal labels

Instead of treating every trendline equally, Trendline MachineGun helps bring the strongest current structures into focus.

Explore it on MQL5 Market:

https://www.mql5.com/en/market/product/194003?source=Site+Profile

Trendline MachineGun MT5 is an analytical indicator and does not execute trades.

#MetaTrader5 #MQL5 #Trendlines #TechnicalAnalysis #ForexTrading #TradingIndicator
12