Ramandeep Singh
Ramandeep Singh
  • Информация
нет
опыт работы
9
продуктов
1
демо-версий
0
работ
0
сигналов
0
подписчиков
Algorithmic Trader & MT5 Developer в Traders Mantra
X
I am an algorithmic trader, technical analyst and MT5 tool developer focused on Gold (XAUUSD), Silver and Forex. I have applied Elliott Wave analysis in live markets since 2020, supported by market structure, trendline analysis, momentum, volatility and trading psychology.

At Traders Mantra, I research systematic trading ideas and develop practical MT5 indicators and Expert Advisors. My work focuses on clear trading logic, controlled risk, realistic backtesting and tools that simplify complex price behaviour without making exaggerated promises.

I am the developer of Smart Trendline Detector for MetaTrader 5. I also share product guidance, trading research and educational market insights through my MQL5 blog and channel.
Ramandeep Singh
A screenshot shows what an indicator looked like at one selected moment. A demo helps you examine how it behaves across many moments...
Ramandeep Singh
Ramandeep Singh
A trading tool should not earn trust from one attractive screenshot.
I test an indicator by changing the symbol, timeframe and market condition, then watching what changes when new candles arrive. For risk tools, I manually verify at least one calculation. For analytical tools, I check whether historical objects move, disappear or appear late.
A demo is not merely a preview. Used properly, it is a small controlled experiment.
This is also the right way to evaluate tools such as Trendline Machinegun or Smart Trendline Detector: test the behaviour first, then decide whether it fits your own trading process.
Ramandeep Singh
Ramandeep Singh
A trendline looks obvious after the move. The real test is whether you could have drawn and used it before the breakout.

When I test a trendline indicator, I watch three things:

• When did the line first appear?
• Did its anchor points change as new candles formed?
• Was the breakout visible in real time, or only on the historical chart?

A clean screenshot can’t answer those questions. Forward testing can.

What do you check first when testing a trendline indicator?
Ramandeep Singh
A candle closing outside a price envelope attracts attention. It does not, by itself, tell us whether the move will continue or reverse. TM Price Stretch Map is a free MetaTrader 5 indicator built around a simple sequence: stretch, return inside, then assess the trade...
Ramandeep Singh
Ramandeep Singh
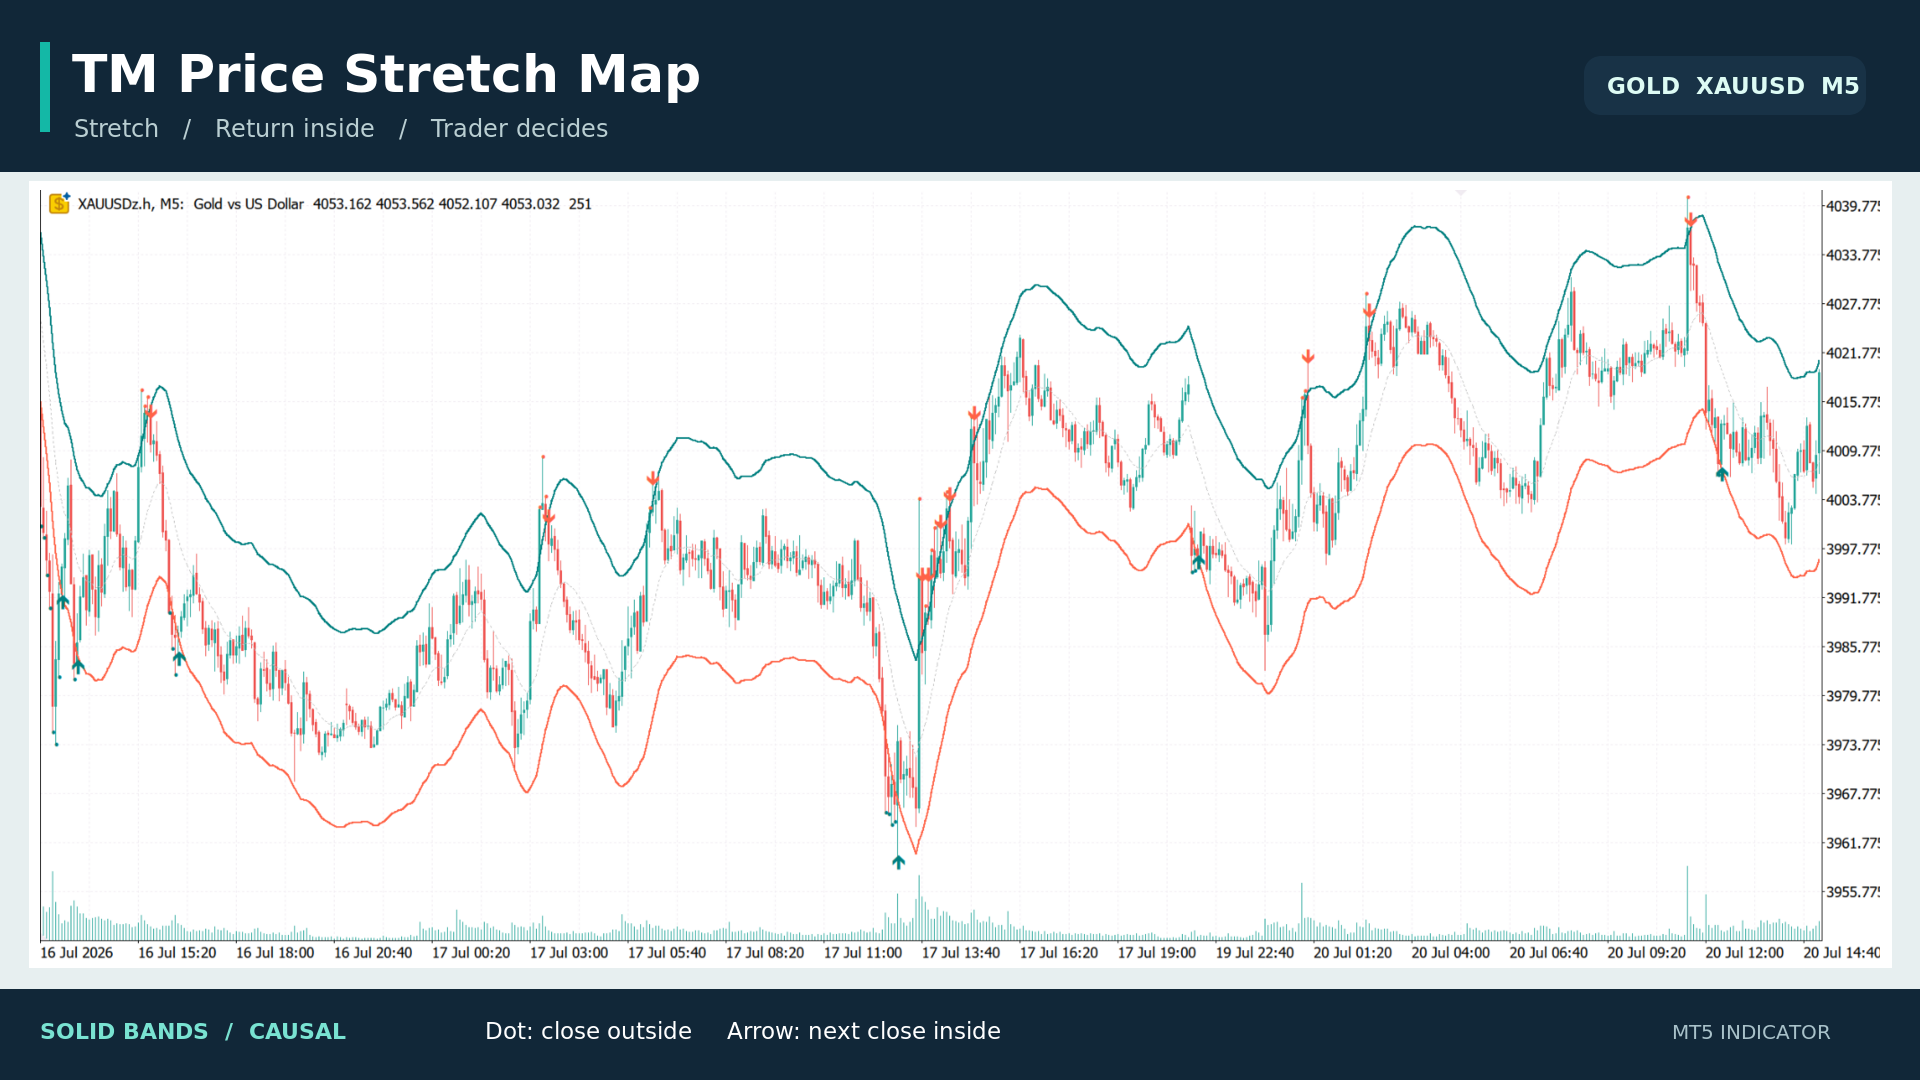
Introducing TM Price Stretch Map, my free indicator for MetaTrader 5.

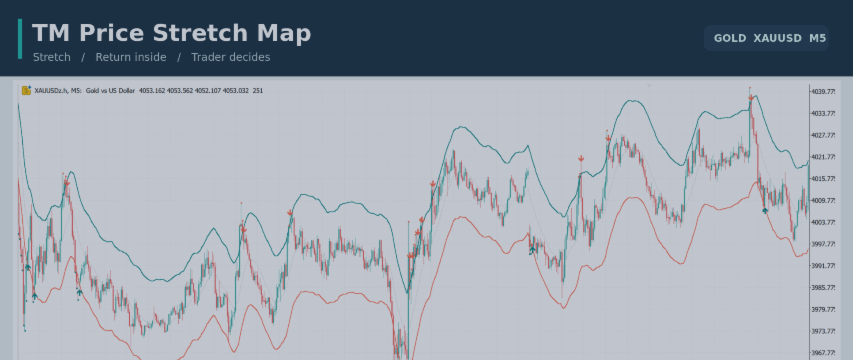
The idea is simple: first spot a candle that closes beyond the price envelope. Then watch whether the next completed candle closes back inside. Small dots mark the stretch; arrows mark the return.

The solid bands and markers use prices available at the time of each candle. There is also an optional dashed smoothing overlay for visual analysis, which can repaint. It does not generate the markers.

A return inside the bands is a setup to examine, not an automatic trade. I use it alongside market structure, trend and risk management.

https://www.mql5.com/en/market/product/197922

Search for “TM Price Stretch Map” in my MQL5 Market products to download it free. I’d be interested to hear which symbol and timeframe you try it on.
Ramandeep Singh Выставил продукт

TM Price Stretch Map показывает ценовой канал и помогает заметить закрытие свечи за его границей, а затем возврат следующей завершённой свечи внутрь канала. Сплошные границы рассчитываются каузальным гауссовым методом, использующим только доступные на тот момент данные. Красная точка отмечает закрытие выше верхней границы, бирюзовая — закрытие ниже нижней. Стрелка вниз появляется, если следующая завершённая свеча после выхода вверх закрылась внутри обеих границ; стрелка вверх показывает такой же

Ramandeep Singh
TM Untapped Levels Oscillator for MT5 – See Market Pressure Beyond Price Markets constantly leave behind unfinished price interaction...
Ramandeep Singh
Ramandeep Singh
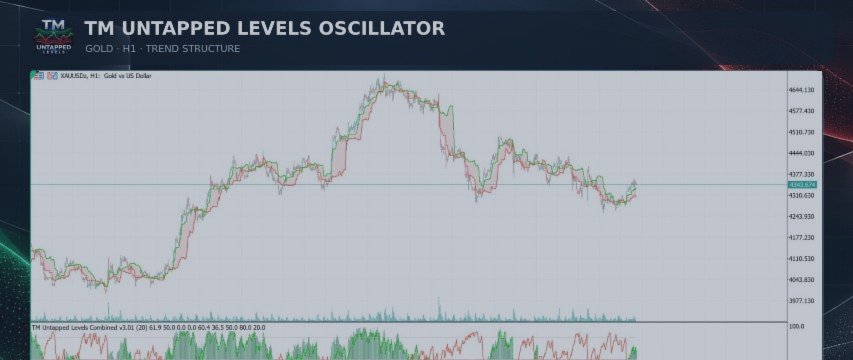
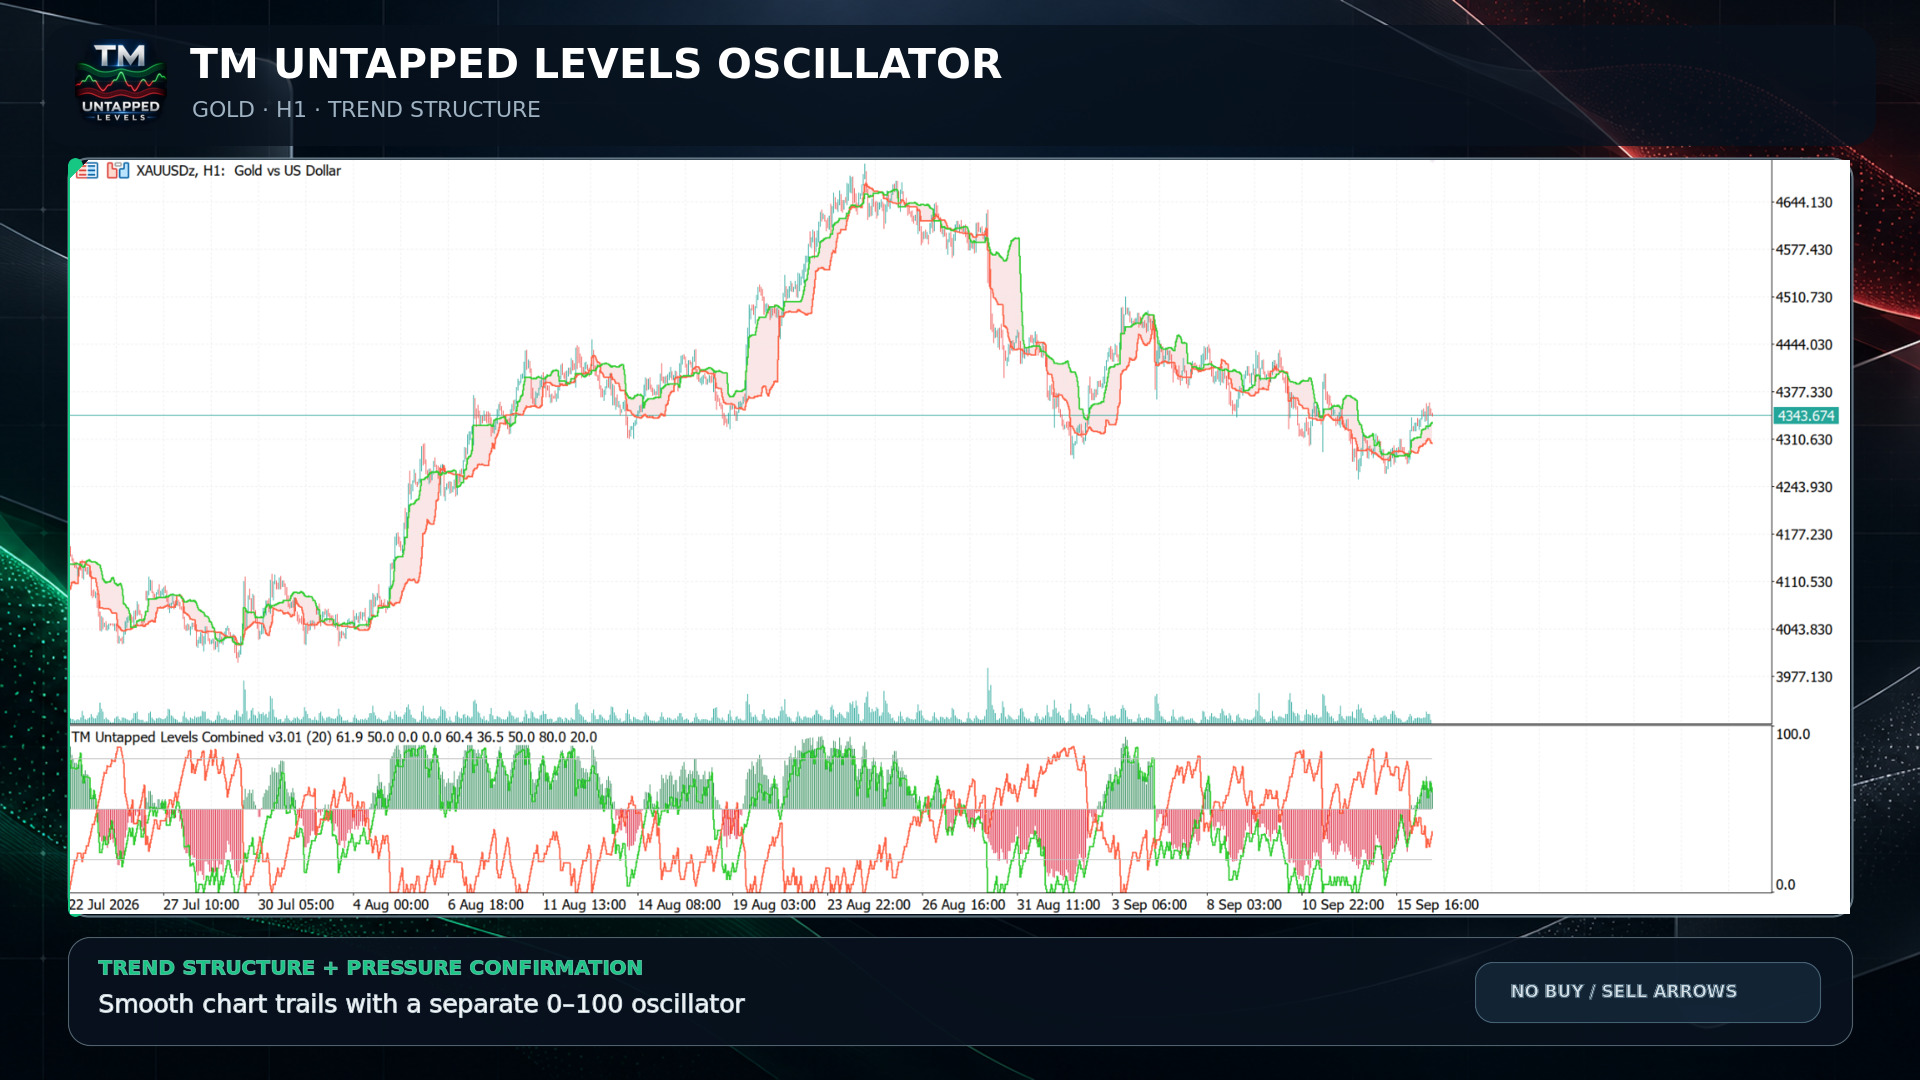
TM Untapped Levels Oscillator is a dual-display market pressure indicator for MetaTrader 5. It combines a clear oscillator panel with smooth trailing levels directly on the main price chart.

The indicator tracks prior highs and lows that remain untapped by later price action. Their persistence is converted into bullish and bearish pressure scores from 0 to 100. This helps traders see which side of the market is retaining more unresolved structure without covering the chart with buy and sell arrows.

KEY FEATURES

• Bullish and bearish pressure lines
• Centered two-color histogram around the 50 balance level
• Adjustable upper and lower reference thresholds
• Smooth upper and lower trailing levels on the main chart
• Optional shaded chart zone between the trails
• Up to 1,500 overlay bars displayed by default
• Quality-weighted scoring using level age and ATR-normalized distance
• Optional popup, push, email and sound alerts
• No buy or sell arrows on the chart
• Works on all symbols and timeframes


Download it for FREE
https://www.mql5.com/en/market/product/196347
Ramandeep Singh Выставил продукт

TM Untapped Levels Oscillator — это индикатор рыночного давления с двойным отображением для MetaTrader 5. Он объединяет наглядный осциллятор в отдельном окне и плавные динамические уровни непосредственно на основном графике цены. Индикатор отслеживает предыдущие максимумы и минимумы, которые еще не были достигнуты последующим движением цены. Их устойчивость преобразуется в оценки бычьего и медвежьего давления от 0 до 100. Это помогает определить, на какой стороне рынка сохраняется больше

Ramandeep Singh Выставил продукт

TM Volatility Scalping Edge — это адаптивный индикатор волатильности для MetaTrader 5, созданный для трейдеров, предпочитающих избирательные и понятные возможности для скальпинга вместо постоянного потока сигналов. Индикатор анализирует волатильность на основе ATR, взаимодействие цены с динамическими границами волатильности, направленное давление и повторяющиеся движения рынка. Когда необходимые условия совпадают, зеленая или оранжевая стрелка отмечает потенциальную бычью или медвежью торговую

Ramandeep Singh
Understanding Liquidity and Market Structure with TM Liquidity Compass Market structure and liquidity are closely connected. Price frequently moves from one liquidity area toward another, while structural changes help traders understand whether buyers or sellers currently have greater influence...
Ramandeep Singh
Ramandeep Singh
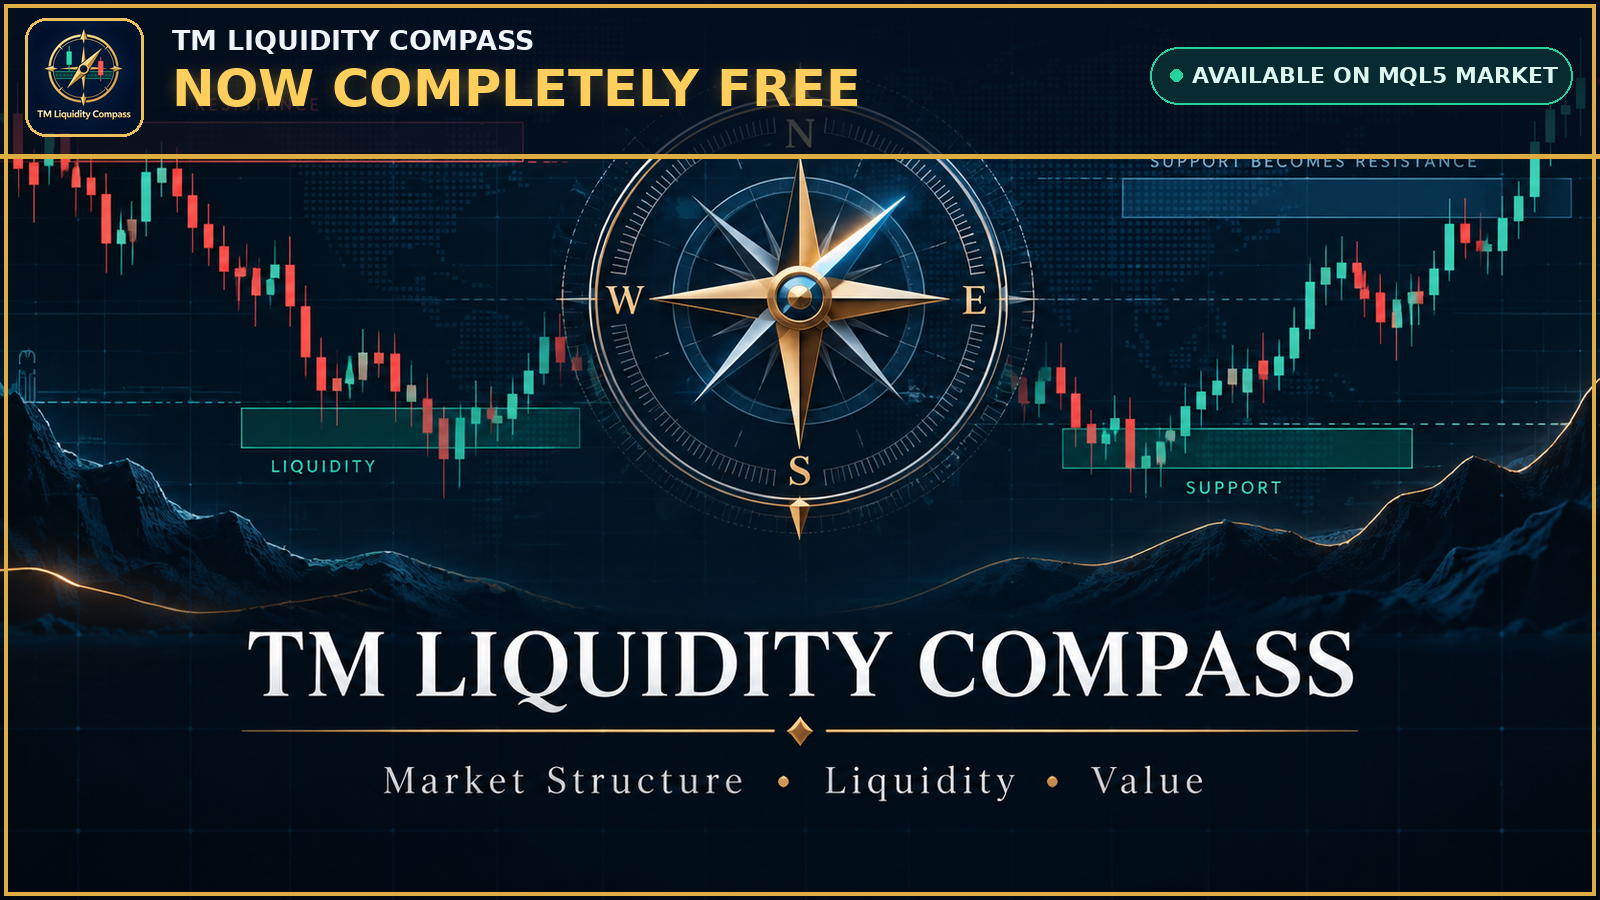
TM Liquidity Compass is now completely FREE on the MQL5 Market.

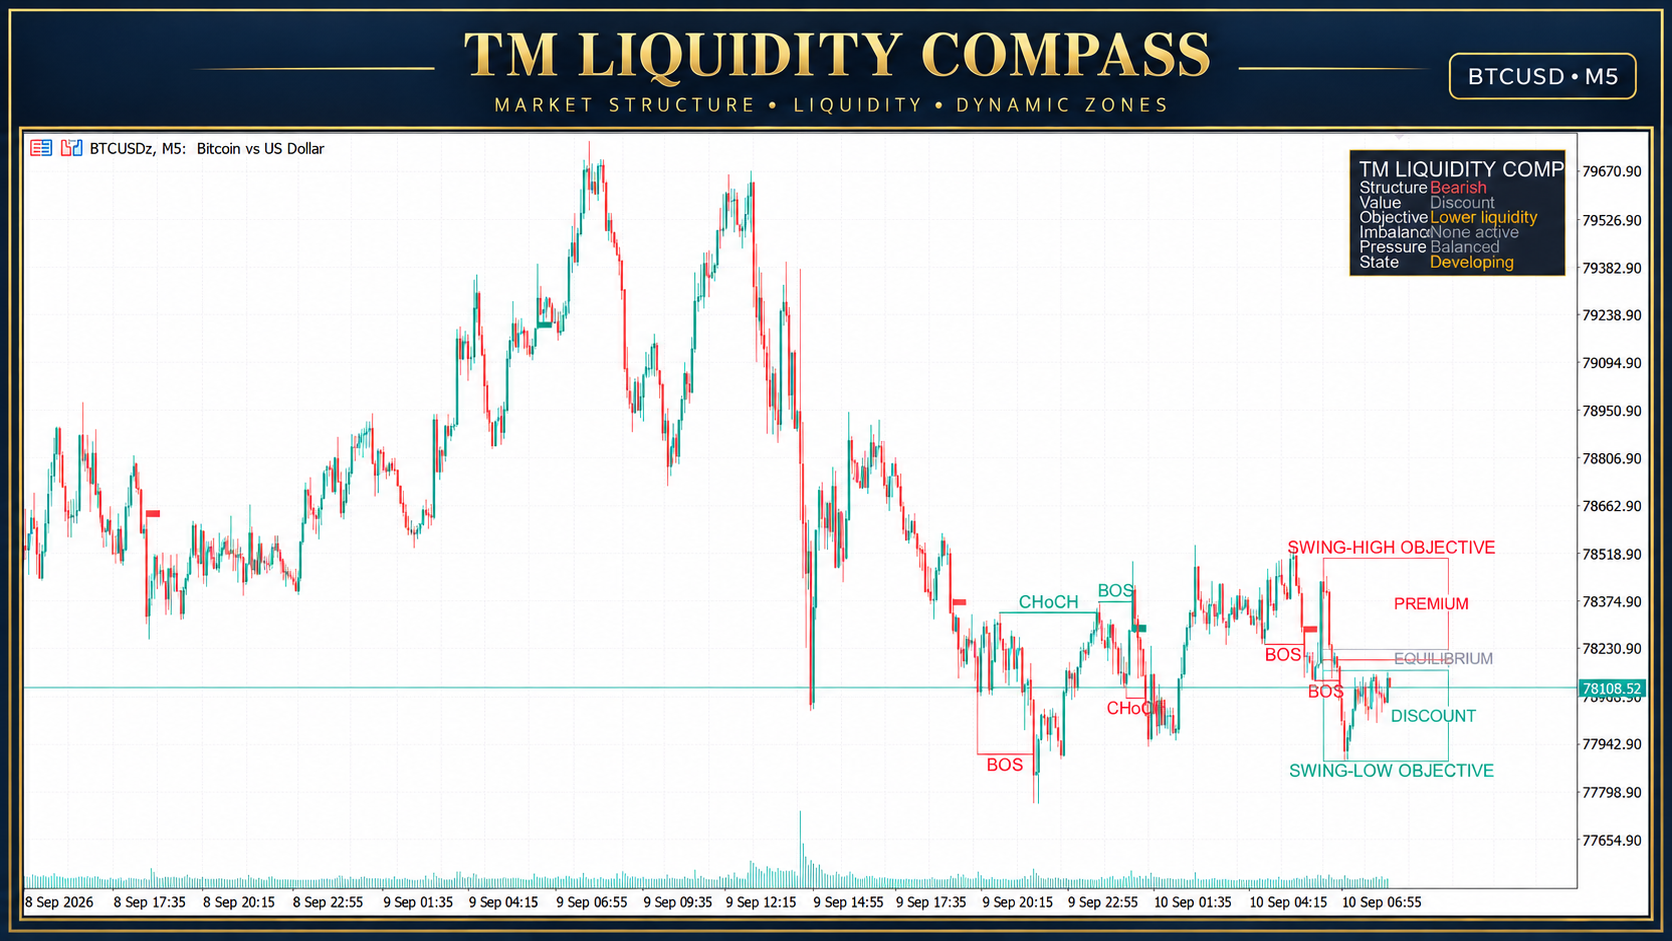
The indicator brings market structure and liquidity information together in one clear chart view:

• BOS and CHoCH
• Active bullish or bearish market bias
• Premium, equilibrium and discount areas
• Nearest upper and lower liquidity objectives
• Qualified imbalance and FVG areas
• One dynamic dominant support or resistance zone
• Compact Buyers, Sellers or Balanced pressure dashboard

TM Liquidity Compass is an analytical indicator for MetaTrader 5. It does not open, manage or close trades automatically.

Download it FREE:

https://www.mql5.com/en/market/product/195174

You can also open the MetaTrader 5 Market and search for “TM Liquidity Compass.”
Ramandeep Singh
How to Read Market Structure and Liquidity with TM Liquidity Compass A trading chart can contain dozens of signals, zones and technical labels. The real challenge is not finding more information—it is understanding which information matters now...
Ramandeep Singh
Ramandeep Singh
Introducing TM Liquidity Compass for MetaTrader 5.

TM Liquidity Compass brings market structure, liquidity context and value mapping together in one clean chart-based indicator.

Main features:

• Confirmed BOS and CHoCH structure markings
• Green and red trade-confirmation bands
• Premium, equilibrium and discount areas
• Upper and lower liquidity objectives
• One dynamic dominant support or resistance zone
• Qualified imbalance detection
• Compact market-context dashboard
• Adjustable visual and calculation settings

The dominant zone automatically adapts as market conditions change. Strong support is displayed in green and strong resistance in red. When a zone is breached or weakened, it is removed and replaced by a new qualifying area.

The indicator is designed to provide organized market context without overcrowding the chart.

TM Liquidity Compass is currently being prepared for release on the MQL5 Market.

This is an analytical tool and does not guarantee trading results. Always apply your own analysis and risk-management rules.

#MetaTrader5 #MQL5 #MarketStructure #Liquidity #BOS #CHoCH #TradingIndicator
Ramandeep Singh Выставил продукт

TM Liquidity Compass — это индикатор структуры рынка и ликвидности для графиков MetaTrader 5. Он объединяет подтвержденные отметки BOS и CHoCH, зоны премии, равновесия и дисконта, ближайшие цели ликвидности, поиск квалифицированных дисбалансов и одну динамическую доминирующую зону поддержки или сопротивления. Компактная панель показывает текущую структуру, область стоимости, цель, дисбаланс, давление и состояние рынка. Основные возможности: Подтвержденные отметки структуры BOS и CHoCH Зеленые и

Ramandeep Singh
TM QuantShift Regime Matrix: A Smarter Market Regime Indicator for MT5 Markets rarely move in one consistent condition. A clean bullish trend can lose momentum and become a range. A quiet market can suddenly enter a volatile phase...
Ramandeep Singh
Ramandeep Singh
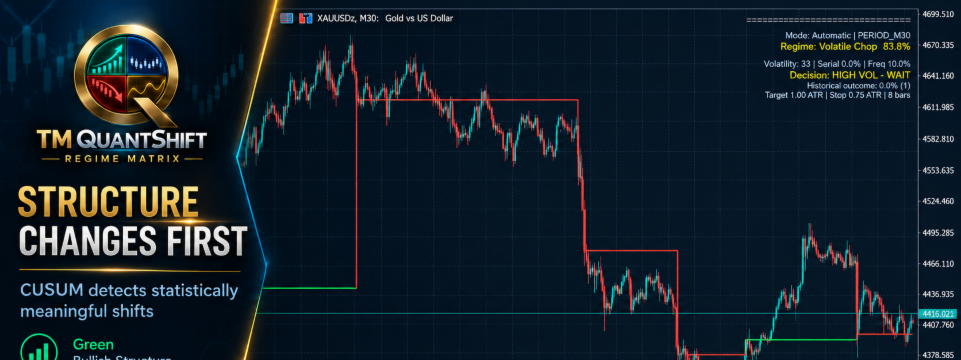
Introducing **TM QuantShift Regime Matrix** — now available on the MQL5 Market.

Markets do not behave the same way all the time. They transition between bullish trends, bearish trends, ranges and volatile conditions. QuantShift is designed to identify these structural changes and display each detected regime through clean, colour-coded levels directly on the chart.

Key features:

• Adaptive change-point detection
• Bullish, bearish, ranging and volatile-regime classification
• Clear regime-level visualization
• Automatic symbol and timeframe adaptation
• Suitable for Forex, Gold, Silver, Oil, indices and cryptocurrencies
• Particularly useful on M30 and H1
• No distracting BUY or SELL arrows

TM QuantShift Regime Matrix is a market-analysis tool—not an automated trading system. It helps traders understand when the character of the market may be changing before applying their own entry strategy and risk management.

**See the shift. Understand the regime. Trade with context.**

https://www.mql5.com/en/market/product/194664

#MQL5 #MetaTrader5 #TradingIndicator #MarketRegime #TechnicalAnalysis #ForexTrading #GoldTrading #AlgorithmicTrading #TradingMantra
Ramandeep Singh Выставил продукт

TM QuantShift Regime Matrix — это адаптивный индикатор состояния рынка для MetaTrader 5. Он помогает увидеть важные изменения поведения рынка, которые часто теряются внутри обычного ценового шума. Индикатор объединяет три количественных аналитических модуля: 1. Обнаружение точек изменения Алгоритм CUSUM анализирует стандартизированную доходность цены и накопленное направленное давление, чтобы выявлять значимые структурные изменения. 2. Вероятностные рыночные режимы Модель оценивает направление

Ramandeep Singh
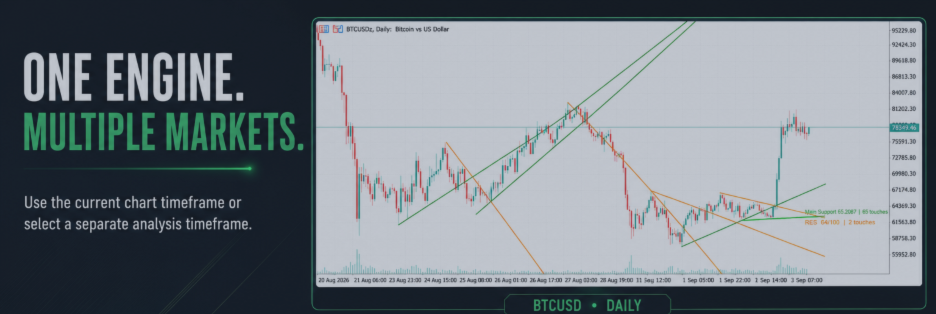
Automatic Trendline Analysis for MT5: Introducing Trendline MachineGun Trendlines are among the most widely used tools in technical analysis. They help traders identify market direction, dynamic support, dynamic resistance, breakout areas and possible zones of confluence...
Ramandeep Singh
Ramandeep Singh
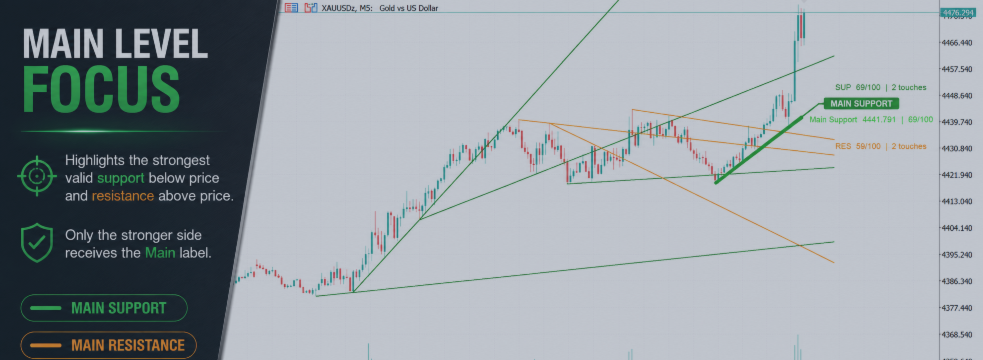
Trendline MachineGun MT5 is now available.

A professional MT5 indicator designed to automatically detect, rank and display meaningful support and resistance trendlines.

Key features:

• Automatic support and resistance trendlines
• Strength scores from 0 to 100
• Historical touch analysis
• Similar-line filtering
• Main Support or Main Resistance identification
• Pressure Zone detection
• Multi-timeframe analysis
• Clean display with only three principal labels

Instead of treating every trendline equally, Trendline MachineGun helps bring the strongest current structures into focus.

Explore it on MQL5 Market:

https://www.mql5.com/en/market/product/194003?source=Site+Profile

Trendline MachineGun MT5 is an analytical indicator and does not execute trades.

#MetaTrader5 #MQL5 #Trendlines #TechnicalAnalysis #ForexTrading #TradingIndicator
12